Arbitrage analytics for crude oil
Real-time value comparison, refining margins & route profitability


.webp)


Kpler is one of the few truly objective research outfits. No agenda, just data-driven insights.
Aldo Spanjer, Commodity Strategist


Kpler’s Arbitrage platform turns complex freight, quality, and benchmark data into simple, actionable arbitrage insights so you can discover value windows, rank opportunities, and build scenarios confidently.
With Arbitrage you can:
- Compare delivered crude values by region and freight cost
- Quantify refining margins and route profitability
- Spot open arbitrage opportunities quickly
- Breakdown value drivers like FOB differentials, spreads, and freight
- Model scenarios with custom market inputs
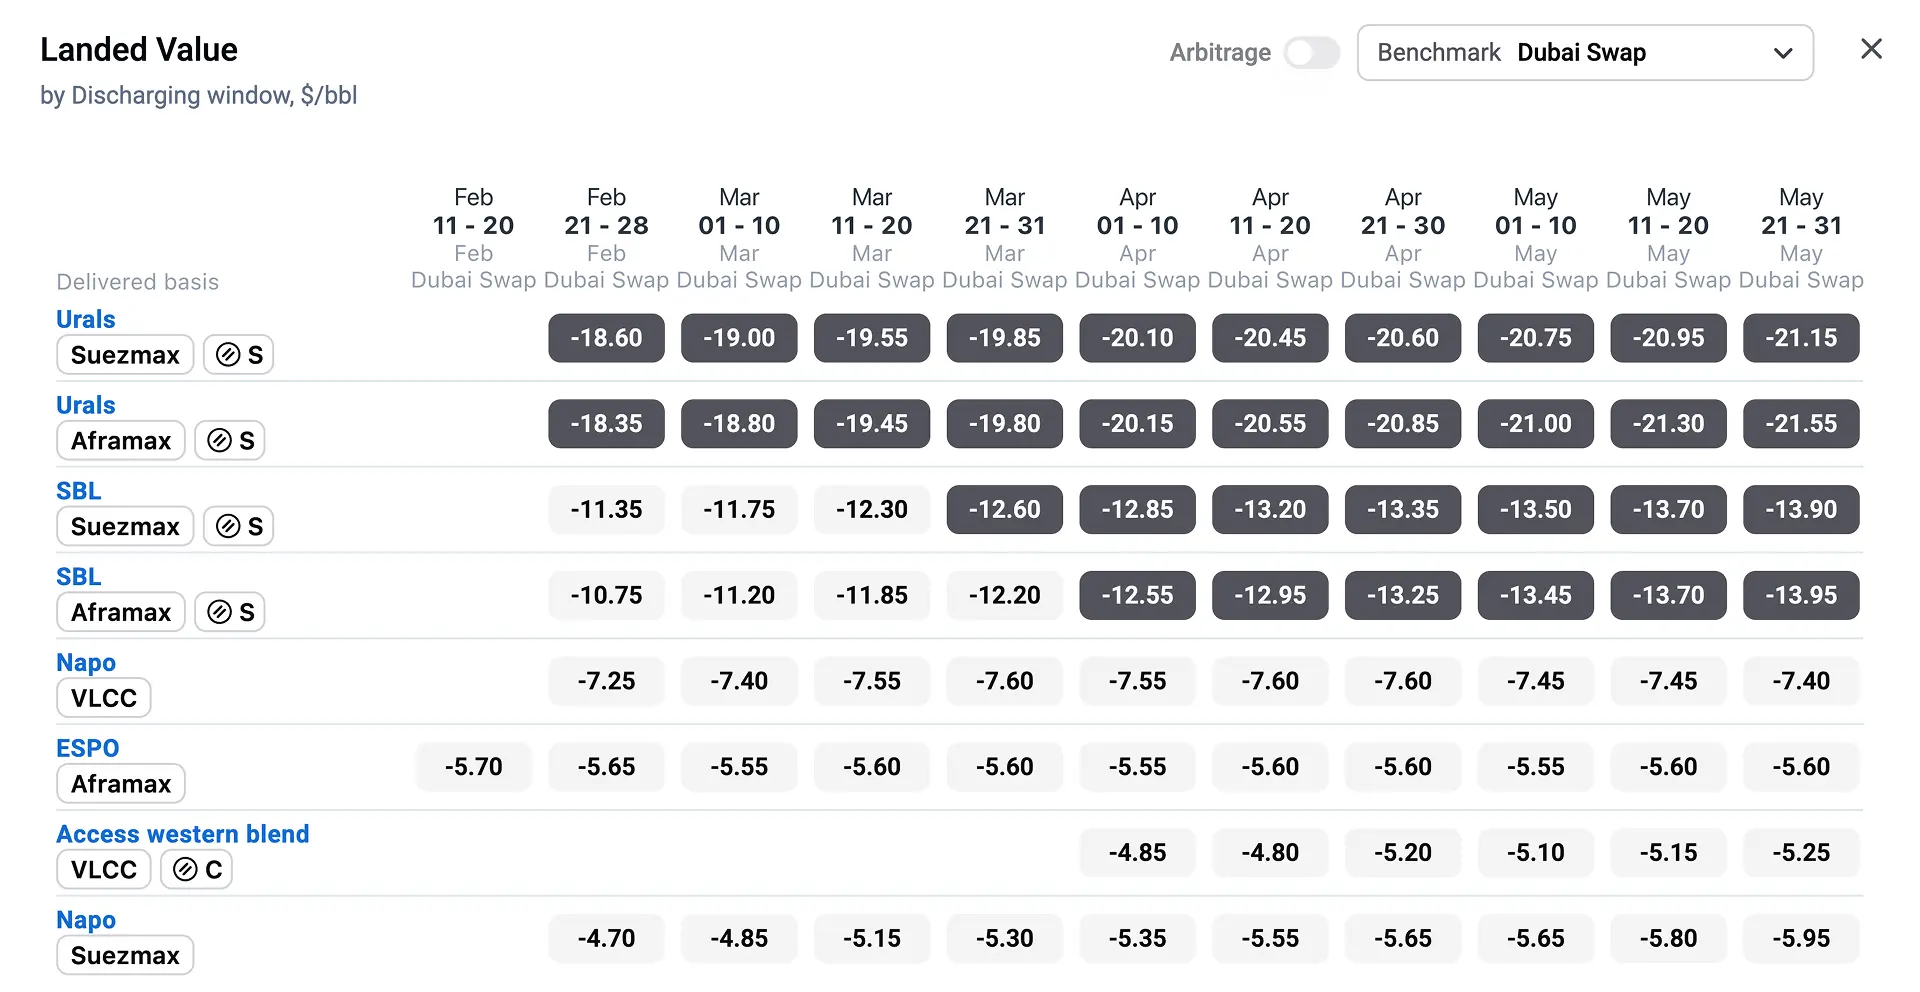
Landed value
Pinpoint the most profitable crude routes by comparing delivered values across regions, factoring in freight, quality, and pricing.
- Split by origin/destination, grades, matrix granularity (5 day, 10 day, or monthly), vessel classifications, refinery type
- Greyscale cells update every 30 minutes
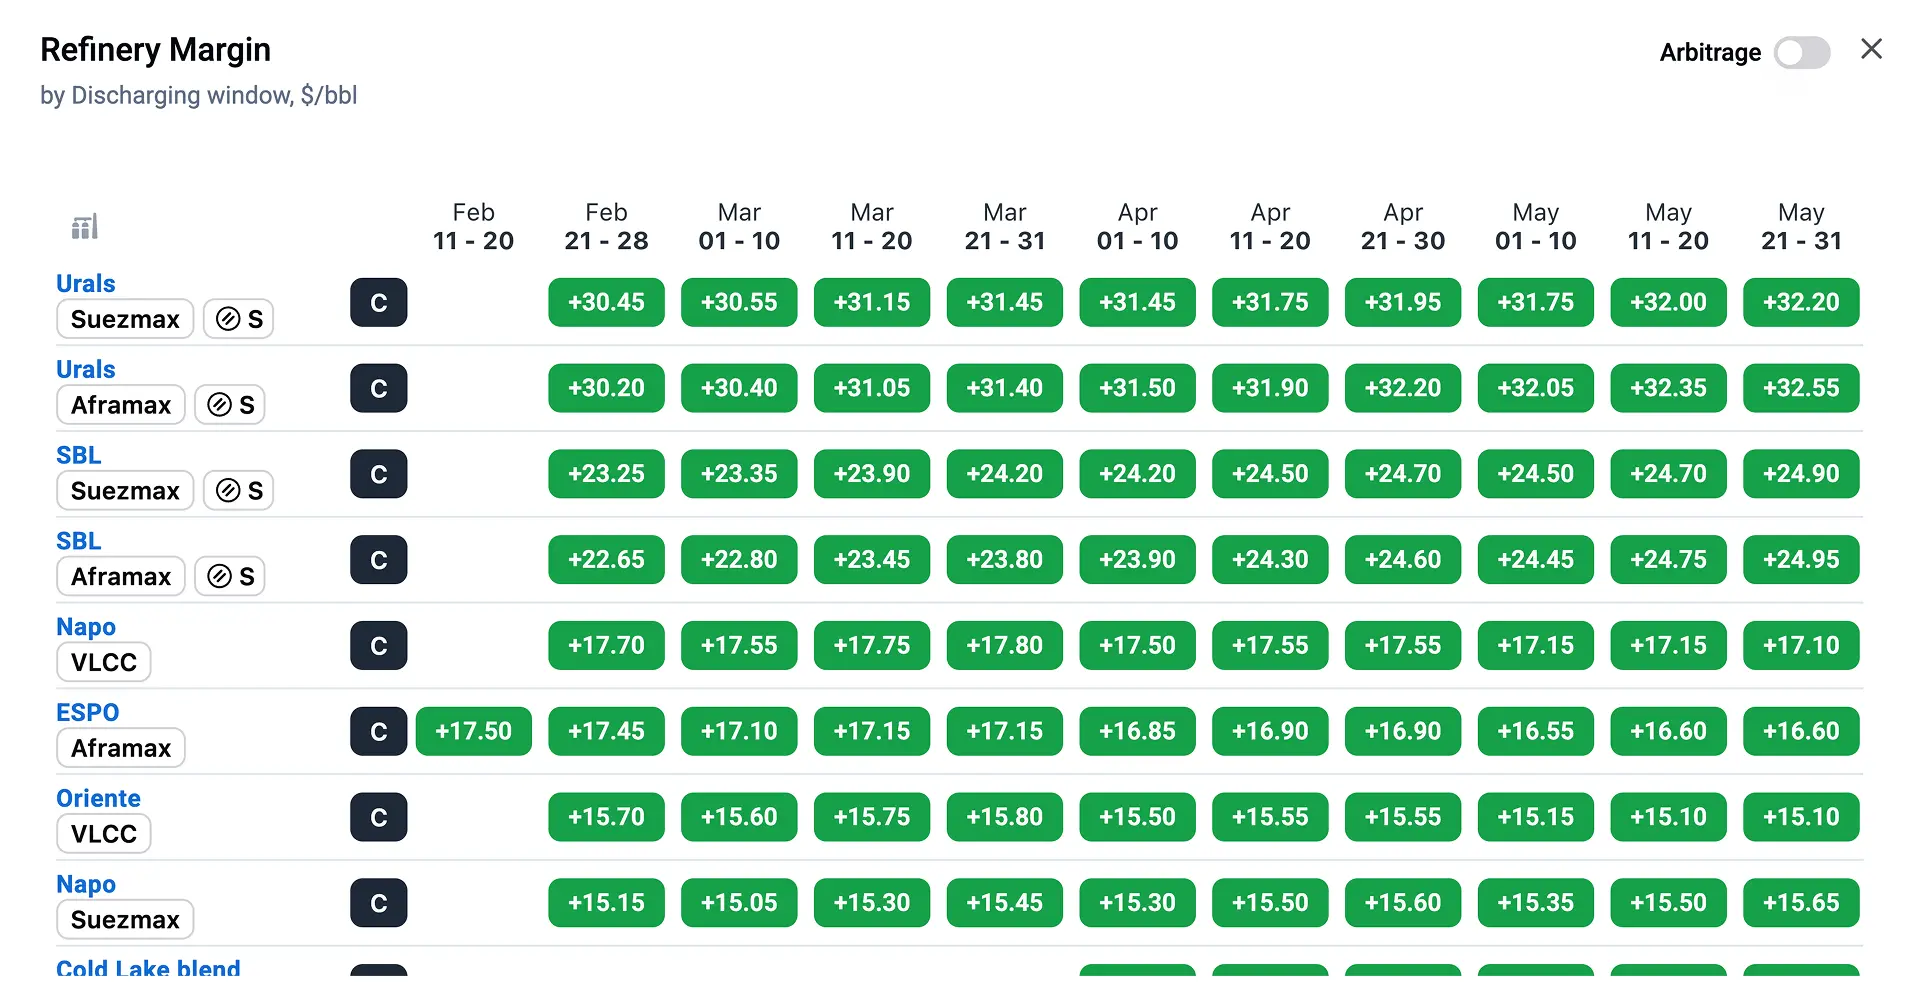
Refining margins
Instantly gauge refinery profitability by tracking crude costs versus refined product values across global markets.
- The matrix displays refining margins by crude, refinery type, route, vessel type, and voyage time
- The refining margin view is the profit lens: how much money can a refiner make running this crude?
- It shows the absolute profit potential of each crude for a refinery type
- The landed value doesn’t take crude quality into consideration - the refinery margin does
- This view is useful for ranking crude grades for a refinery
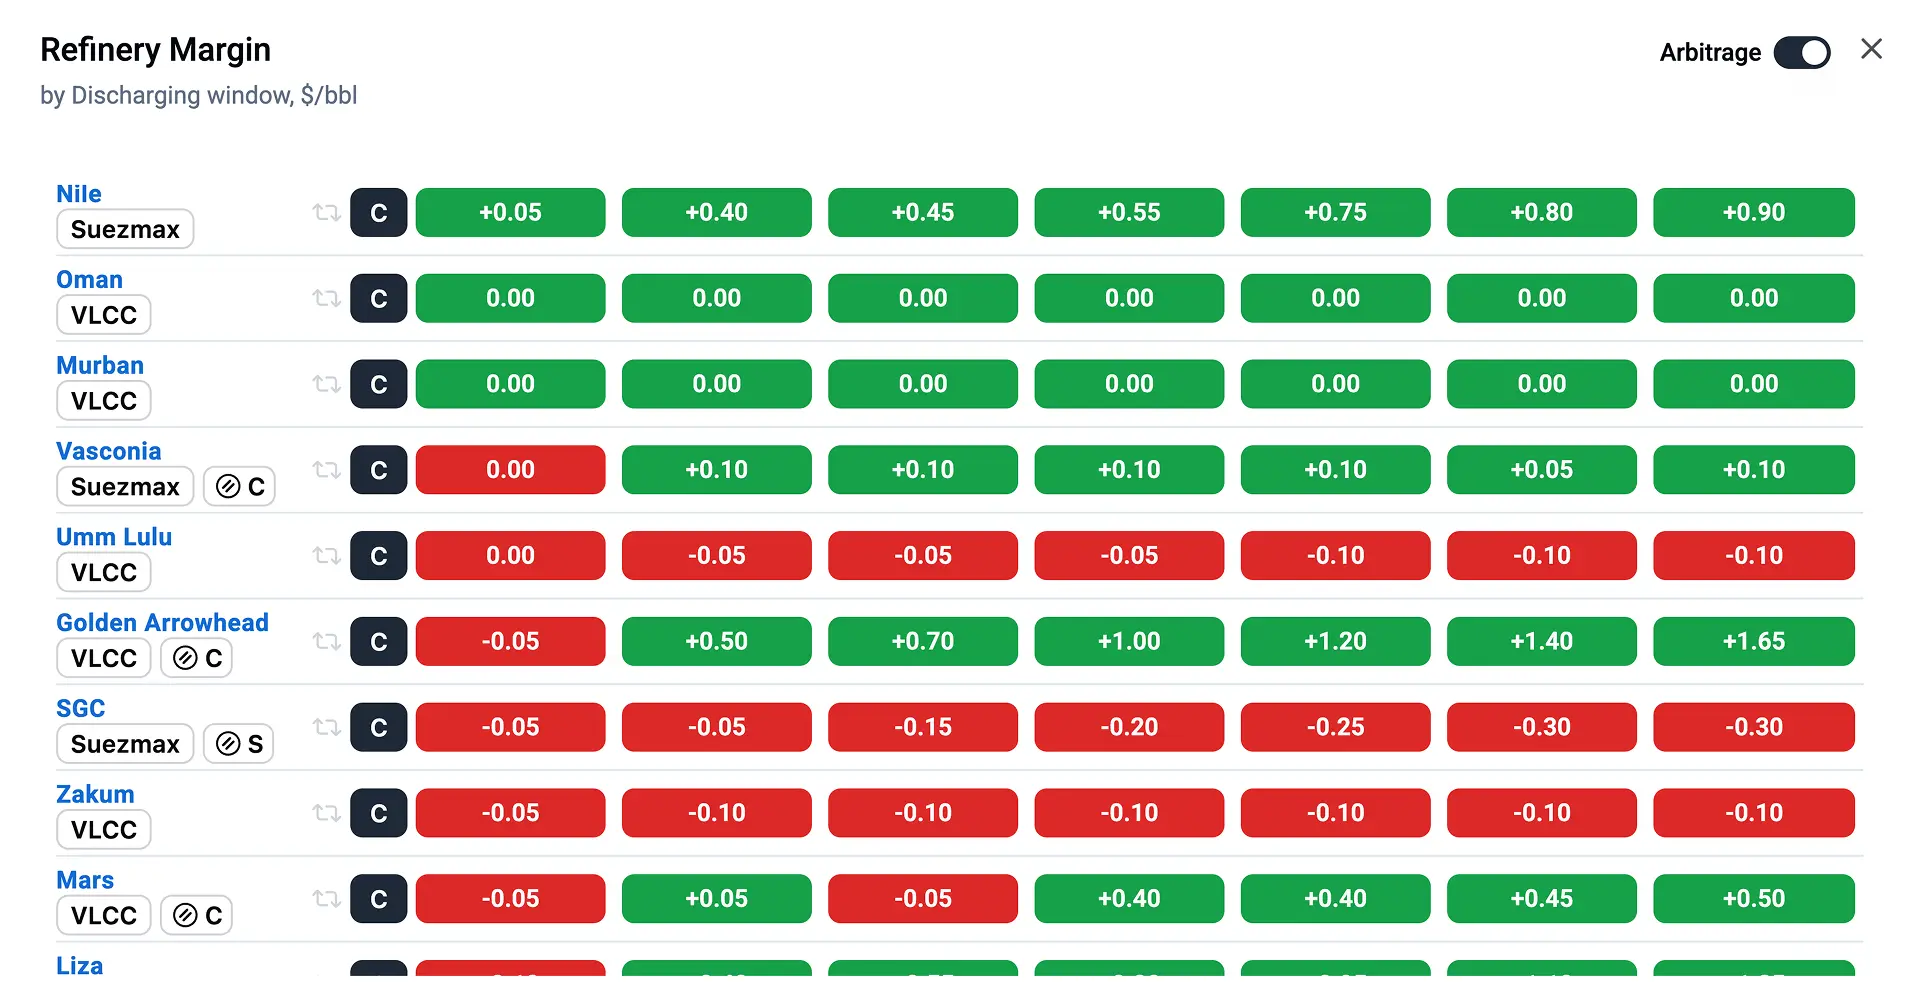
Arbitrage
Spot real-time price gaps between markets to uncover high-value trading and reallocation opportunities.
- Shows whether an imported crude delivers higher profitability than the local reference grade — the ultimate “is it worth switching?” test
- Distills complex economics into a simple red/green signal, saving hours of manual diff and margin comparisons
- Highlights incremental gains or losses versus local supply, so refiners and traders can act quickly on open arbs or avoid loss-making moves
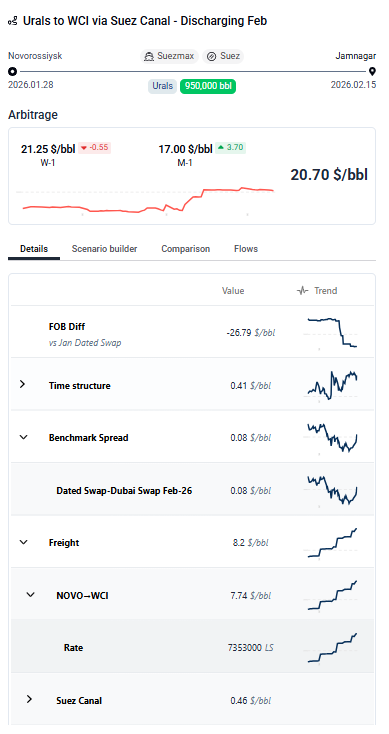
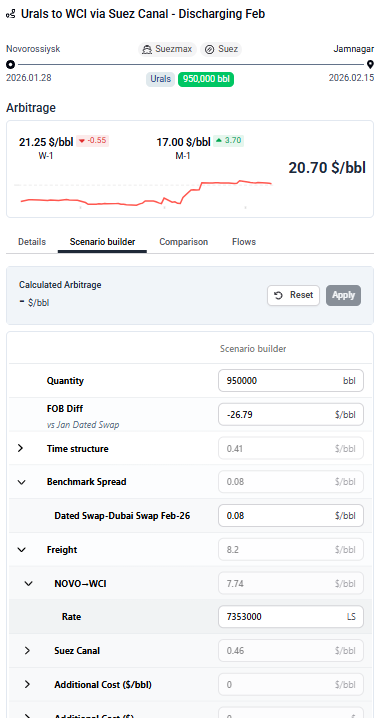
Transparent value breakdown
See exactly what drives landed value with a full breakdown of freight, quality, and pricing components.
- Displays the component and subcomponent values for:
- FOB diff
- Time structure
- Benchmark spread
- Freight
- Costs
- See clearly why a landed value, refining margin, or arbitrage value has changed by interrogating the component values
Scenario builder
The Scenario builder is an interactive tool that helps traders, analysts, and risk managers test, compare, and visualise arbitrage opportunities in dynamic market conditions.
- Custom assumptions: Adjust inputs such as freight rates, duties, and pricing basis to reflect the specific market environment you want to test
- Scenario modelling: Evaluate how a particular set of conditions impacts arbitrage economics
- Sensitivity exploration: Quickly see how changing a single assumption (e.g., freight or duty) shifts the outcome of a trade
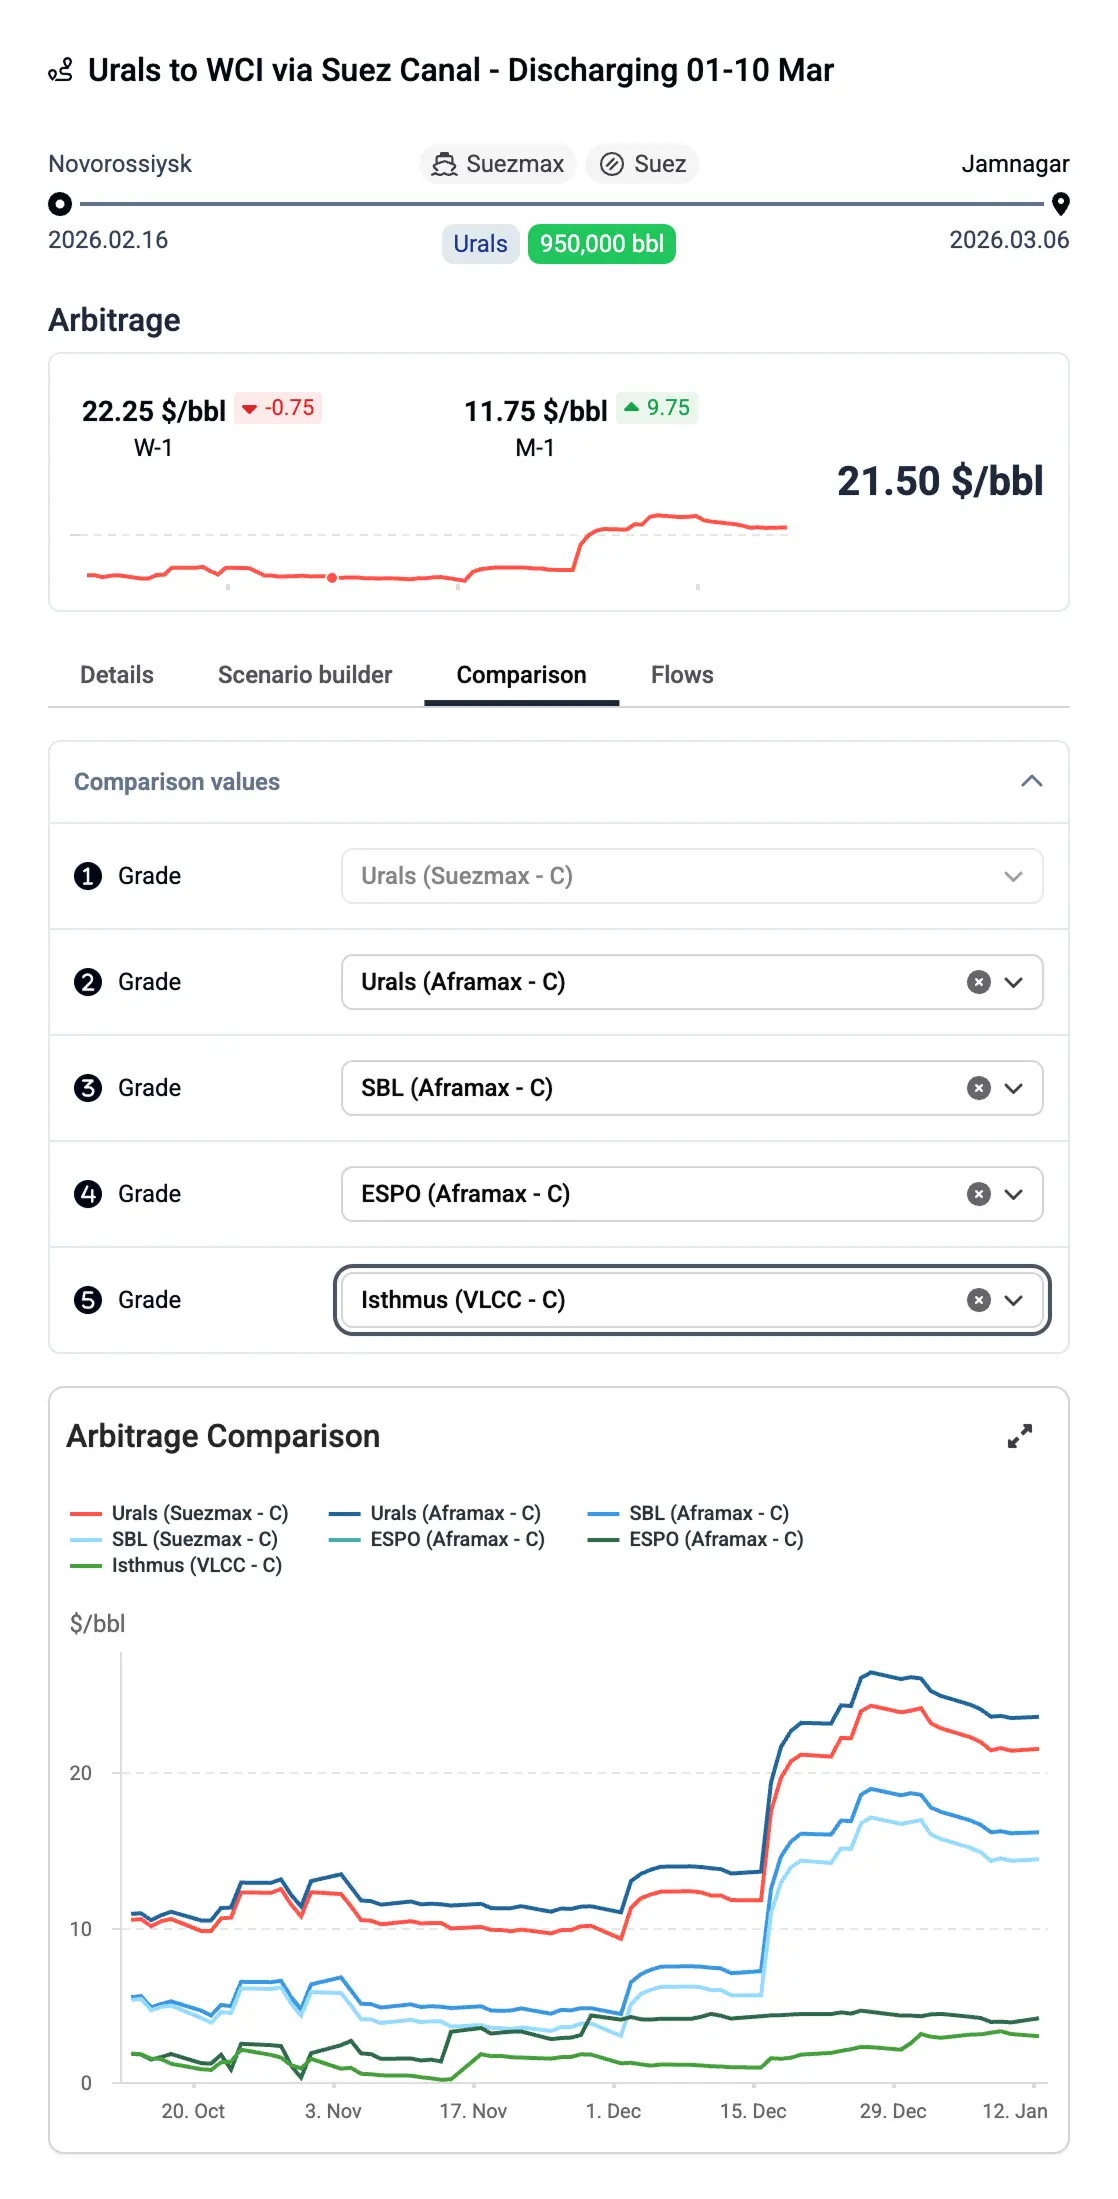
Compare grade value across trading regions
The comparison feature lets users quickly benchmark arbitrage values or refining margins for a crude grade across multiple regions, helping them see where that crude is most competitively valued.
- Compare a single crude grade across several destination markets in one view.
- Compare multiple crudes within a trading region.
- Instantly spot which regions offer the strongest economics or weakest demand signals.
- Supports faster, data-driven decisions on pricing, tender strategy, and market allocation.
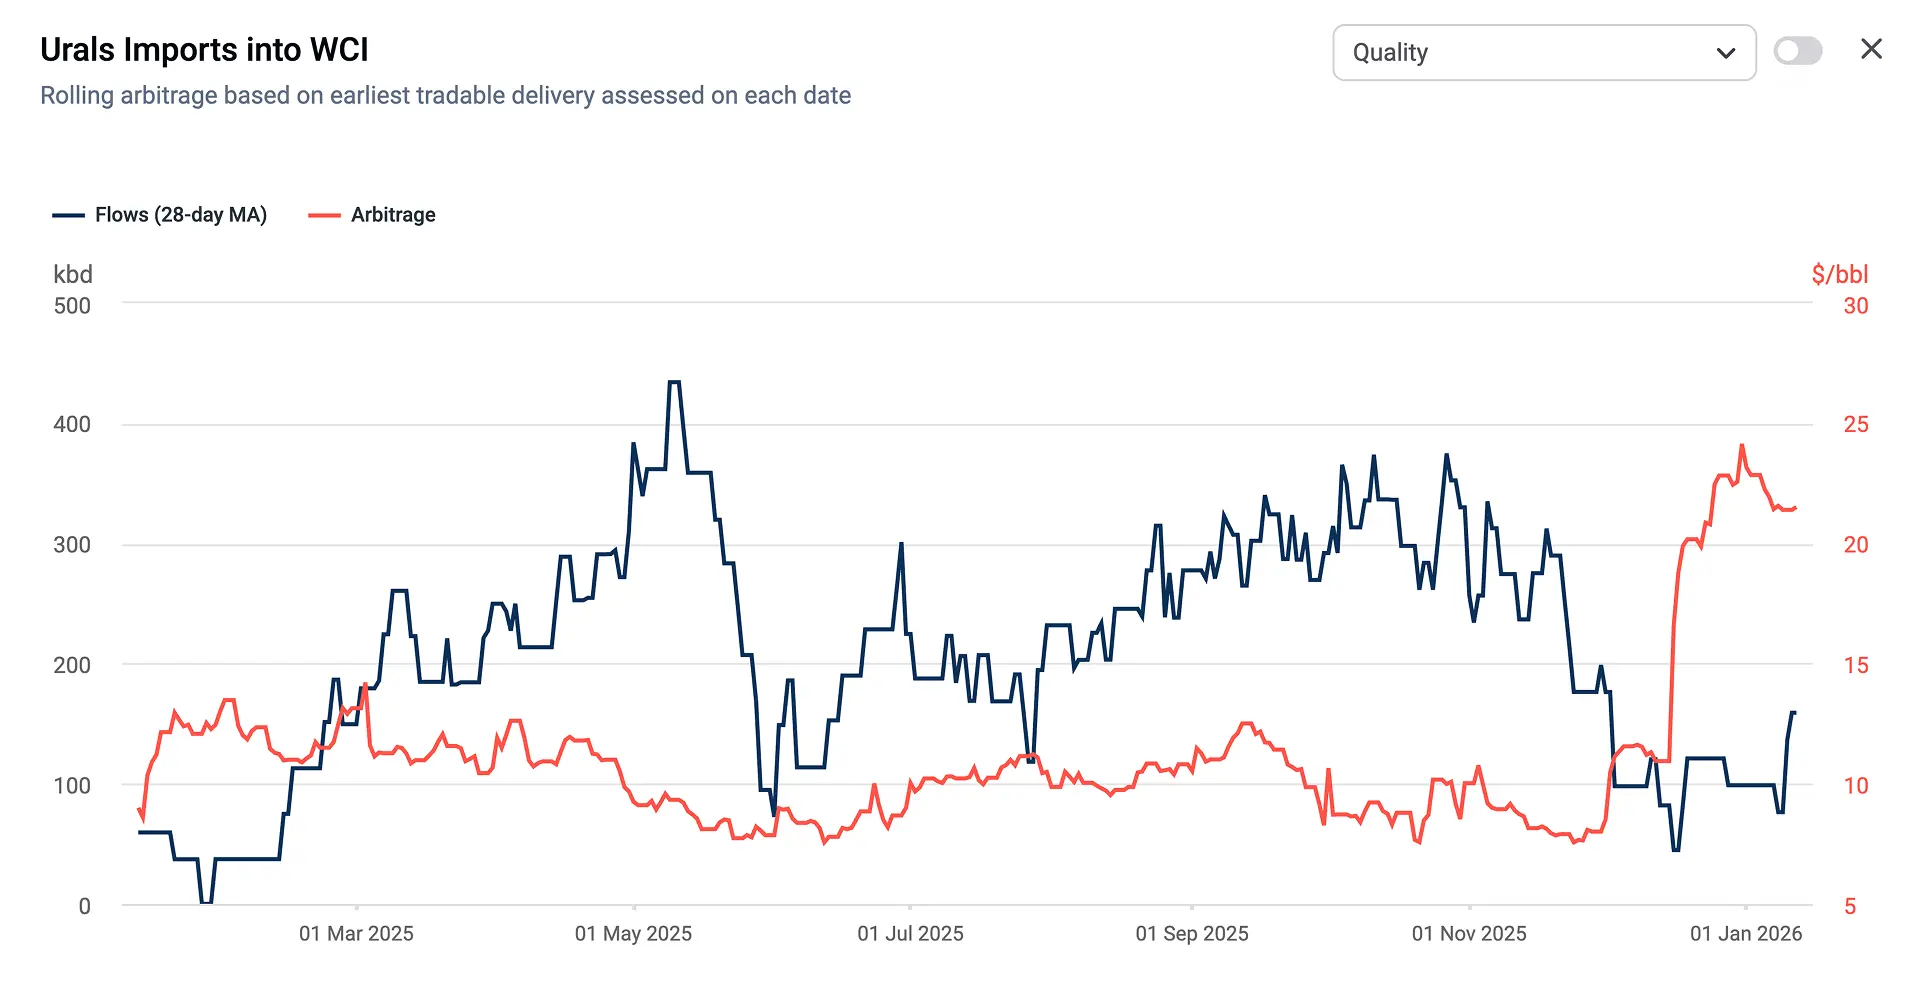
Flows vs arbitrage time series
Correlate trade flows with arbitrage signals to time market entries and validate trading strategies.
- See economics turn into action. Overlay past flows with arb values to reveal when traders actually moved on an opportunity
- Gauge momentum in hindsight. Rising flows after open arbs confirm windows that were lifted; flat flows show missed or constrained plays
- Learn the lag. Measure how long it took flows to respond, sharpening your instincts for timing the next window
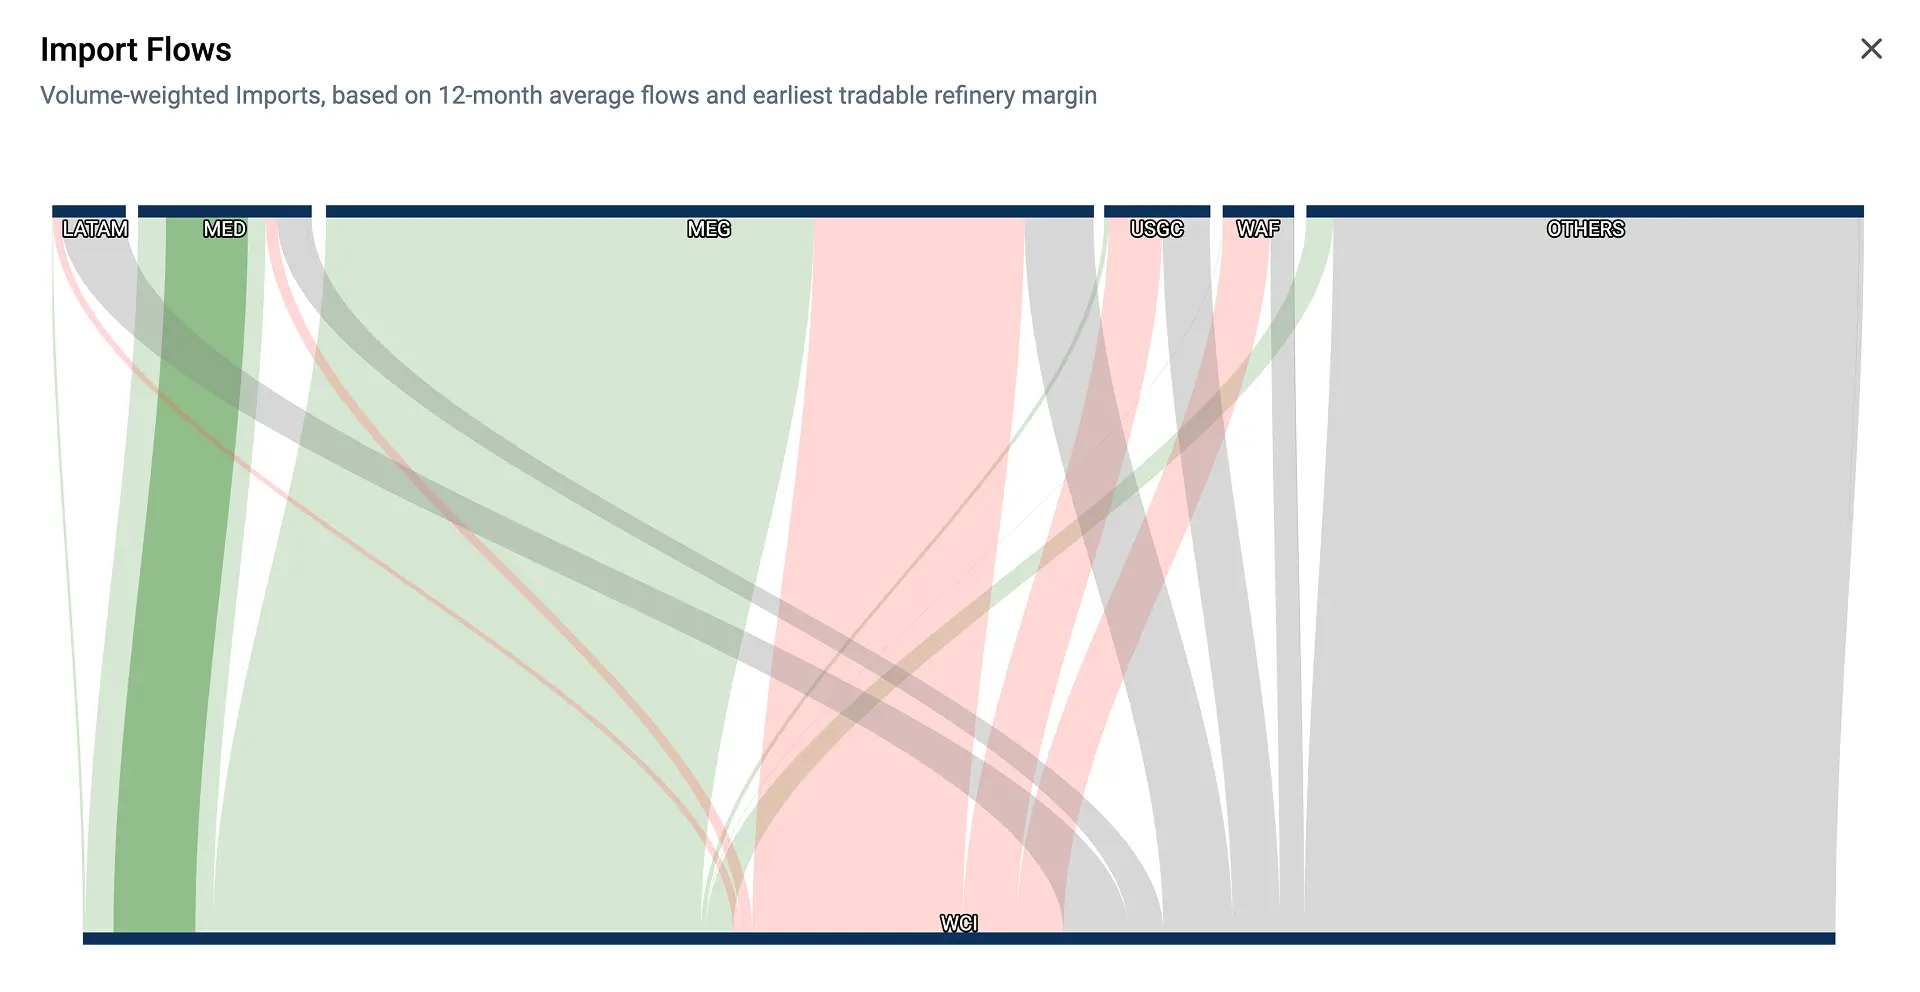
Sankey diagram
Visualise global trade flows in one view: see where crude moves and why.
- Identify active arbitrage opportunities. Green highlighted flows reveal which trades are actually being executed, not just theoretical. For example, see at a glance when USGC to Asia routes open up and are worth deeper analysis
- Distinguish theory from reality. Thin green lines indicate arbitrage that may look attractive on paper but face practical limitations - such as refinery constraints, competing trades, limited supply, or term contracts
- Spot scale and opportunity. Quickly identify high-volume, high-margin flows versus niche or constrained trades, helping you prioritise the biggest, most actionable opportunities
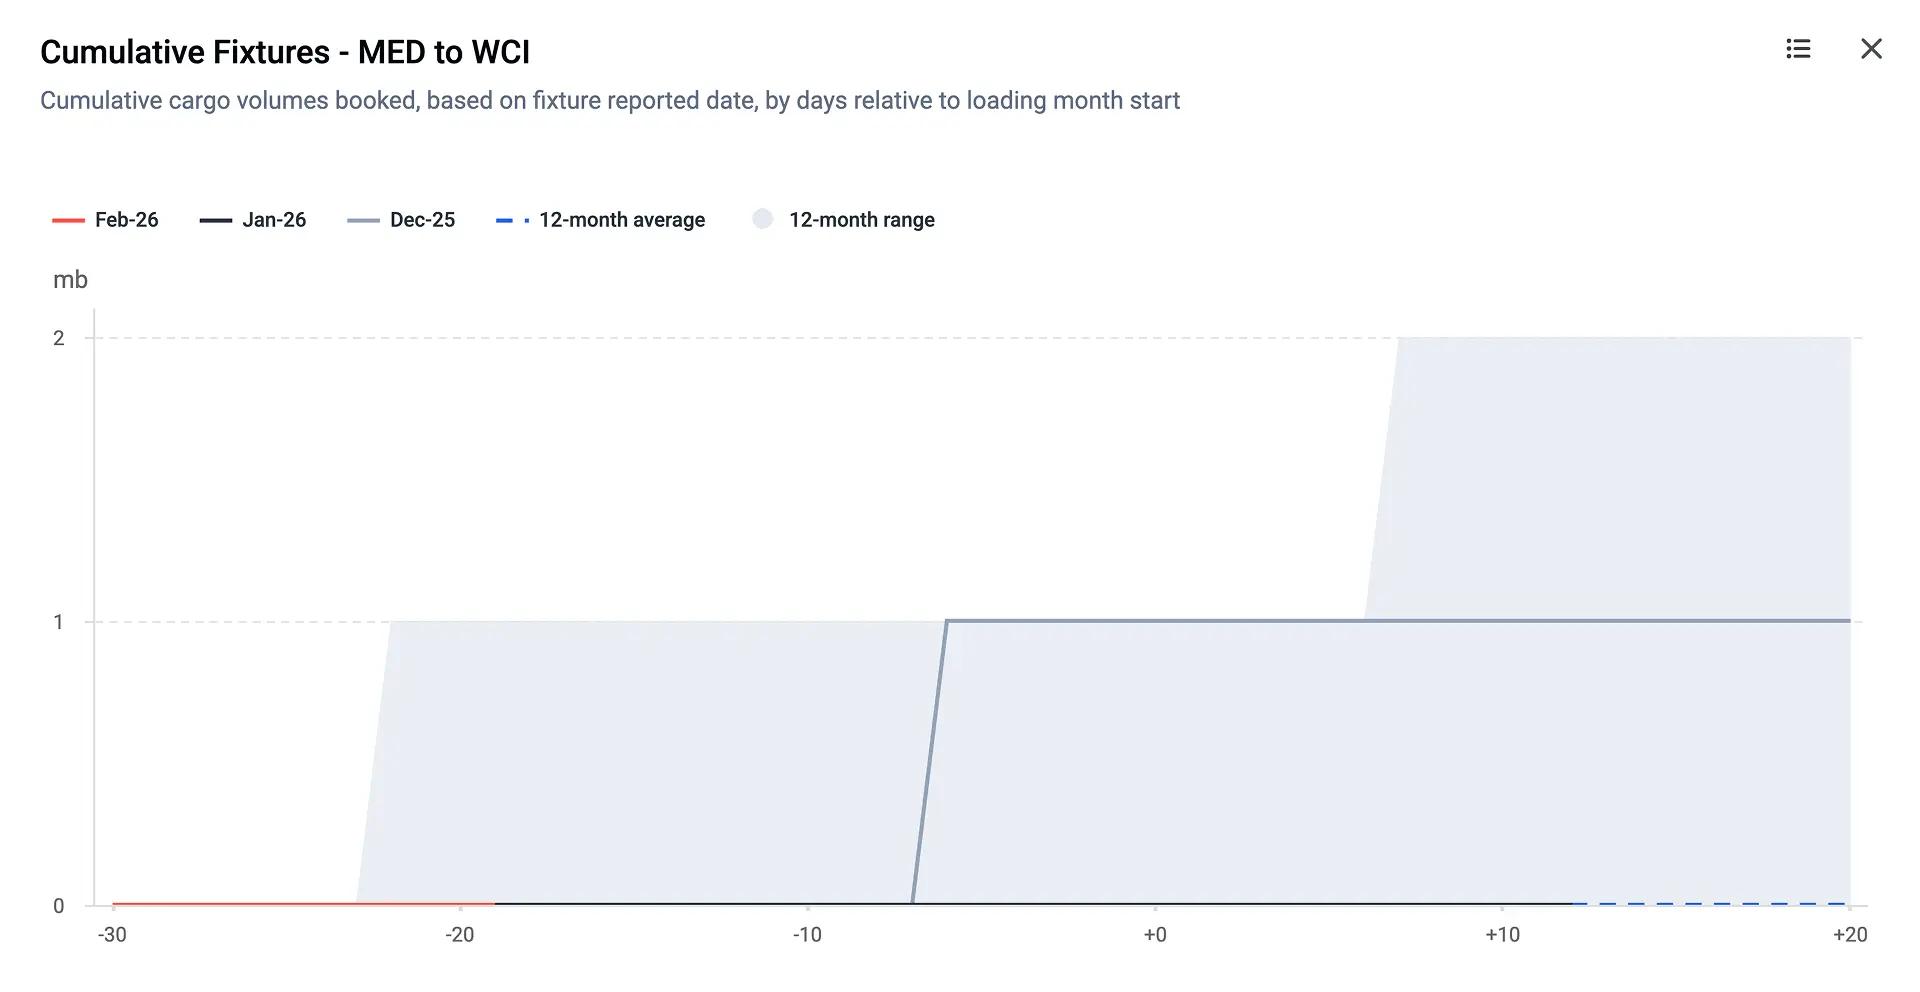
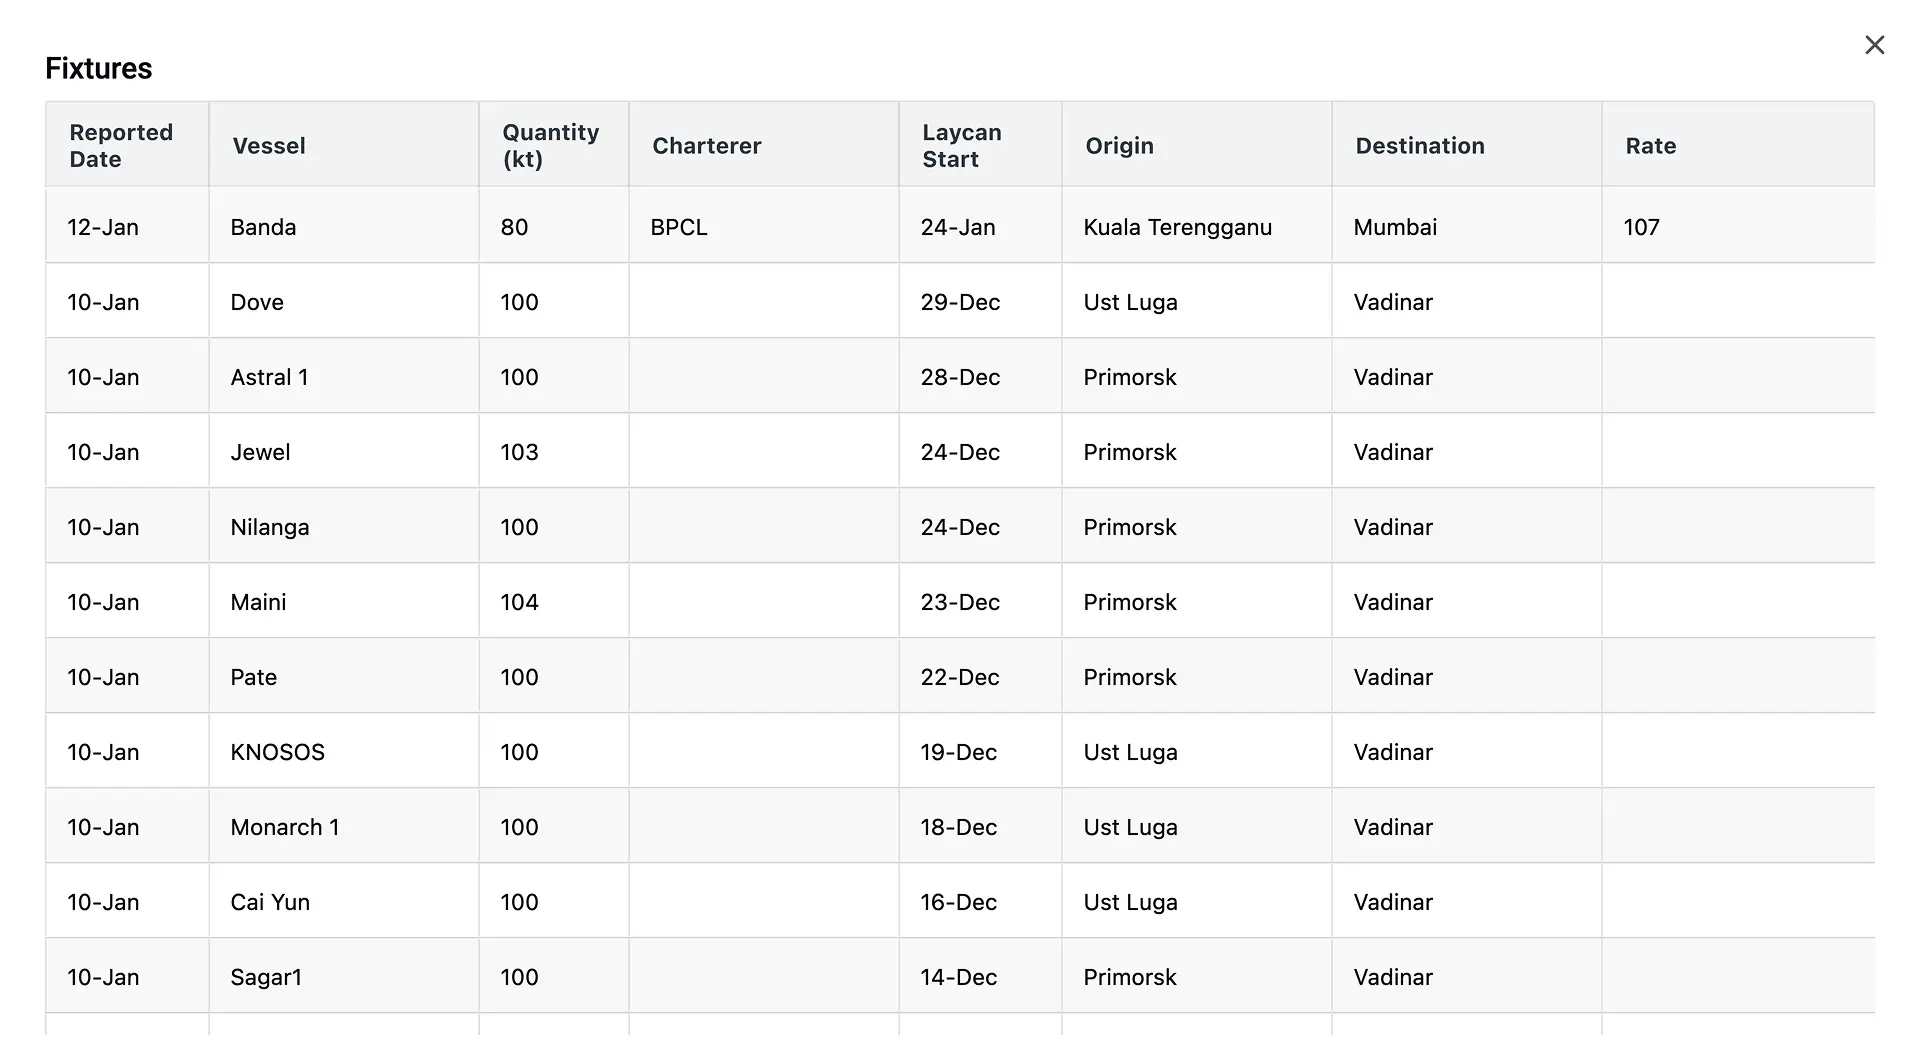
Cumulative fixtures
Track shipping activity over time to gauge market momentum and identify emerging or closing arbitrage plays.
- Track market momentum. See how quickly fixtures are accumulating for a given arbitrage versus historical booking patterns
- Spot early movers. A faster booking pace signals traders are already seizing the opportunity — slower pace may mean it’s still underexploited
- Gauge saturation risk. Compare against last month’s and one-year averages to judge whether the window is filling up or still has room to run
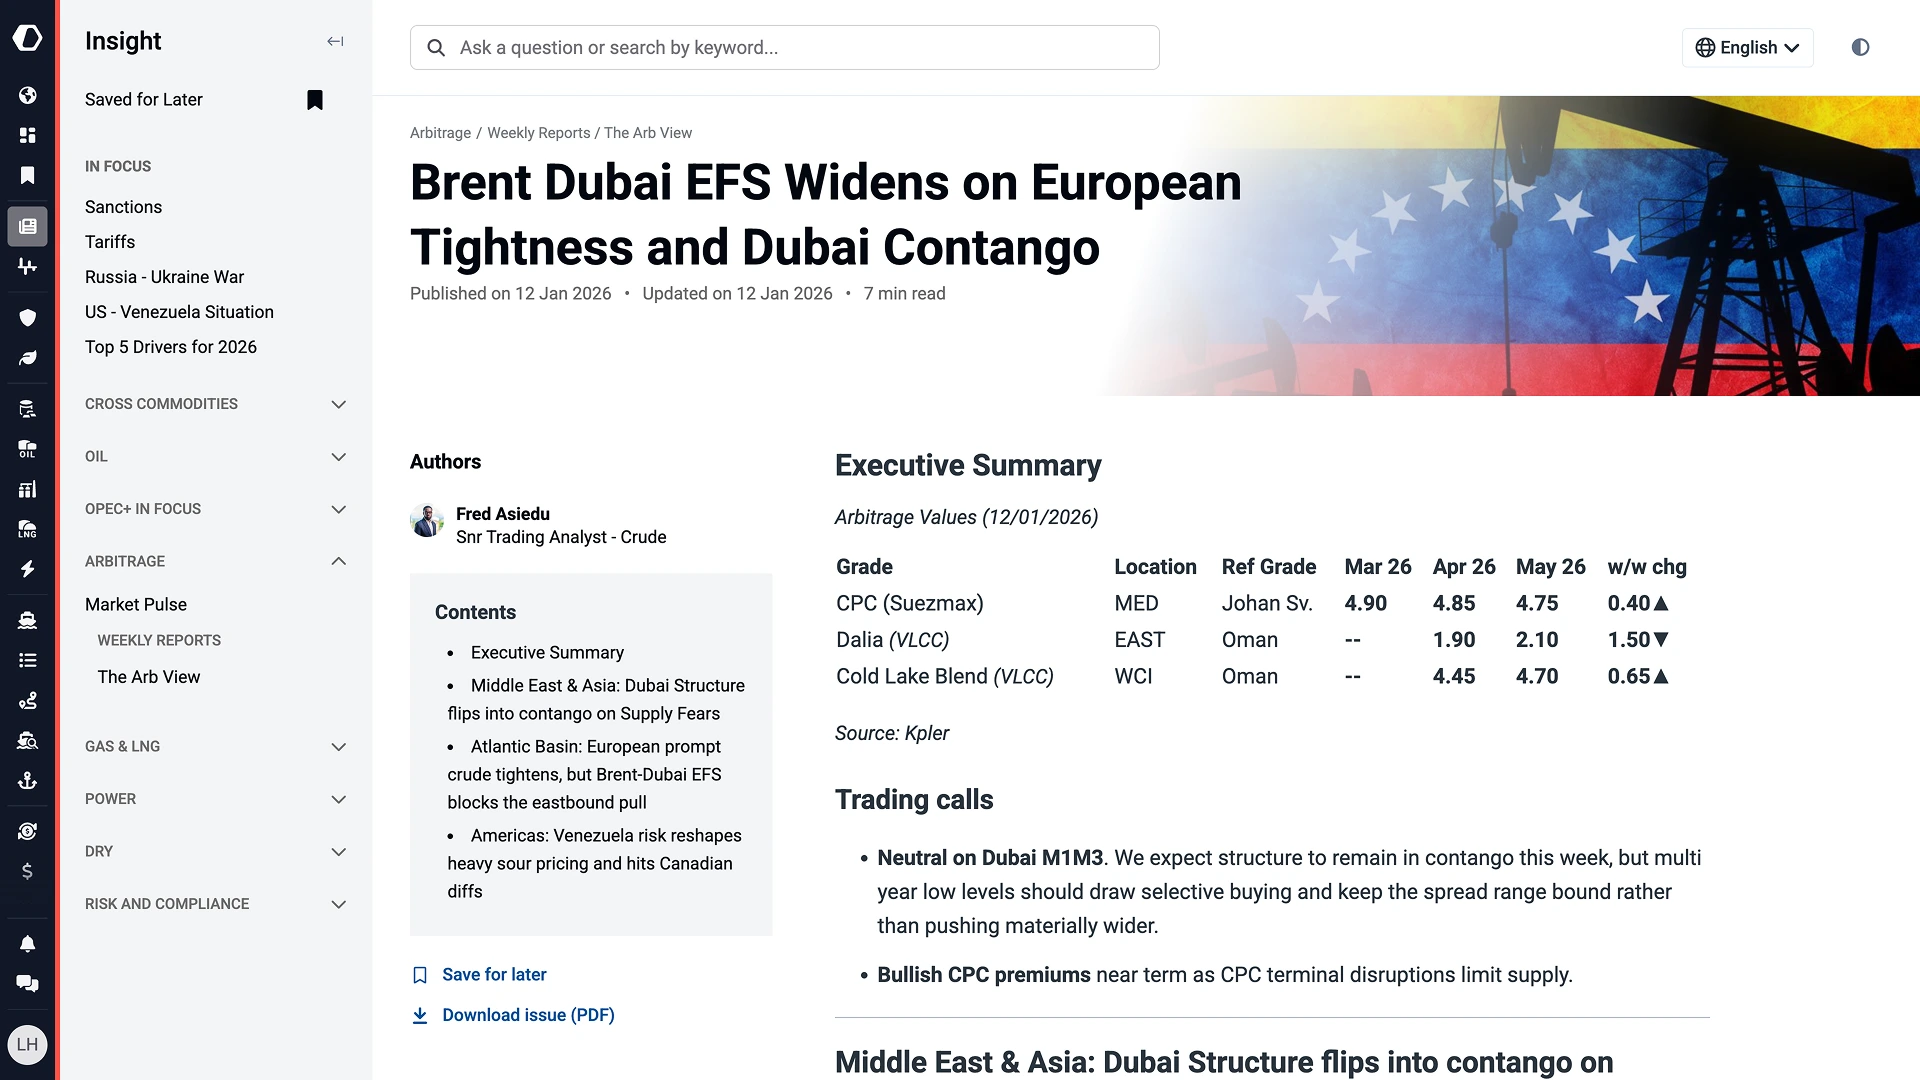
News & analysis
Get expert, data-backed insight on what’s moving markets and driving arbitrage opportunities today.
- The arb view. Weekly overview of crude arbitrage flows, highlighting global market-moving signals, emerging trends, and forward-looking insights
- Market pulse. Ad hoc commentary with analysis on current market developments and evolving arbitrage opportunities
- The daily arb. Daily report on arbitrage signals across major trading regions, covering spot and forward prices, freight rates, time spreads, benchmark arbs, and cumulative fixture counts
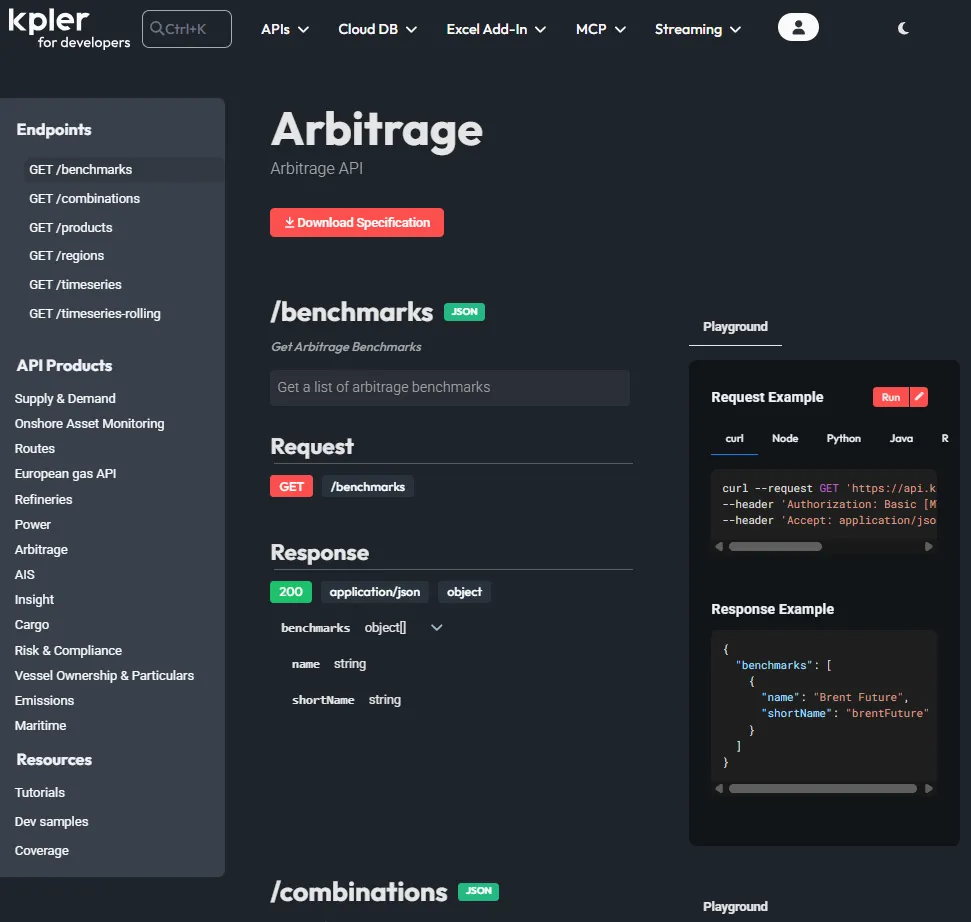
Crude Arbitrage API
- Arbitrage values and refinery margins by crude grade and destination region
- Landed value calculations incorporating price, freight, FOB differentials, port fees, demurrage, and other logistics adjustments
- Historical time series for backtesting and integration into proprietary models
- Methodology aligned with the Kpler Arbitrage Analytics workspace
Frequently asked questions
Crude Arbitrage offers calculated arbitrage values, landed values, and theoretical refinery margins for crude grades across regions, based on price benchmarks, freight, and logistics cost assumptions. It also provides supporting historical trade flow context (e.g., backward-looking flow views and Sankey visualisations) plus analyst Insights to guide interpretation. Cumulative fixtures are offered to monitor live activity before the flows happen.
Crude arbitrage decisions depend on consistent methodology and comparable economics across routes. Without specialised calculations that incorporate freight and logistics adjustments, traders can misread route competitiveness, underestimate delivered costs, or miss changes in relative value. Structured arb analytics improves speed, consistency, and confidence in opportunity screening.
Users typically start by scanning arb values and landed values to identify attractive routes, then use refinery margin comparisons to evaluate demand-side pull. They test assumptions using the Scenario Builder, validate plausibility against historical flow patterns, and use Insights to contextualise shifts. The output is used to support trade ideas, risk discussions, and route selection. The information is also commonly used to model forward import/export out of a specific region for supply & demand.
Trade flows provide the real-world grounding behind theoretical economics. Even when arb values look attractive, constraints like operational patterns, buyer behaviour, and market structure can limit execution. Flow views help users understand which routes have historically cleared, how trade has shifted, and whether “paper economics” aligns with market behaviour.
Kpler combines arb economics, landed value modelling, and refinery margin outputs in one workflow, and incorporates additional logistics cost adjustments (e.g., port fees, demurrage and other route-related costs) to give a more complete delivered-cost picture. It also pairs forward-looking economics with backward-looking flow context and published Insights, helping users move from calculation to interpretation.
- 10+ years of proprietary data versus competitors' more limited historical datasets
- Global AIS network with 13,000+ receivers across 190 countries (industry-leading coverage)
- Unique combination of satellite monitoring, customs data, and real-time market signal
The flow views and Sankey charts are historical, showing how trade has occurred over the previous periods. The arb values, landed values, and refinery margins are theoretical and forward-looking, reflecting current assumptions and inputs (prices, freight, costs). Users combine both: theory to screen opportunities, history to validate plausibility.
Key criteria include:
- Methodology transparency (Look for a provider that clearly documents)
- Which costs are included (freight, port costs, insurance, demurrage, etc.) and which are excluded
- How prices are constructed (benchmarks used, differentials, timing conventions, assessment windows)
- Assumptions and defaults (standard voyage durations, load/discharge ports, vessel class assumptions)
- How calculations change by route (e.g., STS, canal transits, specific port fees). Why? Transparency matters because small changes in assumptions can materially change economics and influence trade decisions
- Route and crude grade coverage
- The routes you actually trade, including both “core” and less-liquid/seasonal routes
- A wide list of spot-relevant crude grades, not just benchmarks
- Flexibility to handle grade substitutions and comparisons across regions
- The ability to view results by origin, destination, and trade lane. Why? Coverage gaps often lead to manual workarounds and inconsistent analysis - especially when desks trade niche grades or regional routes.
- Ability to compare arb value vs landed value vs refinery margins
- Arb value: the relative opportunity between markets (where is the best destination?)
- Landed value: the delivered cost into a destination (what does it really cost to put the barrel there?)
- Refinery margins: the demand-side pull (does the receiving region have refining incentive to take the crude?). Why? Seeing these together is critical because the “best arb” route can differ from the route that best aligns with refining economics, market constraints, or likely buying behavior.
- Key criteria include:
- Easy “what-if” testing of key variables: prices, freight rates, port fees, demurrage, delays
- Rapid comparison across multiple routes and destinations
- The ability to save and share scenarios (e.g., “high freight,” “tight crude diffs”). Why? This is essential because arb signals can flip quickly in volatile markets — scenario testing lets teams stress decisions and avoid acting on fragile economics.
- Integration of flows and market context (a robust tool should not only calculate theoretical economics but also provide the following items)
- Historical flow context (where barrels actually went and how patterns changed)
- Visual tools like route distributions and Sankey diagrams
- Context on constraints such as structural trade relationships, recurring buyer behavior, or sustained route closures This helps distinguish between:
- opportunities that are theoretically profitable, and
- opportunities that are actually tradeable.
- Clear auditability for internal discussions and risk review (strong arb analytics should be easy to defend internally by providing the following)
- A clear breakdown of every input (prices, freight, costs) and the resulting economics
- The ability to export results for reporting and risk committees
- Consistent methodology across time (so teams can track what changed and why)
- Version control / time-stamping of assumptions where possible Auditability is especially important when arb models are used to support supply decisions, hedging strategy, or risk sign-off.
Discover the leading solution for global commodity tracking
A solution for every market
With thousands of users across the globe, Kpler enables customers to find signal in the noise and position themselves for success.


