Asian LNG eases on South Korean stockbuild and softer Chinese industrial demand
Market & trading calls
European TTF front-month price outlook: Stable as increased LNG imports and limited Asian competition are expected to weigh on prices, while reduced Norwegian pipeline flows from ongoing maintenance and potential upside in gas-fired generation provide support. Downside risks stem from further Arctic LNG 2 deliveries into China.
Asian LNG front-month price outlook: Slightly bearish with prices likely to extend losses as end-August inventories remain high in South Korea and China. Pacific supply is steady, while weak Chinese industrial activity and soft LNG truck sales continue to weigh on demand.
Asian LNG – TTF spread outlook: Slightly narrower as stable TTF contrasts with further downside risk in Asian LNG. The spread held virtually unchanged from last week at $0.26/MMBtu on 3 September.
US Henry Hub front-month price outlook: Steady as bullish momentum from short-term reductions in production is offset by weak power demand and expectations of consecutive bearish storage builds.
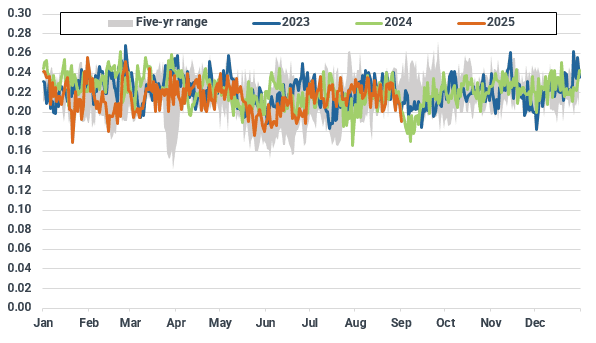
Key natural gas and LNG front-month prices ($/MMBtu)
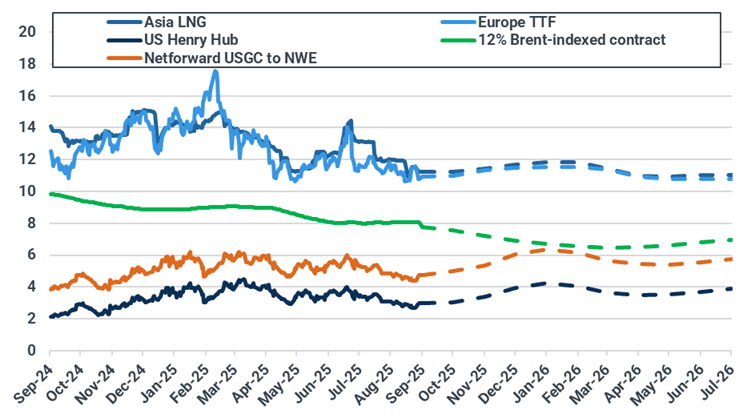
Source: ICE, NYMEX, Spark Commodities. Brent-indexed price represents 12% slope of 90-day moving average of Brent contract. Netforward USGC to NWE calculation is 115% Henry Hub contract plus shipping and regasification costs into Gate (Spark Commodities).
Asian LNG-TTF front-month spread ($/MMBtu)

Source: ICE, Kpler Insight
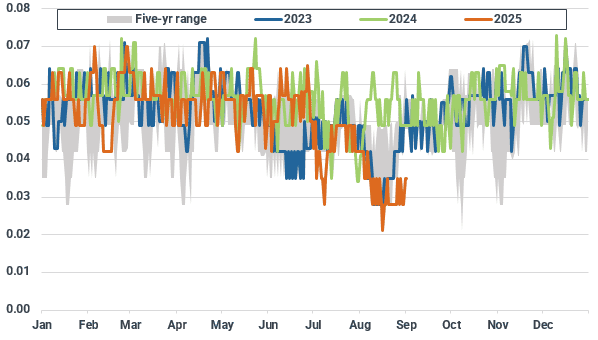
Atlantic basin LNG front-month arbs ($/MMBtu)

Source: Spark Commodities, incorporating ICE-listed Spark Freight and Spark Cargo products. For a full M+12 forward curve and netback cost breakdown, contact Spark at info@sparkcommodities.com.
Europe: TTF stable as higher LNG imports and bearish Arctic LNG 2 sentiment offset Norwegian maintenance support
European TTF front-month prices saw a moderate w/w decline of $0.09/MMBtu to $10.97/MMBtu on 3 September pressured by news that China’s Beihai terminal received a cargo from the sanctioned Arctic LNG 2 project, raising concerns over the effects of additional Russian LNG supply in the market. After extending losses in the latter part of last week, TTF recovered some ground and traded sideways for most of this week amid continuing heavy maintenance works in Norwegian facilities.
For the week ahead, Kpler Insight maintains a stable outlook for the TTF front-month contract. Increased LNG imports and limited competition with Asia are expected to weigh on prices, while reduced Norwegian pipeline flows amid maintenance and potential upside in gas-fired generation from nuclear outages should provide support. Upside risks stem from prolonged or unplanned Norwegian outages, while further Arctic LNG 2 deliveries into China would strengthen bearish sentiment.
From the supply side, EU pipeline imports fell by 7% w/w to 3.03 bcm driven by heavy maintenance in Norway (- 0.2 bcm w/w). UK exports to the continent also slipped on lower entries at Easington. Looking ahead, Norwegian flows via Zeebrugge will be halted over 2-20 September due to planned maintenance, curtailing 42.1 mcm/d of capacity. However, rerouted volumes through Dornum and Emden are expected to partly offset the loss.
Algerian pipeline imports to Spain remained strong, likely supported by reduced LNG availability amid maintenance at Spanish regasification terminals late August. TurkStream volumes to Bulgaria also stayed above the five-year range through most of last week, adding supply into Eastern Europe.
Looking ahead, EU-27 net pipeline imports are expected to decline further as Norwegian maintenance deepens, despite stable inflows from other sources.
UK’s daily net pipeline flows to the EU (bcm)
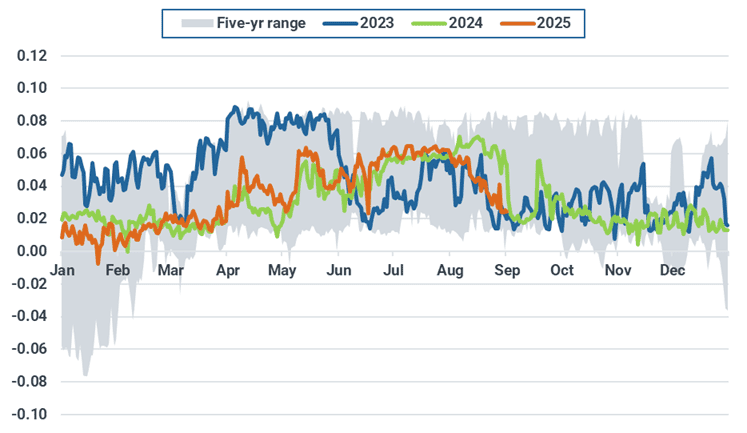
Source: ENTSOG, Kpler Insight
European LNG imports rose by 15% w/w to 1.9 mt, driven by an increase in imports in NWE, the CEE/Baltics region and Iberia. Looking ahead we expect LNG volumes to increase to cover for reduced pipeline supply, particularly in NWE where imports into Belgium are recovering and German imports remain strong. Italy’s Rovigo extended its maintenance period and is expected to be fully operational by mid-September.
EU-27 weekly LNG imports by region (mt)
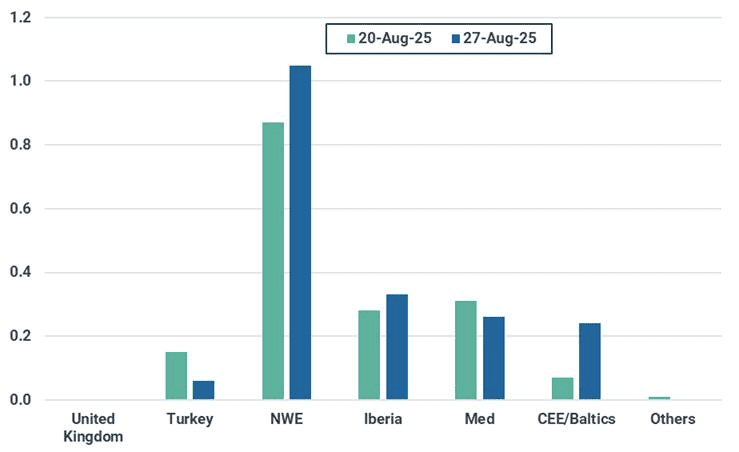
Source: Kpler Insight. Data represents week commencing 20/08 and 27/08. NWE=FR, BEL, NL, GER. Iberia=ESP, POR. Med=ITA, HVR, GRE. Baltics/CEE=FI, LT, POL. Others=SWE, MT.
On the demand side, EU-24 gas-fired generation increased by 3% w/w to an estimated 6.1 TWh, supported by higher overall power demand as the summer holiday period winds down. Gains in gas, wind, and coal offset sharp declines in nuclear (-6% w/w) and hydro output (-14% w/w). Looking ahead, despite forecasts pointing to strong wind generation in the coming days, potential nuclear outages in France due to strike action could provide further upside for gas-fired generation.
EU-24 weekly gas-fired generation (TWh)

Source: Kpler Power, Kpler Insight.
Average forecast temperatures for selected European countries (°C)
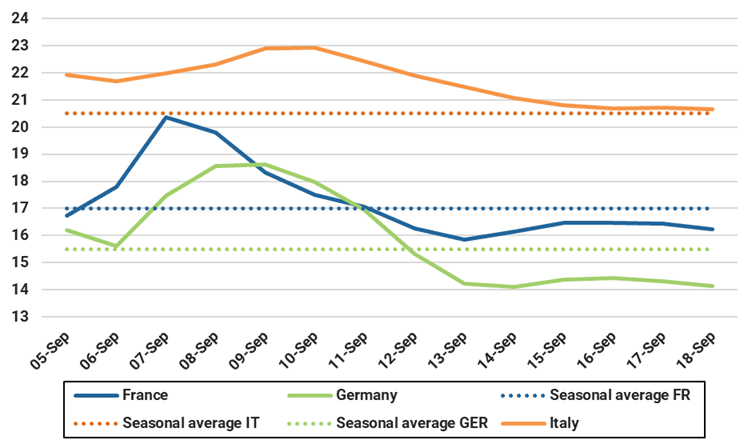
Source: Kpler Power. As of 04/09 00:00 UTC.
EU-27 underground gas stocks stood at 78.3% on 1 September, 6.7 percentage points below the five-year average. Net injections edged up to 2.1 bcm from 2.0 bcm the previous week, as higher LNG imports offset reduced pipeline inflows and slightly stronger gas-for-power demand. Looking ahead, the injection outlook is mixed: Norwegian maintenance will curb pipeline supply, though robust LNG arrivals could help offset the shortfall, particularly in lagging countries needing to maintain pace to meet storage targets. Meanwhile, the seasonal spread widened last week, with the October 2025 contract trading at a ~€1.22/MWh discount to December 2025, compared with €1.1/MWh the week before, improving the incentive to inject. In Germany, booked storage capacity stood at 75% of total, while SEFE’s Rehden site remains at 32% after successive auctions failed to allocate additional volumes.
EU-27 underground natural gas inventories by country (bcm, left), fill as of 1 September (%, right)
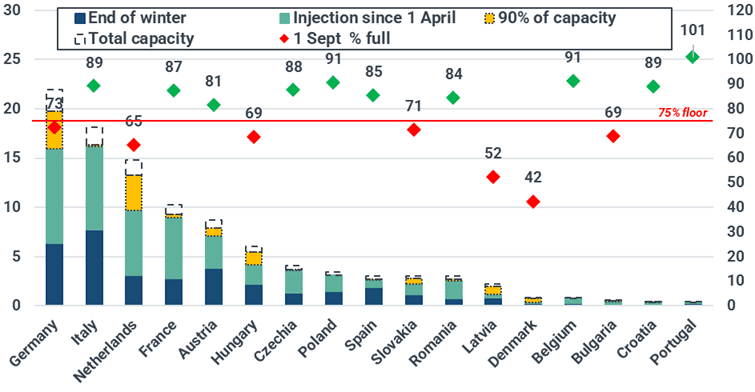
Source: GIE, Kpler Insight. Latest data as of 2/09/25.
Asia: LNG prices under further pressure as South Korean inventories climb on higher August imports and China industrial demand softens
Asian LNG prices slipped $0.08/MMBtu w/w to $11.23/MMBtu on 3 September, weighed down by softer European TTF and muted regional demand in Asia.
Asian LNG prices look set to extend losses next week, with elevated end-August inventories in South Korea and China weighing on sentiment. Pacific supply remains steady, while weak Chinese industrial activity and sluggish LNG truck sales continue to drag on downstream demand.
Gas-for-power demand in Northeast Asia is set to remain elevated next week with temperatures above 5-year norms, easing slightly w/w. Ongoing monsoons continue to cap temperatures and limit cooling demand in South and Southeast Asia.
Forecasted average temperatures for Asian countries (°C)
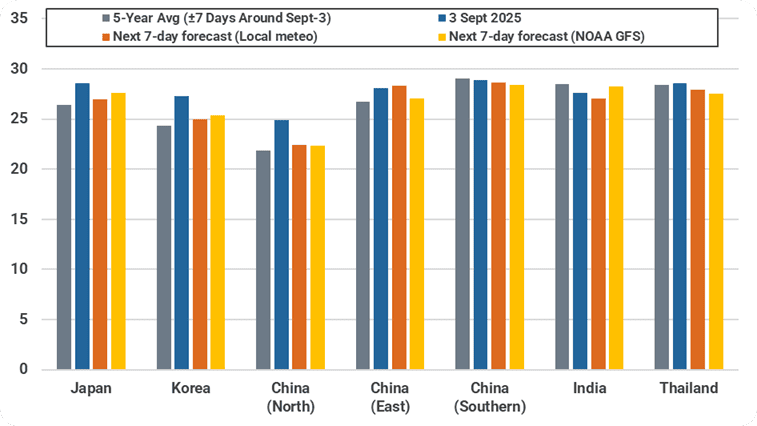
Source: Meteostat, Kpler Insight. As of 4 September 2025 00:00 UTC. Population-weighted average temperature of selected major cities across a country is shown for both historical and forecast.
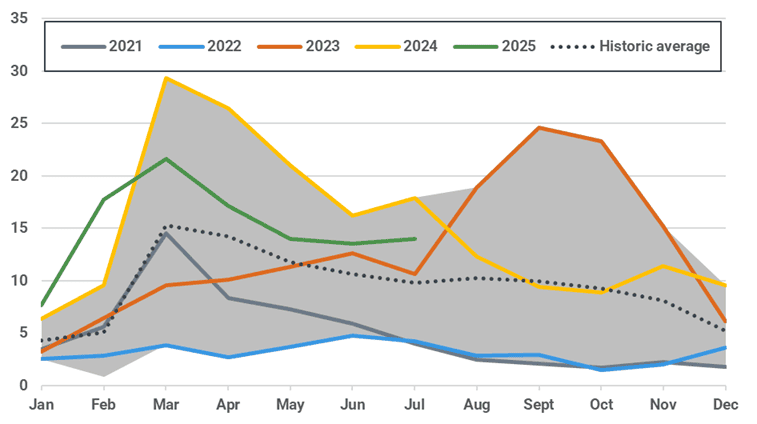
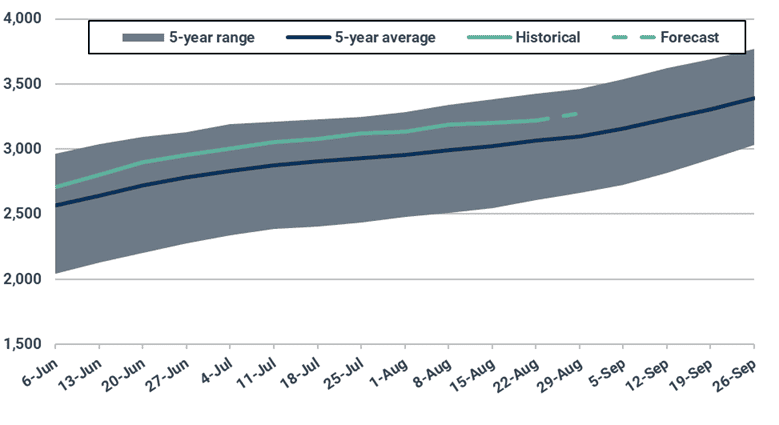
Japan’s major utility LNG stocks dipped 0.17 mt w/w to 2.01 mt by 31 August, now slightly below the 5-year average amid ongoing heat. Power sector inventories are expected to rise seasonally to 2.7 mt in October and 2.8 mt in November, limiting spot demand. A potential early-September heatwave may trigger short-lived drawdowns and brief price support, but broader fundamentals remain bearish.
Japan implied LNG inventory for power utilities forecast (mt)

Source: METI, Kpler Insight. Note: Implied total LNG inventory includes both power and non-power inventories.
South Korea’s LNG demand outlook has been revised higher on strong August imports and extended nuclear outages, but inventories remain 5 mt above the 5-year maximum even after a warm summer, capping near-term spot buying and keeping Asian LNG prices under pressure.
South Korea implied LNG inventory forecast (mt)
Source: KESIS, Kpler Insight
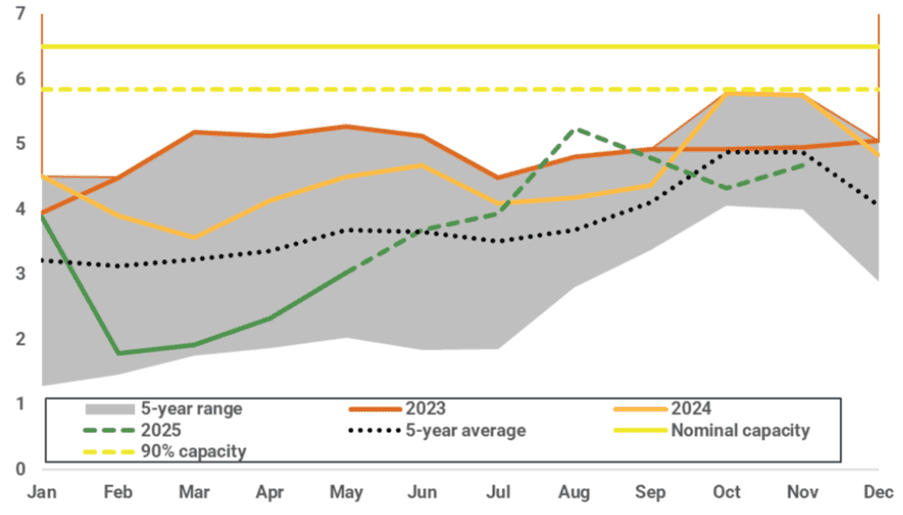
China’s 2025 LNG demand was revised down to 71 mt (-0.3 mt) as industrial gas use and LNG truck sales remain weak. Elevated implied inventories—at 7.0 mt by end-August (70% full) and projected to rise—are sharply limiting restocking needs. Combined, these factors reinforce bearish pressure on Asian spot LNG prices through Q4 2025. News of potentially expanding Russian pipeline supply to China via Power of Siberia 1 and 2 adds bearish sentiment to the Asian LNG outlook, though with no impact on prompt fundamentals.
Net Change in Industrial Activity Index Between 29 July and 29 August 2025
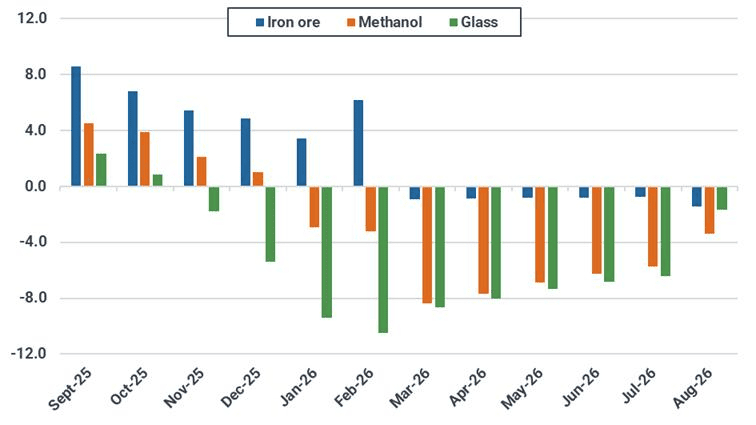
Source: Kpler Insight. Note: Each sectoral industrial index is normalized to 100 as of 1 January 2024. Index values reflect relative activity trends, but the impact on gas demand varies by sector and is not directly proportional to index magnitude.
China monthly LNG truck sales (thousand trucks)
Source: CVWorld
China implied LNG inventory forecast (%)

Source: Kpler Insight
In India, LNG demand remains steady at 1.8 mt for September, as the IMD projects near-normal temperatures and above-average rainfall, capping gas-for-power consumption this month.
India monthly LNG demand forecast by sector (mt)

Source: PPAC, Kpler Insight
Population-weighted dry-bulb CDDs in India (degree-days)

Source: Meteostat, Kpler Insight. Note: 1) Population-weighted CDD of selected major cities across India is shown for both historical and forecast. 2) Dry-bulb CDD is based off the actual air temperature measured by a thermometer
US: Henry Hub struggles to find footing as short term production losses contend with weak demand
US Henry Hub front-month prices settled at $3.07/MMBtu on 3 September, up from $2.87/MMBtu on 27 August. Prices rallied late last week on the back of a second consecutive bullish storage report, ending Friday at $2.997/MMBtu. On Tuesday, prices fell in early trading on cooler weather forecasts, before edging slightly above $3.00/MMBtu amid widespread profit taking activities. On Wednesday, lower production expectations due to weak physical prices and pipeline maintenance provided some bullish momentum to the front month contract.
US domestic gas consumption by sector (bcf/d)
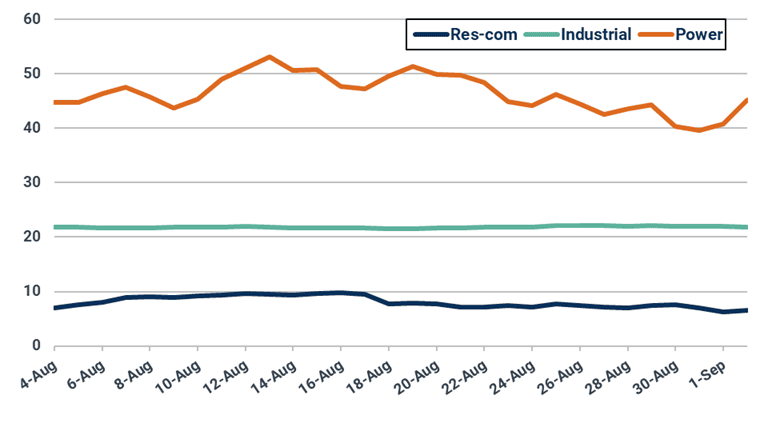
Source: EIA
Weather forecasts remained relatively steady w/w, with the eastern US, Midwest, and California all expected to experience below-average temperatures for the next two weeks. Though hotter conditions are projected for southern Texas, Florida, and parts of the Rockies, broadly cooler weather across the Lower 48 is expected to lower power demand. With reduced demand likely to outpace short-term losses in production, Kpler Insight expects Henry Hub to remain near the $3.00/MMBtu mark for the coming week.
Forecast of cooling degree days

Source: National Weather Service
US dry gas production averaged 107 Bcf/d last week, though pipeline maintenance on the El Paso system and weak physical gas prices saw output drop close to 104 Bcf/d on Wednesday. Production is likely to pick-up over the next few days, as work on El Paso is set to wrap up by the end of the week and physical prices have staged a strong recovery. Kpler Insight expects production to average 106 Bcf/d over the next 7 days.
The US injected 18 Bcf into underground storage for the week ending 22 August, coming in well below consensus. Though weather was relatively cool throughout the report period, reduced renewables output and coal-to-gas switching pushed up natural gas demand in the power sector, limiting injections. Additionally, South Central (which includes Texas) saw a second consecutive net withdrawal, with lower wind generation and locally hot temperatures increasing demand. For the week ending 29 August, Kpler Insight expects the US to inject 68 Bcf of natural gas into underground storage.
US underground gas stocks (bcf)
Source: EIA, Kpler Insight
LNG Supply: Global exports ease on Nigerian and Pacific weakness; Russia delivers first Arctic LNG 2 cargo
Global LNG exports dipped by 0.62 mt w/w to 8.00 mt last week, down from 8.62 mt the week prior. The decline was largely driven by lower output from Australia (-0.36 mt w/w), Malaysia (-0.22 mt w/w), Nigeria (-0.25 mt w/w), and Algeria (-0.21 mt w/w), partially offset by gains in the US (+0.18 mt w/w) and Indonesia (+0.29 mt w/w). Despite the drop, global LNG supply remains well above the 5-year seasonal range.
Global LNG exports (mt, 10-day moving average)

Source: Kpler
In the Atlantic Basin, Nigerian LNG exports plunged from 0.29 mt to just 0.01 mt w/w, marking the lowest weekly total since July 2013. No full cargoes were exported last week. The LNG Bonny Li, which entered berth on 26 August, initially loaded only minimal volumes based on vessel draft data, and eventually completed loading and departed around 2 September. Meanwhile, the LNG Abuja Li has delayed its return to Bonny by nearly a month, now scheduled to arrive around 13 October, further constraining export capacity.
Multiple LNG carriers have been observed idling offshore or sailing slowly, suggesting a possible operational issue at the terminal. While Nigeria typically undergoes maintenance in late August, the scale of this disruption suggests a more significant underlying issue, potentially linked to pipeline vandalism, which has affected Bonny’s operations in the past. The prolonged curtailment is tightening Atlantic Basin supply and could be adding upward pressure to European TTF prices.
Nigeria’s LNG exports (mt, 10-day moving average)
Source: Kpler
Algerian exports also slumped w/w, down from 0.24 mt to 0.03 mt, driven primarily by a complete halt in loadings at Bethioua. Three LNG carriers, Ougarta, Energy Spirit, and Berge Arzew, were observed idling offshore with AIS calls for Bethioua, but none were able to dock, hinting at terminal-side disruptions. Skikda also underperformed, loading just one cargo versus the usual two.
In the US, LNG exports increased w/w from 2.04 mt to 2.22 mt, amid steady feedgas flows averaging around 15.3 bcf/d. No major pipeline or terminal disruptions were observed. Separately, Commonwealth LNG received final non-FTA export approval from the US Department of Energy for its proposed 9.5 mtpa Louisiana facility, keeping the project on track for FID in Q3.
In the Pacific Basin, Australian LNG exports dropped from 1.61 mt to 1.25 mt w/w (-22%) due to scheduled maintenance at several terminals. The largest declines were observed at Gorgon, where exports fell by 0.14 mt w/w (from 0.36 mt to 0.22 mt), followed by APLNG (-0.09 mt), Ichthys (-0.07 mt), Wheatstone (-0.06 mt), and Pluto (-0.06 mt). At Ichthys, both trains remain offline for planned maintenance, while no unexpected outages or loading delays were observed across other facilities, indicating the reductions are expected to be temporary.
Australia’s LNG exports (mt, 10-day moving average)
Source: Kpler
Malaysia’s LNG exports also declined, falling from 0.71 mt to 0.49 mt w/w (-0.22 mt), driven entirely by reduced output from the 29.3 mtpa Bintulu complex. While the drop is notable, output remains broadly within seasonal norms, and no structural issues have been identified.
Malaysia’s LNG exports (mt, 10-day moving average)

Source: Kpler
By contrast, Indonesia’s LNG exports jumped from 0.13 mt to 0.42 mt w/w, led by strong performance at Bontang and Donggi-Senoro (DSLNG). The sharp rebound helped sustain Pacific Basin supply, offsetting some of the reductions from Australia and Malaysia.
In Russia, Sakhalin-2 fully recovered from maintenance, while Yamal continues a slower-than-usual ramp-up, with 10-day moving averages still trending below seasonal norms. Meanwhile, the first delivery from the sanctioned Arctic LNG 2 project was completed on 28 August, as the Arctic Mulan discharged 77,400 m³ at China’s 6 mtpa Beihai terminal, following nearly three months idled offshore. Five additional dark fleet vessels carrying Arctic LNG 2 volumes are en route to Asia. The most recent loading from the sanctioned terminal, by the La Perouse on 30 August, appears to be taking the longer route via the Cape of Good Hope, signaling that Northern Sea Route ice conditions may already be deteriorating as summer ends.
Yamal LNG exports (mt, 10-day moving average)
Source: Kpler
Market insights you can trust
Kpler delivers unbiased, expert-driven intelligence that helps you stay ahead of supply, demand, and market shifts.
Trade smarter. Request access to Kpler today.

See why the most successful traders and shipping experts use Kpler
.jpeg)
Research & analysis driven by proprietary data