EXPLAINER: How Mideast Gulf crude exports returned to pre-war levels
Excluding Iran, crude exports from the Middle East Gulf region are back at pre-war levels. But 40% now bypass Hormuz, and most crude crossing the strait changes tankers offshore. Kpler tracking and satellite imagery analysis show how the region rebuilt its export system.
Key takeaways
- Back at pre-war levels outside Iran. At least 16.5 mbd left the region in September, matching the pre-war average excluding Iran. Iran, under US blockade, accounts for the rest of the gap.
- Through different routes. 40% of the region's crude now leaves without crossing Hormuz, against 17% before the war, through Saudi and United Arab Emirates (UAE) pipelines.
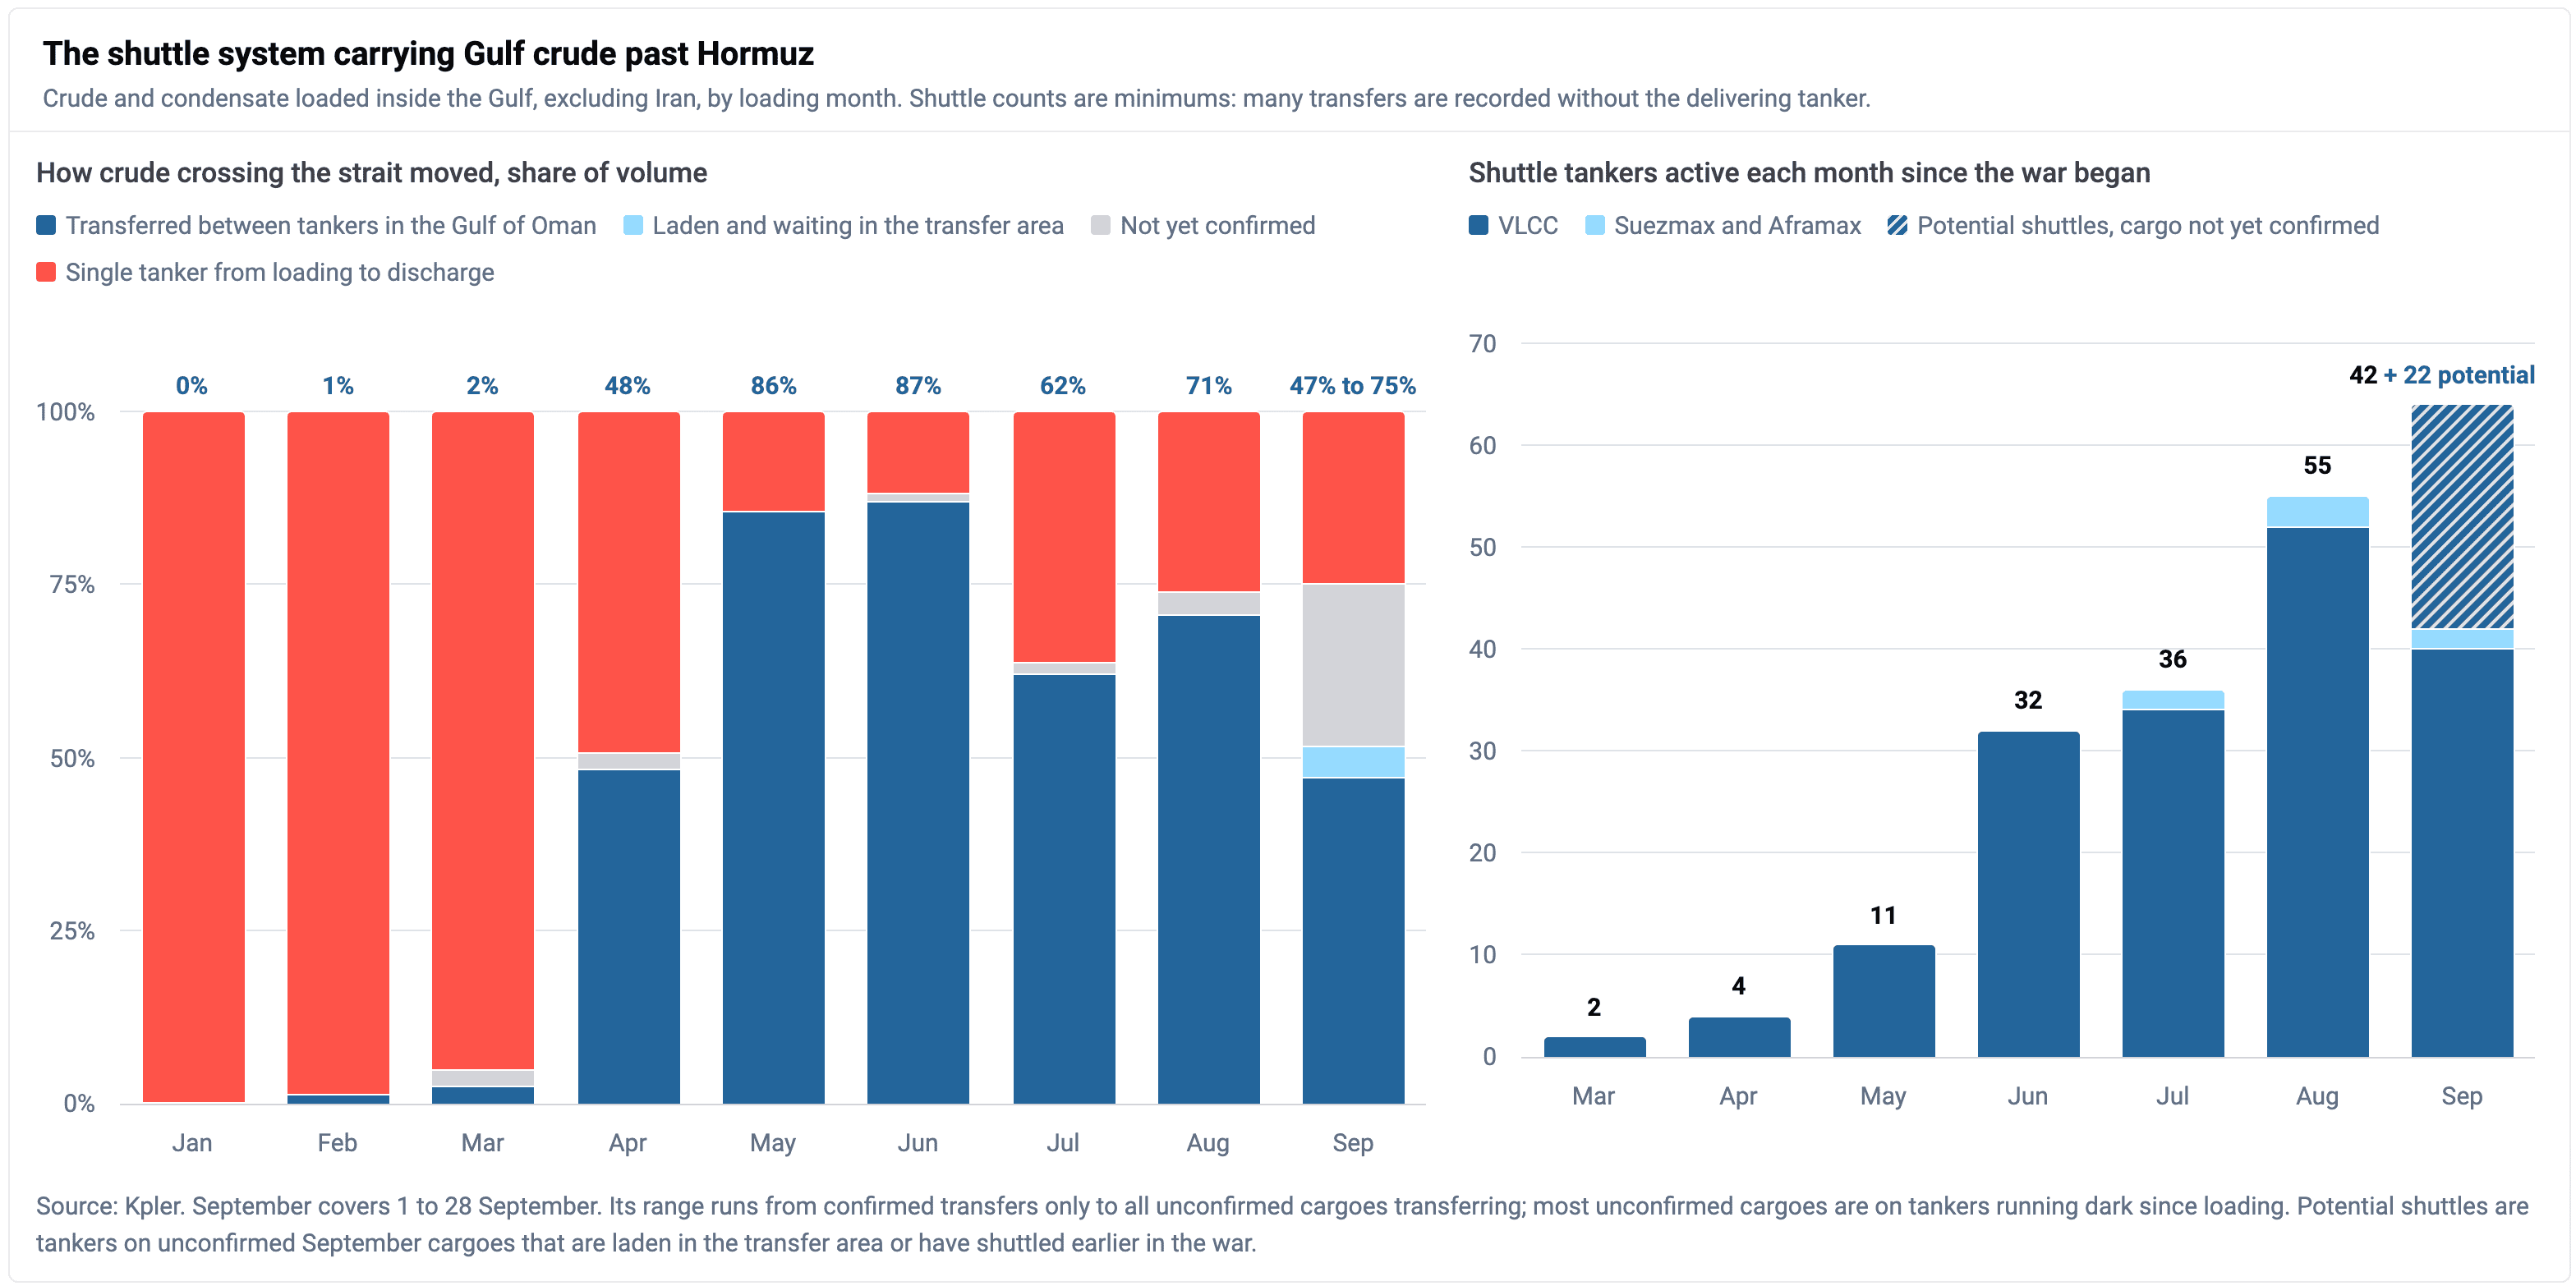
- A shuttle fleet carries most of what crosses. In August, more than 70% of the crude crossing the strait changed tankers off Fujairah or Sohar. Most of the shuttles are very large crude carriers (VLCCs) making round trips every 16 days or so.
- The system reroutes fast. Within 10 days of the attack that halted Yanbu, all 6 Juaymah moorings were full, and Saudi crude crossing Hormuz nearly quadrupled on the month. A week later, Yanbu was loading again.
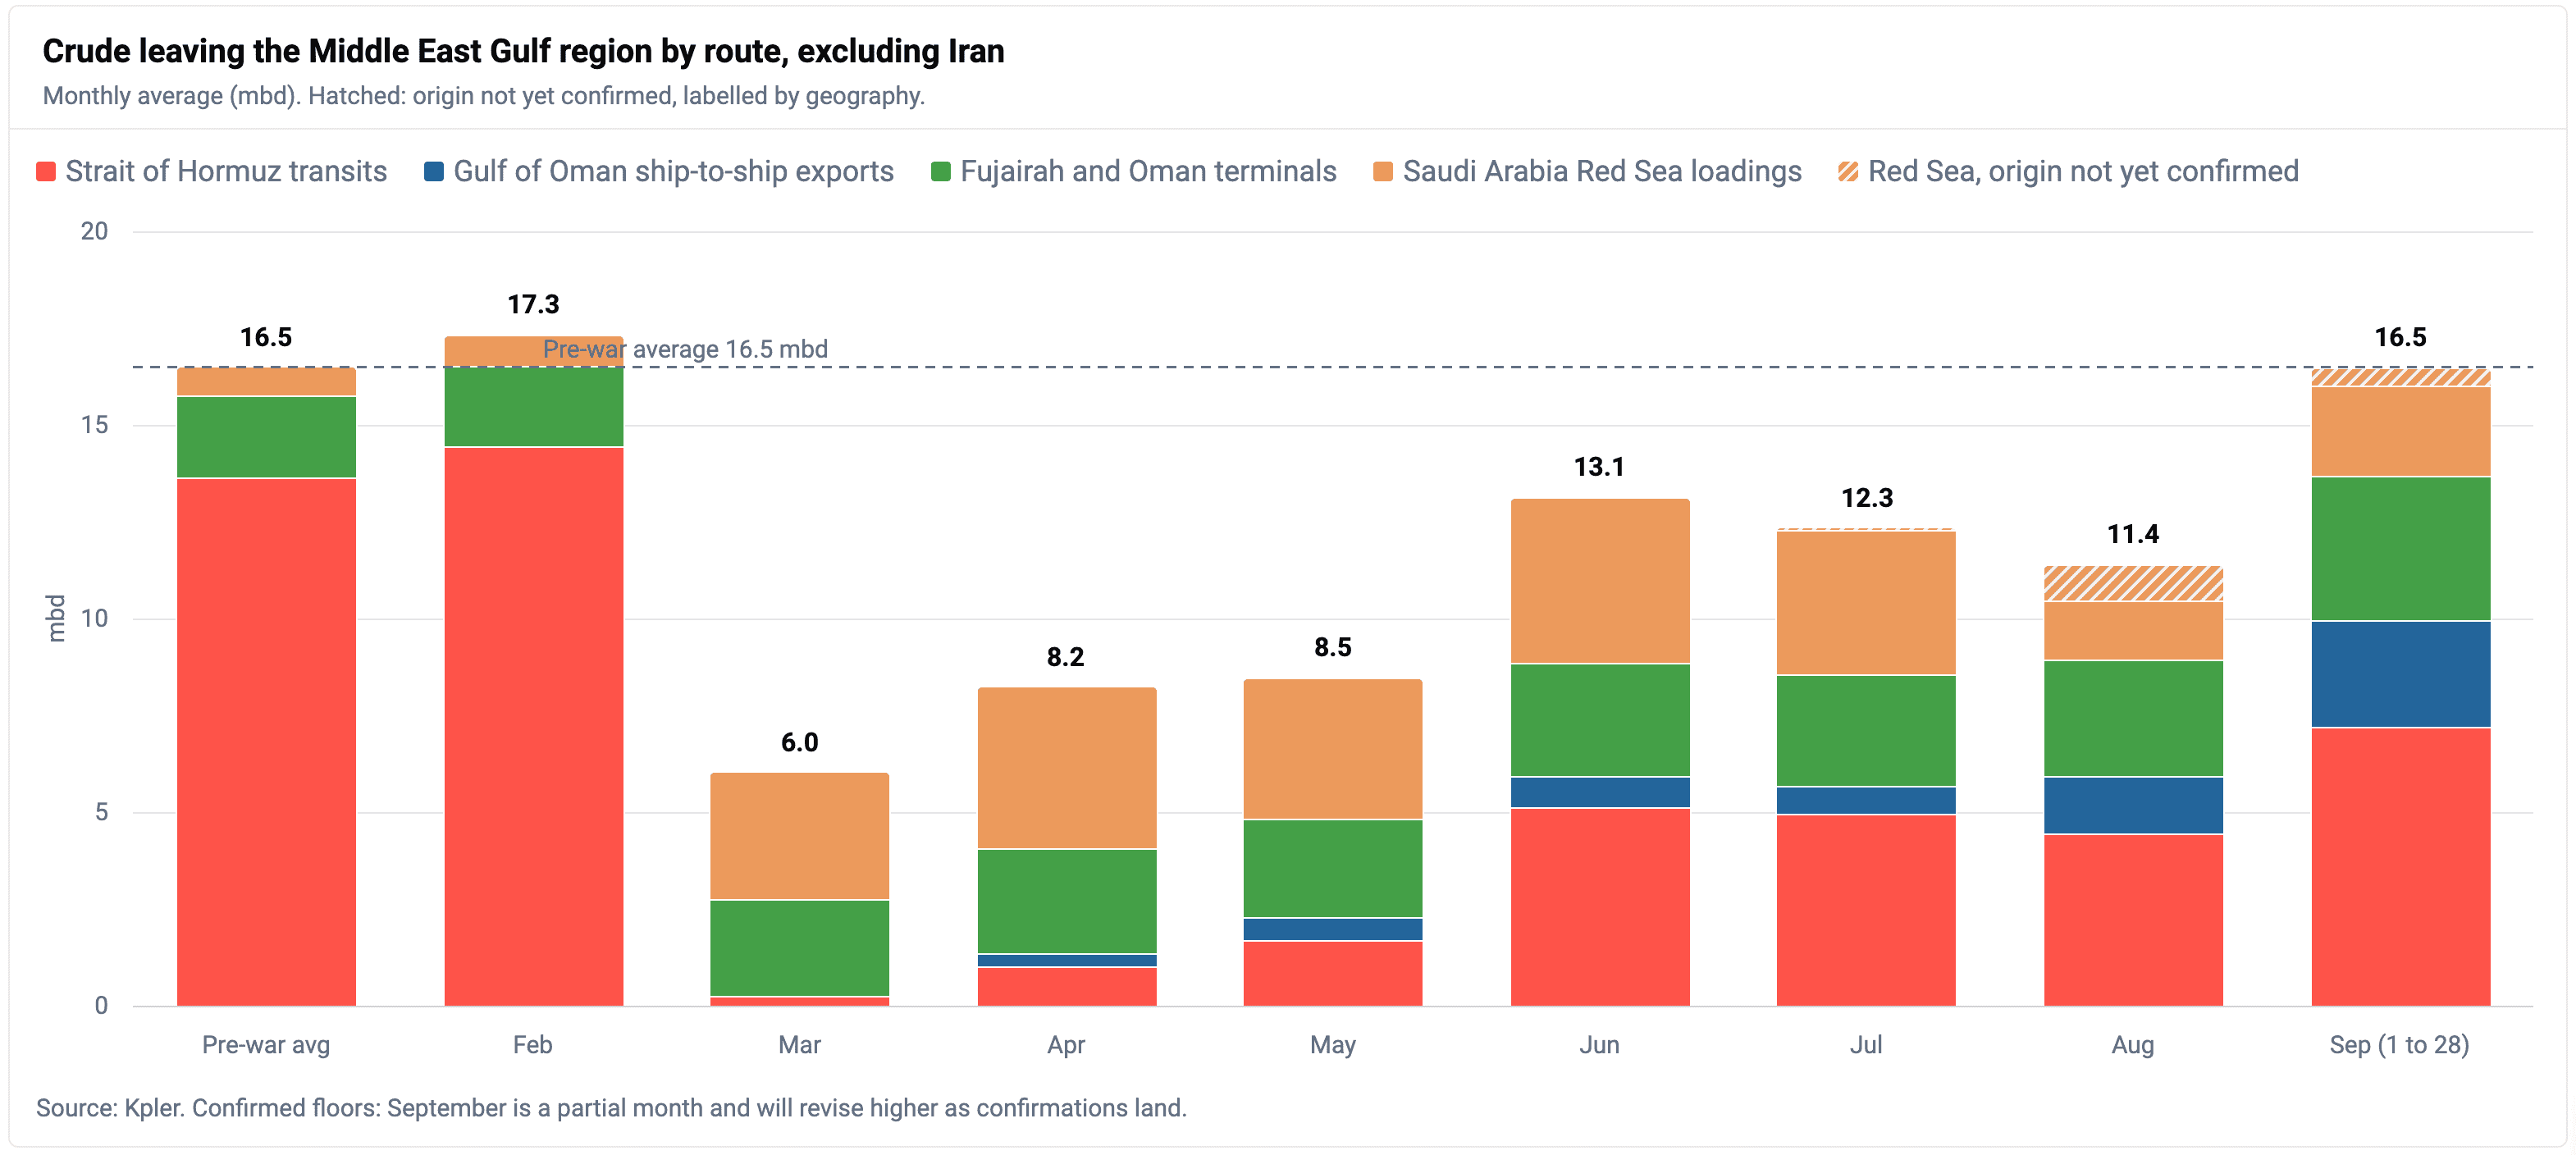
Crude leaving the Middle East Gulf region is back at pre-war levels outside Iran, 7 months after the war closed the Strait of Hormuz. At least 16.5 mbd left the region between 1 and 28 September, matching the pre-war average excluding Iran. That is 10.5 mbd above March's monthly average.
The volume recovered. The route did not. Before the war, 83% of the region's crude crossed Hormuz. In September, 40% left without crossing the strait. Of the crude that did cross in August, more than 70% changed tankers offshore in the Gulf of Oman.
That makes the recovery hard to see with conventional tracking. Tankers cross with their AIS transponders off, cargoes change ships in open water, and Saudi exports have swung between the Gulf and the Red Sea. Kpler combines vessel tracking, satellite imagery, draught changes, port data, market sources, and destination checks to reconstruct each movement.
Crude leaving the Middle East Gulf region excluding Iran, 7-day average (mbd)
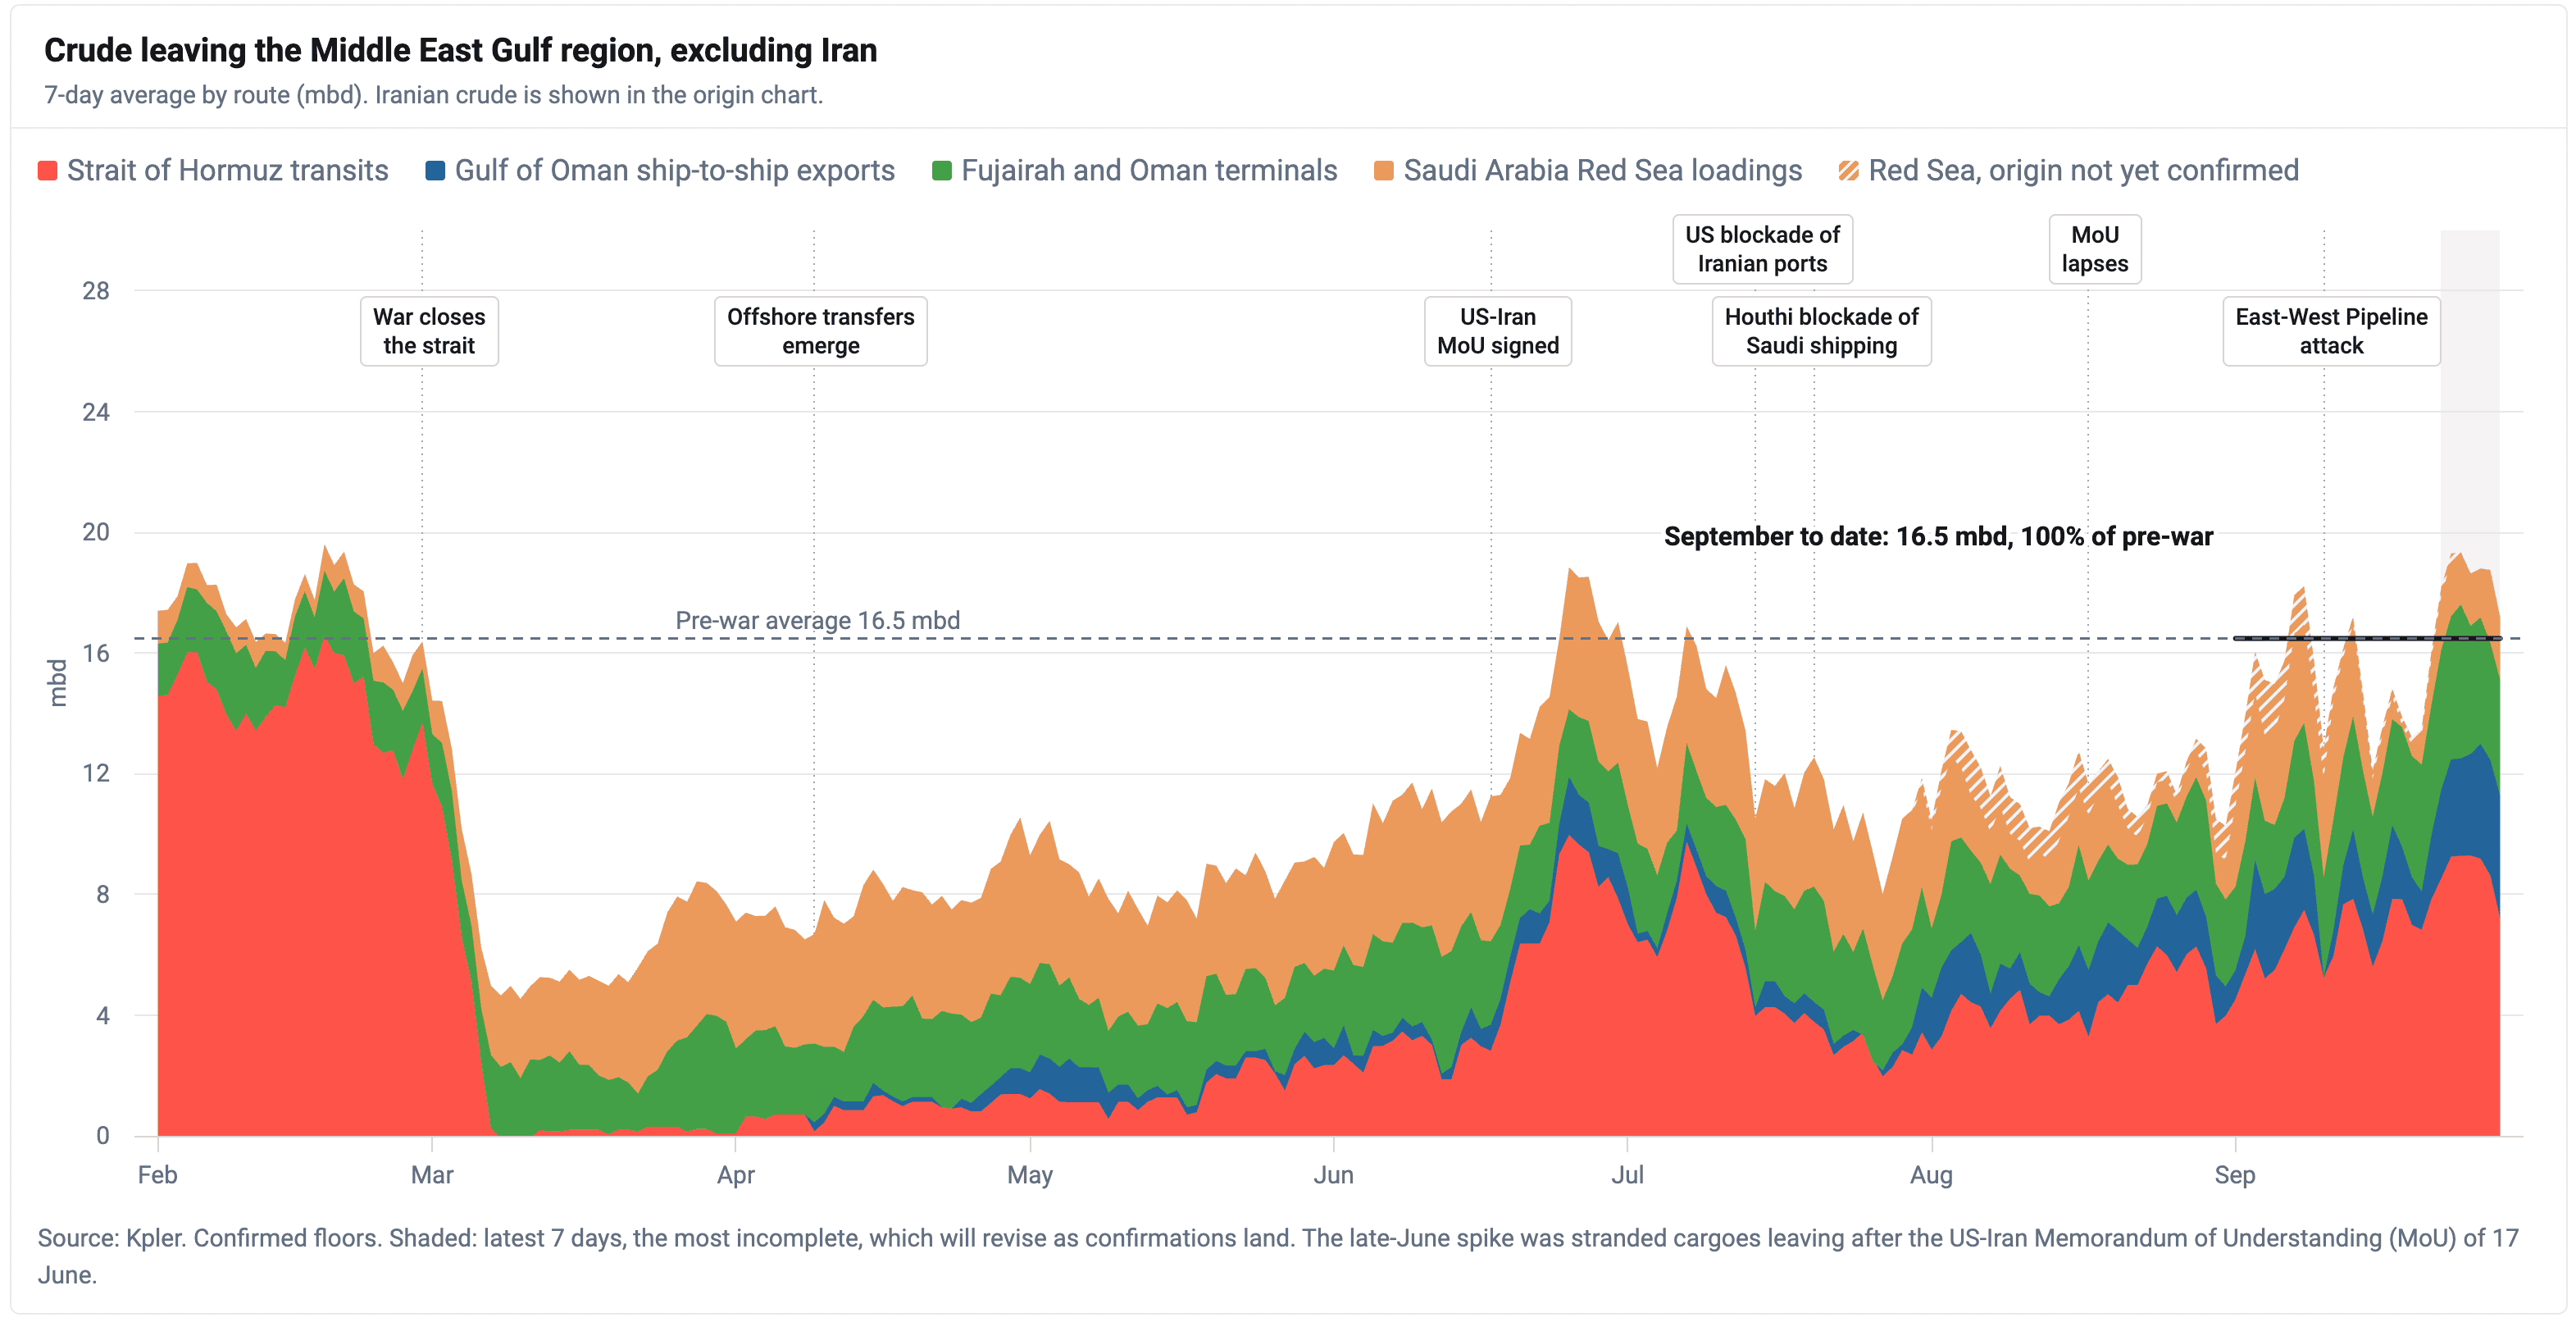
Source: Kpler. The late-June spike was stranded cargoes leaving after the US-Iran Memorandum of Understanding (MoU) of 17 June.
Gulf crude is back, through different routes
When the war closed the strait on 28 February, the 7-day average of non-Iranian crude leaving the region fell by 72% in 10 days, to 4.5 mbd. It has since climbed back through three exits instead of one. In September:
- 60% physically crossed Hormuz, 9.9 mbd, mostly using shuttle tankers
- 23% loaded outside the strait, on the Gulf of Oman coast (primarily Fujairah).
- 17% left through the Red Sea.
Where the region's crude leaves, and how Kpler counts each exit
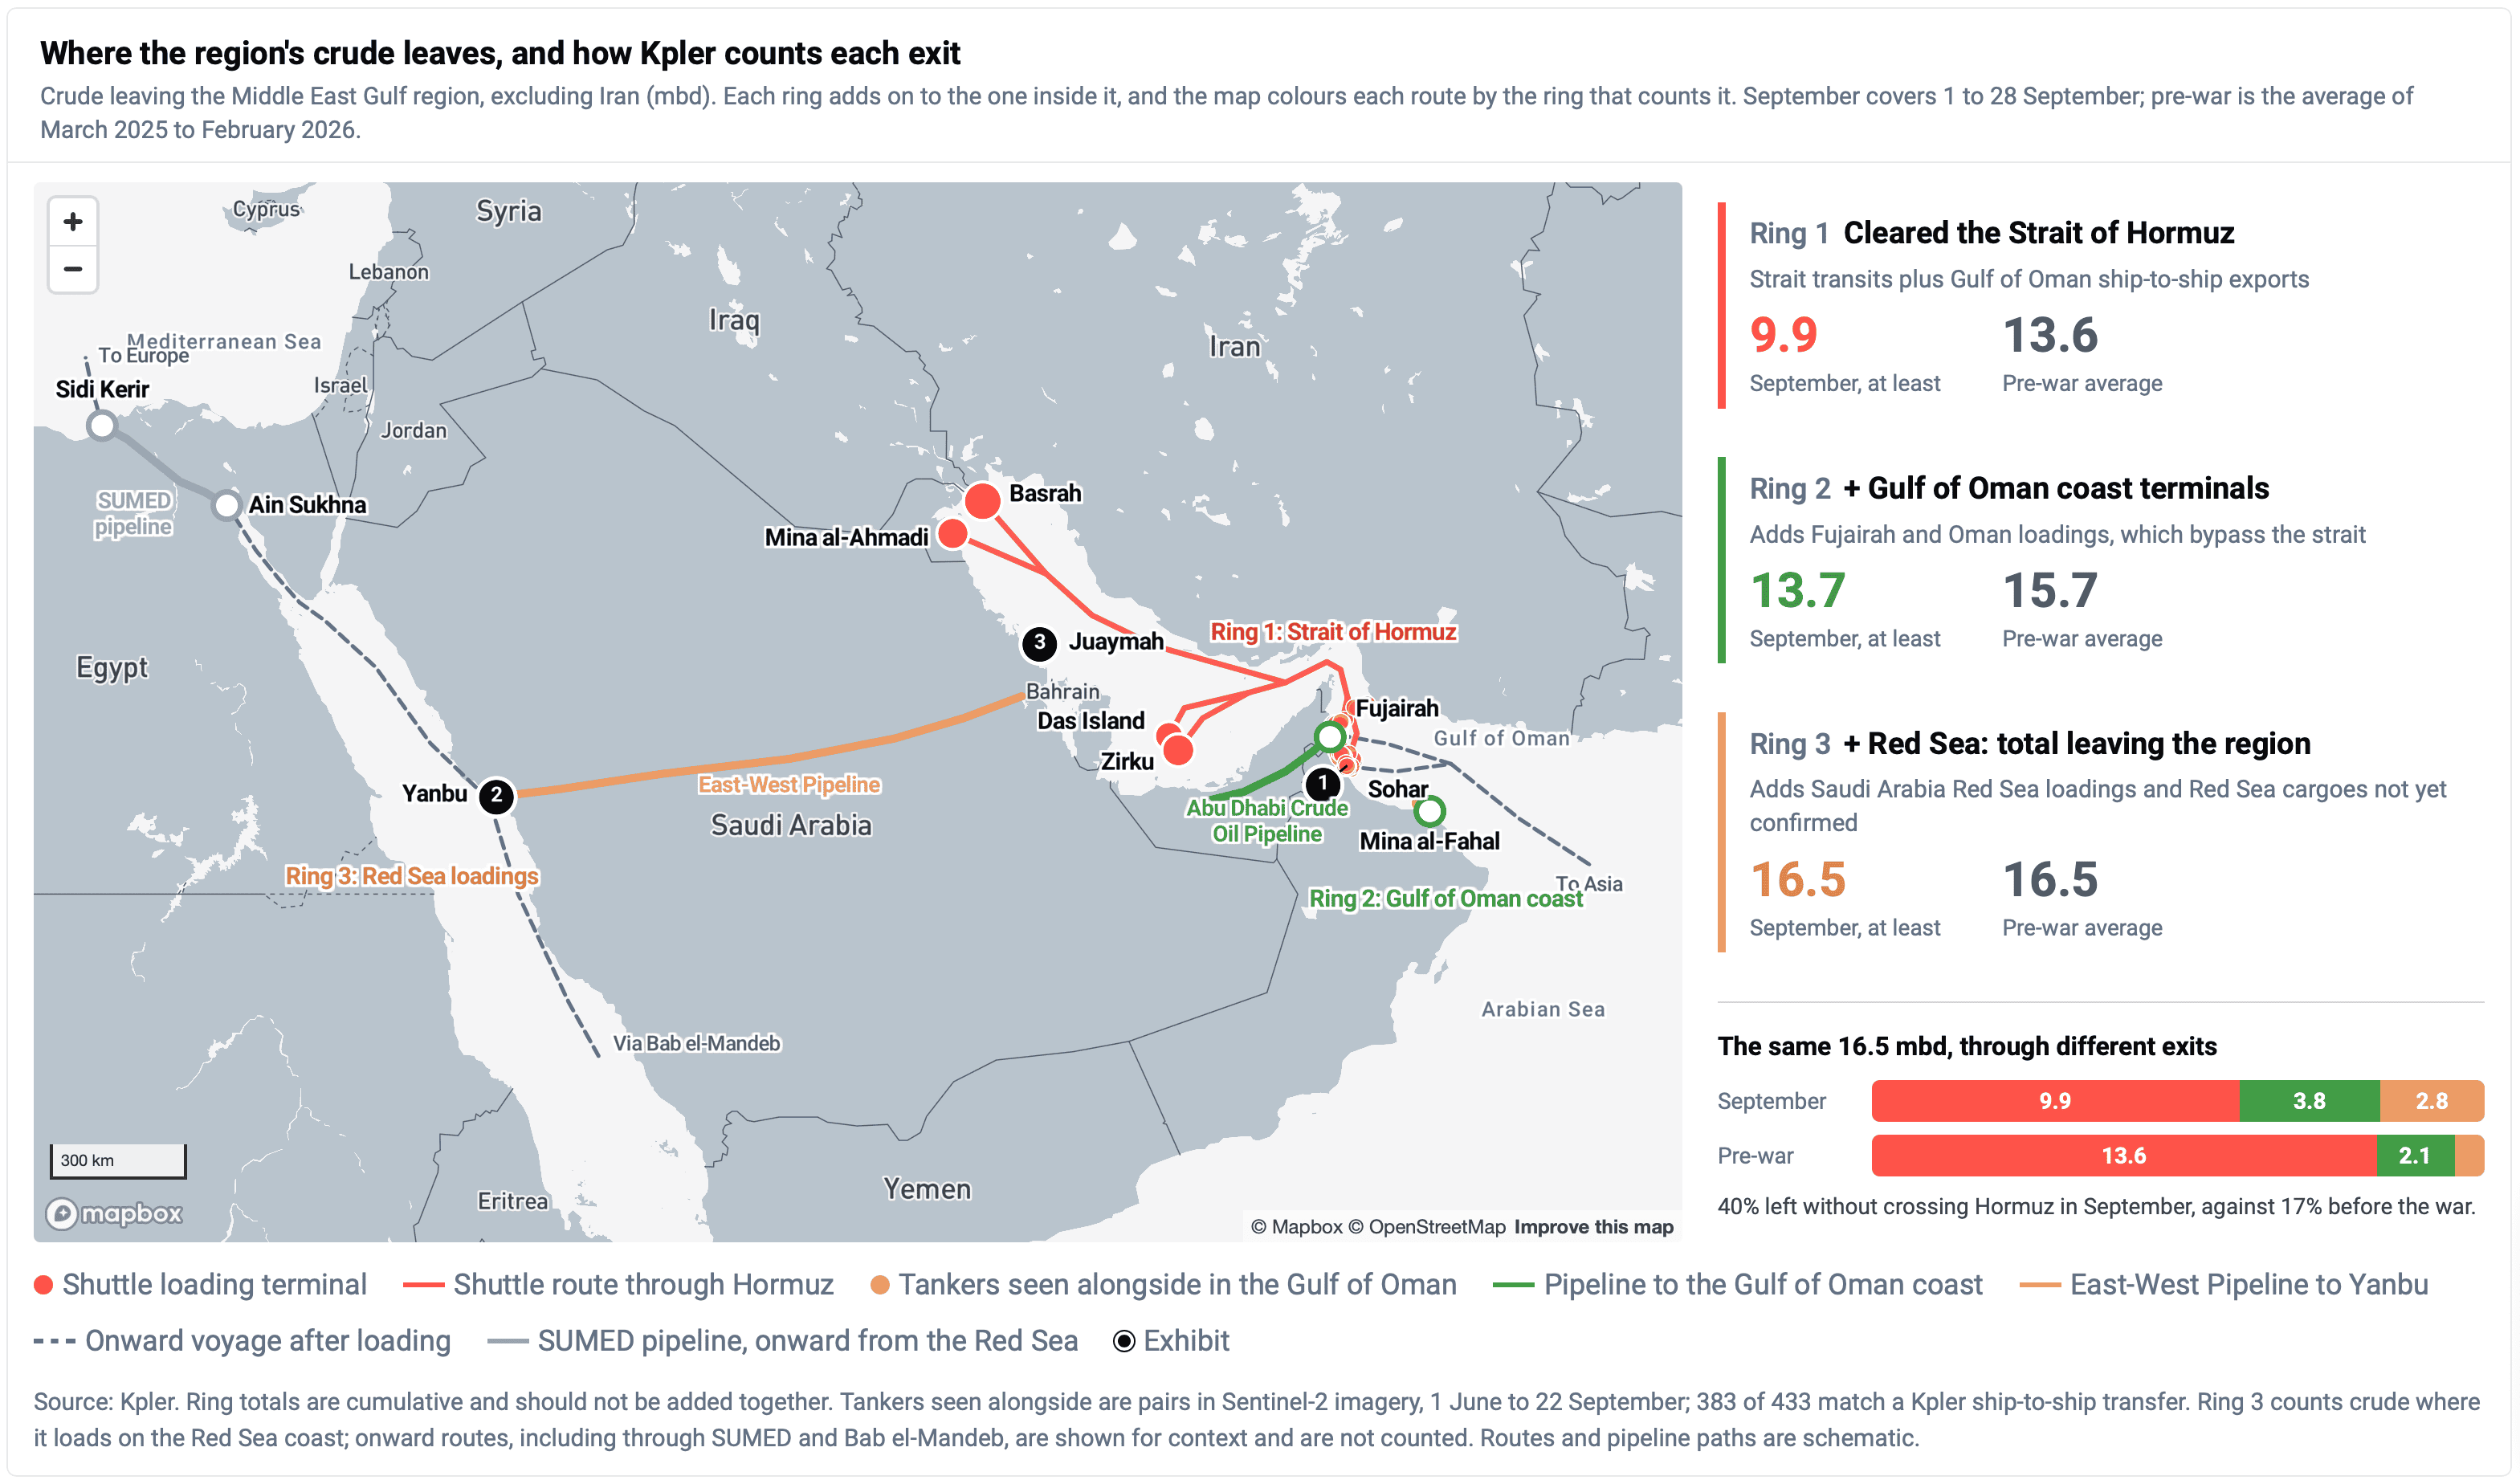
Confirmed crude crossing the strait is still more than a quarter below pre-war. The routes around it have more than doubled and make up almost exactly the difference.
The workaround changed almost month by month. March belonged to the pipelines: 97% of non-Iranian crude leaving the region bypassed Hormuz. By May, a shuttle system had taken over the strait, with 86% of the crude crossing it changing tankers in the Gulf of Oman.
Crude leaving the Middle East Gulf region by route, excluding Iran (mbd)
Pipelines opened the first bypass
Saudi Arabia pushed crude west through the East-West Pipeline to Yanbu on the Red Sea. Saudi Red Sea loadings rose from 0.75 mbd before the war to 4.3 mbd in June, as the Yanbu bypass took over from the Gulf coast. The UAE sent crude through the Abu Dhabi Crude Oil Pipeline to Fujairah, where loadings rose from 1.1 mbd to 2.7 mbd.
Kuwait, Qatar, and most of Iraq have no route around the strait. Their recovery had to come back through Hormuz.
A shuttle fleet now carries crude through Hormuz
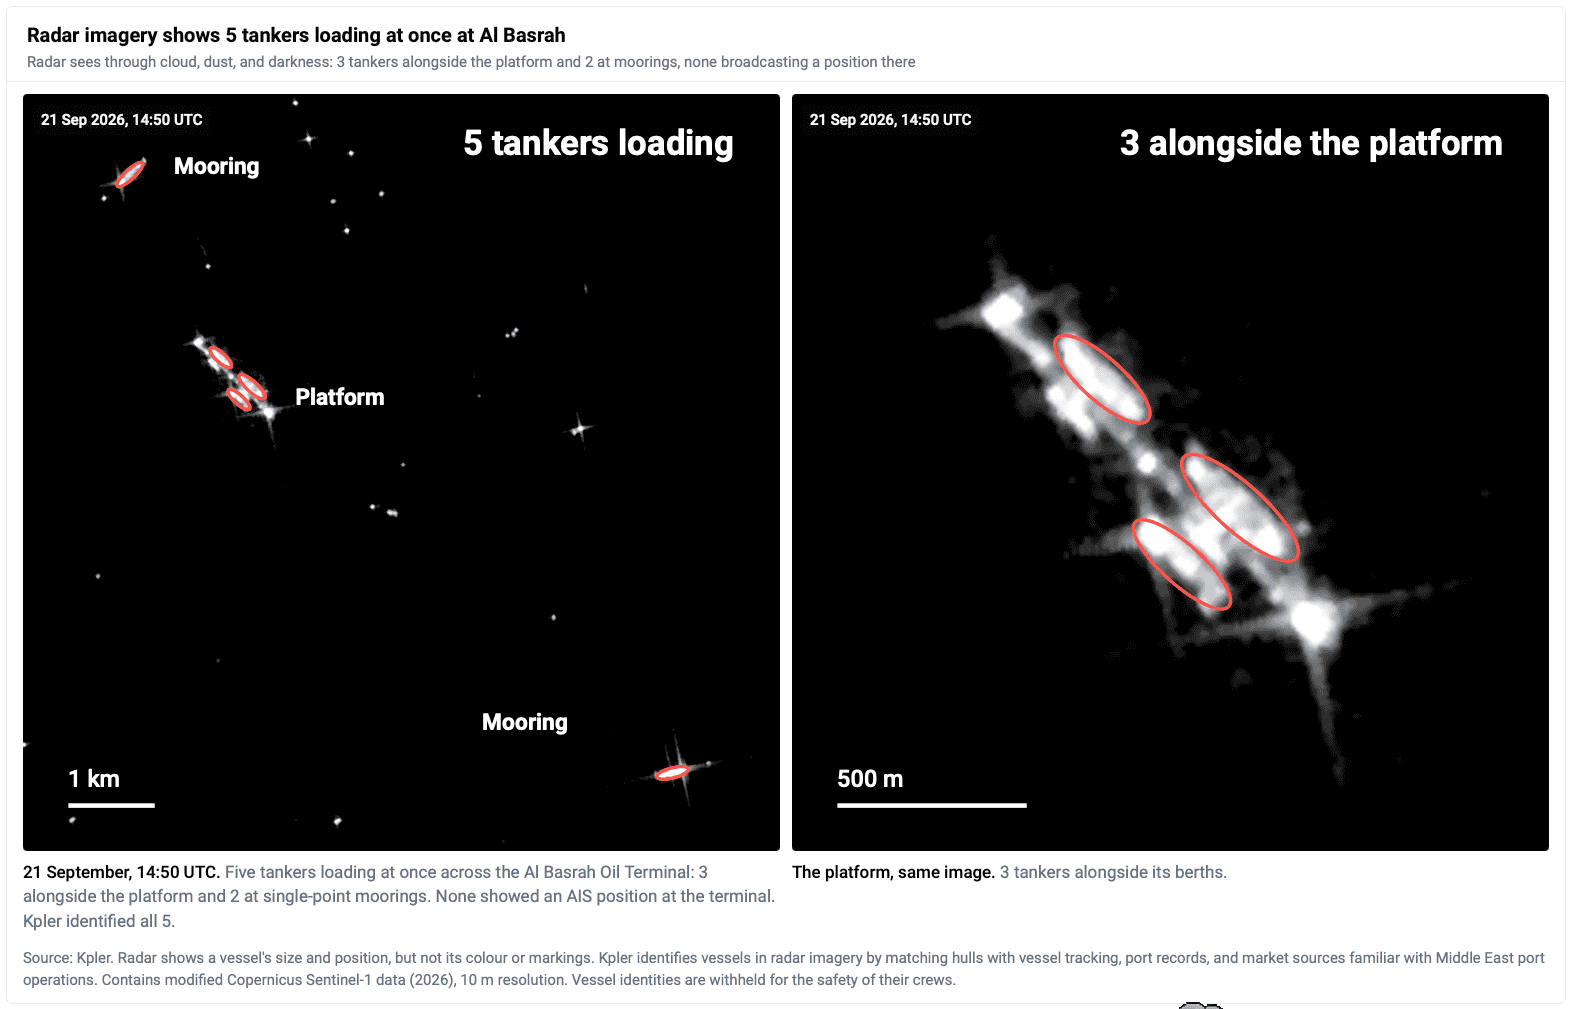
Crude crossing the strait came back dark. Iran designated transit corridors through the strait. On those corridors, tankers broadcasting their Automatic Identification System (AIS) signal fell from 13 trades in March to none by May, according to Kpler analysis of the shuttle corridors. Some dark tankers do not switch AIS back on until they are as far away as southern India. Kpler confirms each crossing from imagery, draught changes, and checks at the destination port. Radar sees through cloud, dust, and darkness: on 21 September, Sentinel-1 imagery showed 5 tankers loading at once at the Al Basrah Oil Terminal, none broadcasting a position there. Kpler identified all 5.
Sentinel-1 radar, Al Basrah Oil Terminal, 21 September: 5 tankers loading, 3 alongside the platform and 2 at moorings
Most of that crude no longer travels on a single tanker:
Load inside the Gulf → shuttle tanker crosses Hormuz → transfer off Fujairah or Sohar → long-haul tanker to Asia or Europe
At least 63 VLCCs now work the shuttle trade. A core fleet of 35 has completed at least 3 round trips each, typically about 16 days apart, and accounts for three-quarters of shuttle voyages. Dozens of VLCCs now spend months shuttling between Gulf terminals and transfer points outside Hormuz rather than carrying crude to the final buyer.
The shuttles load mostly at Basrah, Zirku, Mina al-Ahmadi, and Das Island. Saudi crude has joined since July, though most Saudi cargoes sail direct on the national fleet. Transfers split almost evenly between Fujairah (54%) and Sohar (45%).
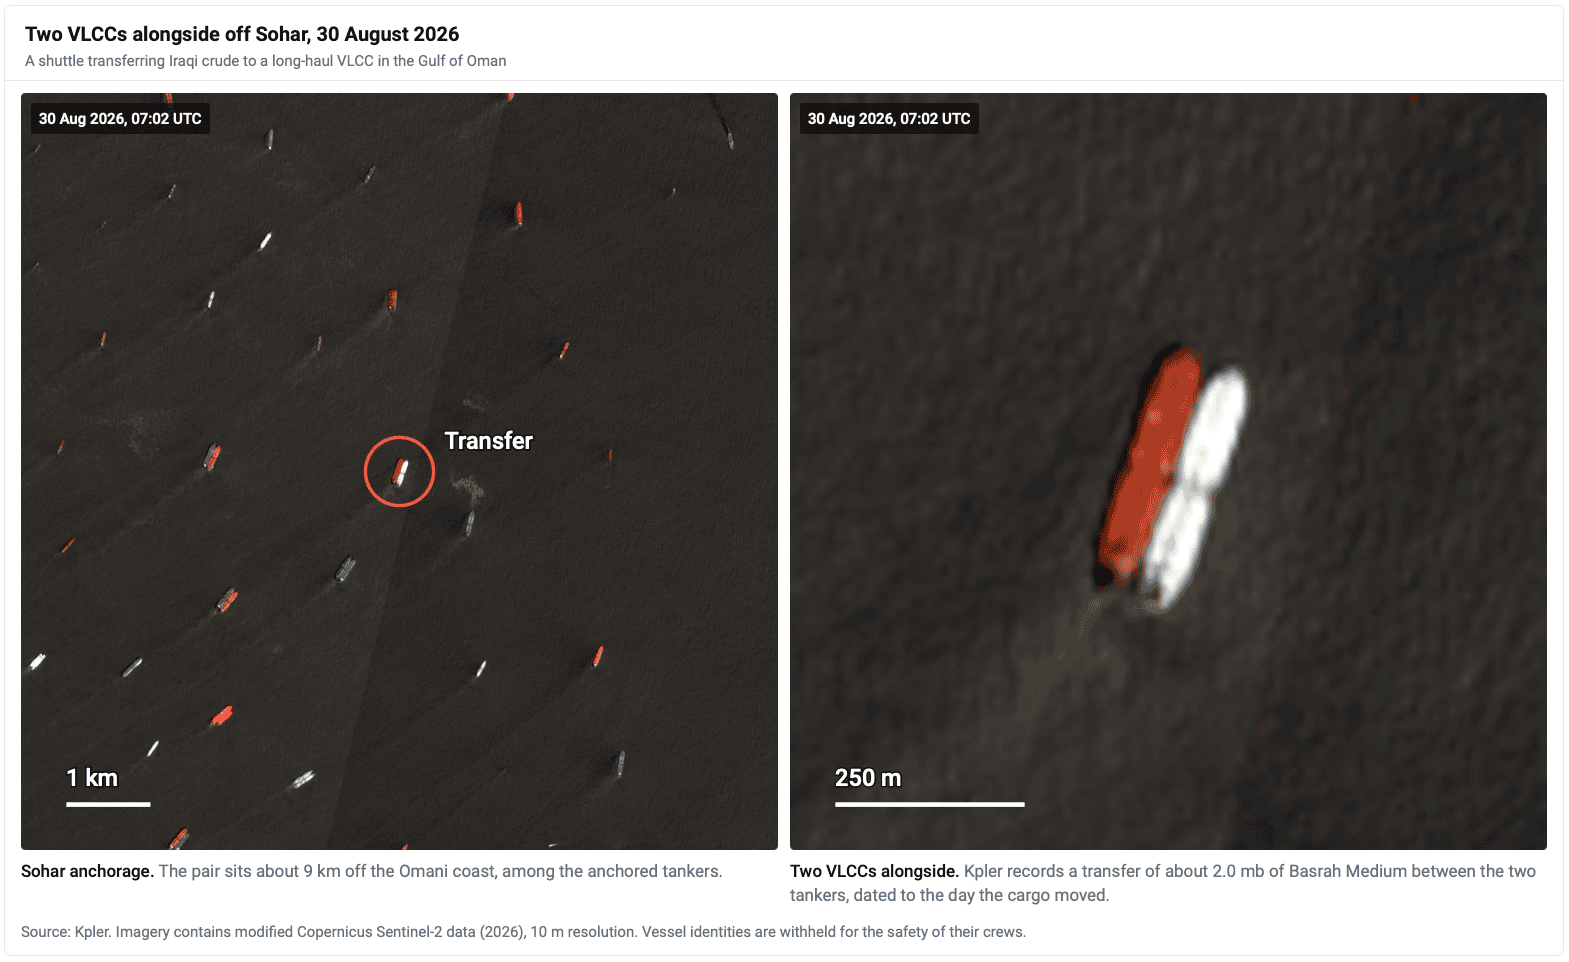
Two VLCCs alongside off Sohar, 30 August, transferring about 2.0 mb of Basrah Medium
The shuttle system carrying Gulf crude past Hormuz
Source: Kpler
Before the war, almost no Gulf crude changed tankers in the Gulf of Oman. In August, more than 70% of the crude crossing the strait did. That share is now easing, as loadings outgrow transfer capacity and exporters shift to direct voyages. Kpler records a transfer even when one of the two tankers is dark, and backdates each cargo to the day it moved.
Saudi Arabia operating on both coasts
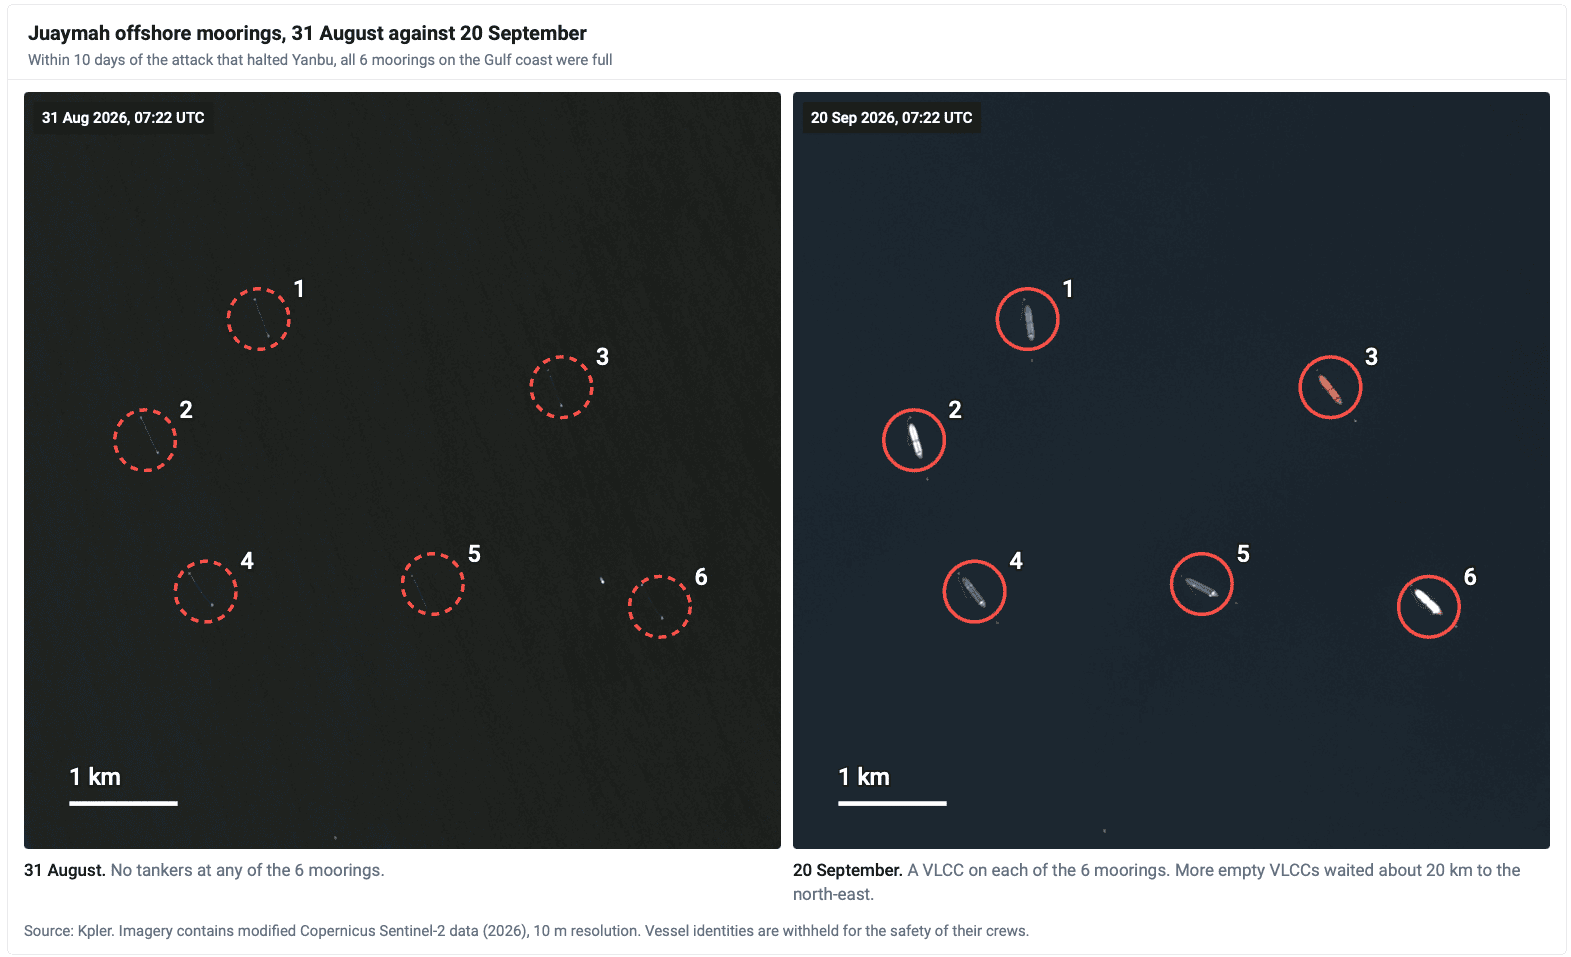
On 20 September, all 6 of the Juaymah terminal's offshore loading moorings were occupied by VLCCs.
The Red Sea route had already been squeezed. On 20 July, Yemen's Houthis declared a maritime embargo on vessels serving Saudi ports. Saudi crude through the Bab el-Mandeb strait then fell from above 3.5 mbd to a few hundred kbd in August, as Yanbu cargoes turned north through Egypt's Sumed pipeline. On 10 September, an attack on the East-West Pipeline halted Yanbu loadings altogether.
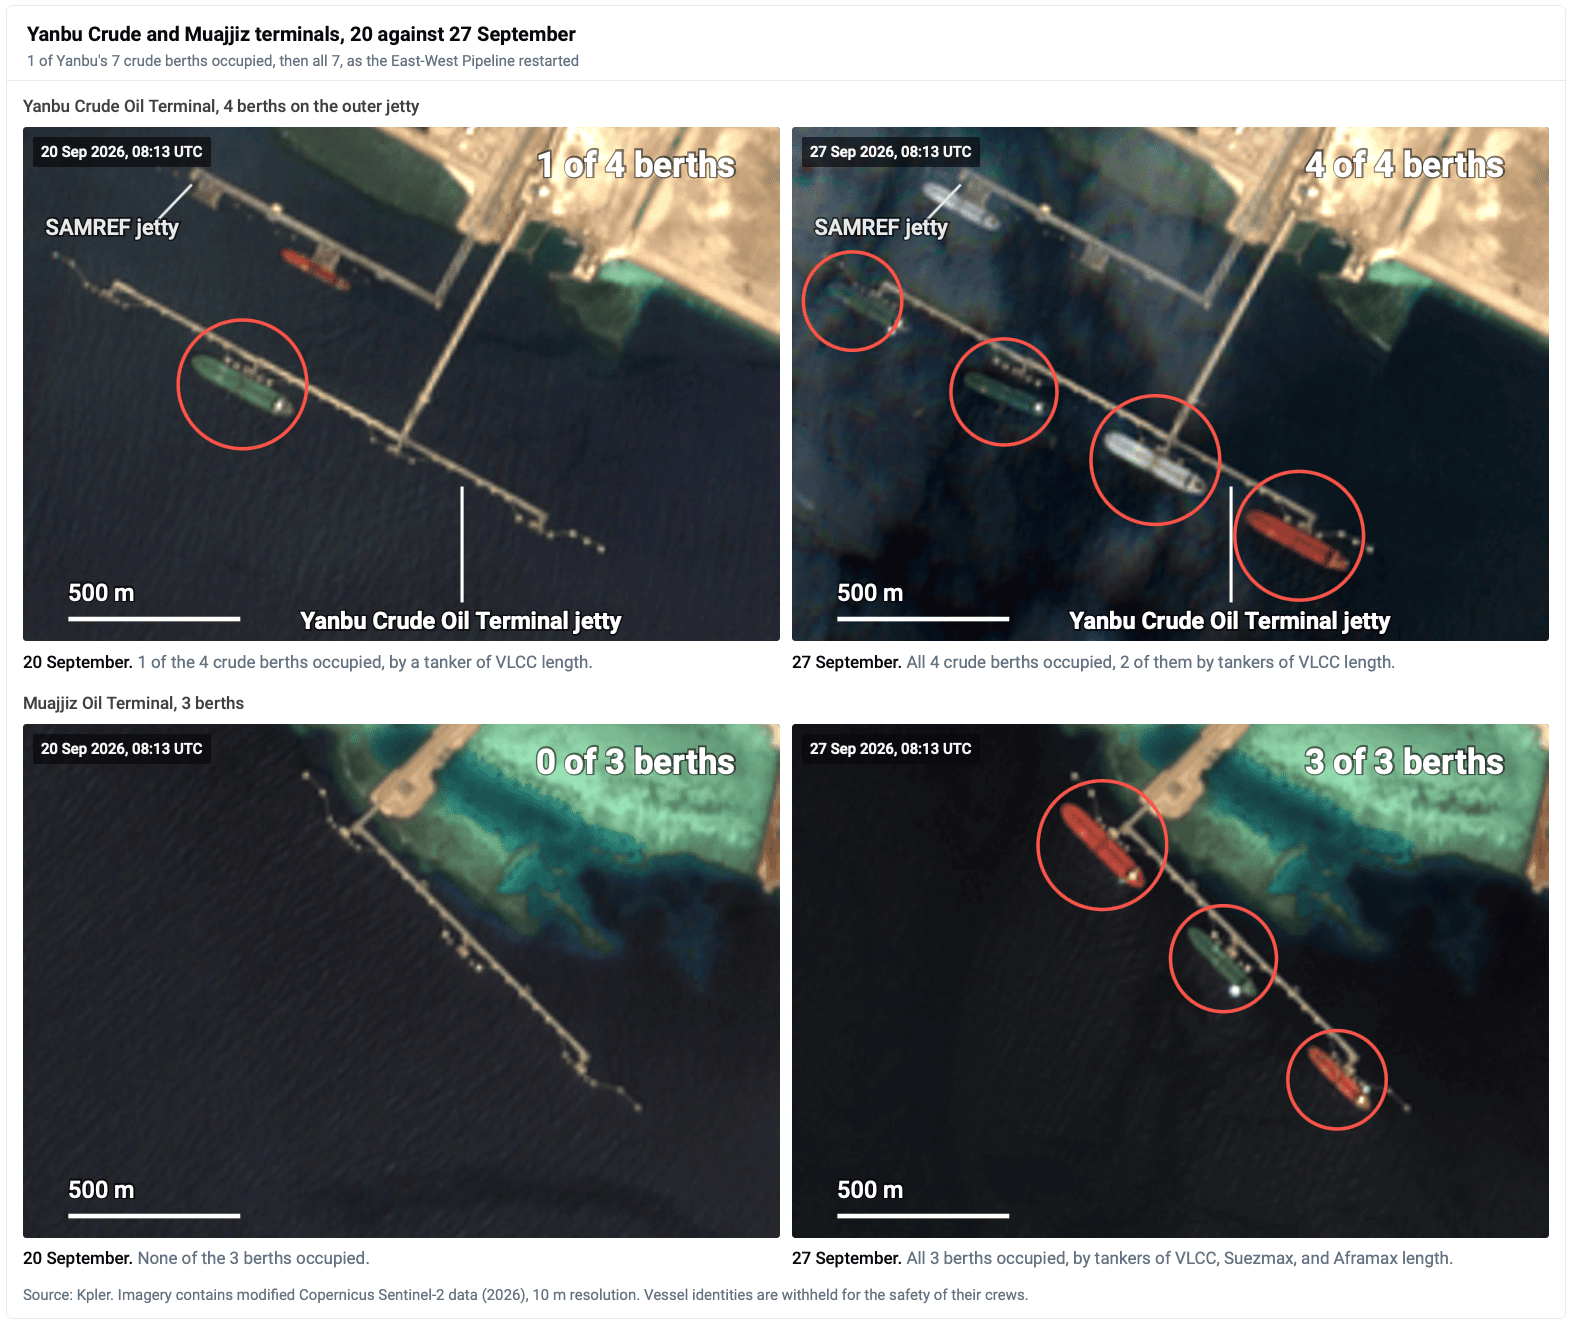
Satellite imagery captured the switch from one coast to the other, and back. On 13 September, Kpler imagery showed no tankers at the Yanbu Crude and Muajjiz terminals. Seven days later, all 6 Juaymah moorings on the Gulf coast were occupied. By 27 September, as the pipeline restarted, all 7 Yanbu berths were full again.
Yanbu Crude and Muajjiz terminals, 20 against 27 September: 1 of 7 berths occupied, then all 7
Juaymah moorings, 31 August against 20 September: none occupied, then a VLCC on all 6
The flows followed. Confirmed Saudi crude crossing Hormuz jumped from 0.7 mbd in August to 2.8 mbd in September.
Who is exporting the crude
Saudi Arabia led September with at least 5.1 mbd of confirmed crude, or 5.6 mbd with the Red Sea cargoes that are most likely Saudi. The UAE followed at 3.2 mbd and Iraq at 2.6 mbd.
Another 3.4 mbd has left the region yet without a confirmed country, most of it crude that changed tankers in the Gulf of Oman without satellite imagery to confirm their respective shuttles. Kpler labels it by geography until the chain back to the loading terminal is proven. Where chains are proven, the crude is Iraqi, Emirati, Kuwaiti, Qatari, and Saudi.
Crude leaving the Middle East Gulf region by origin country (mbd)
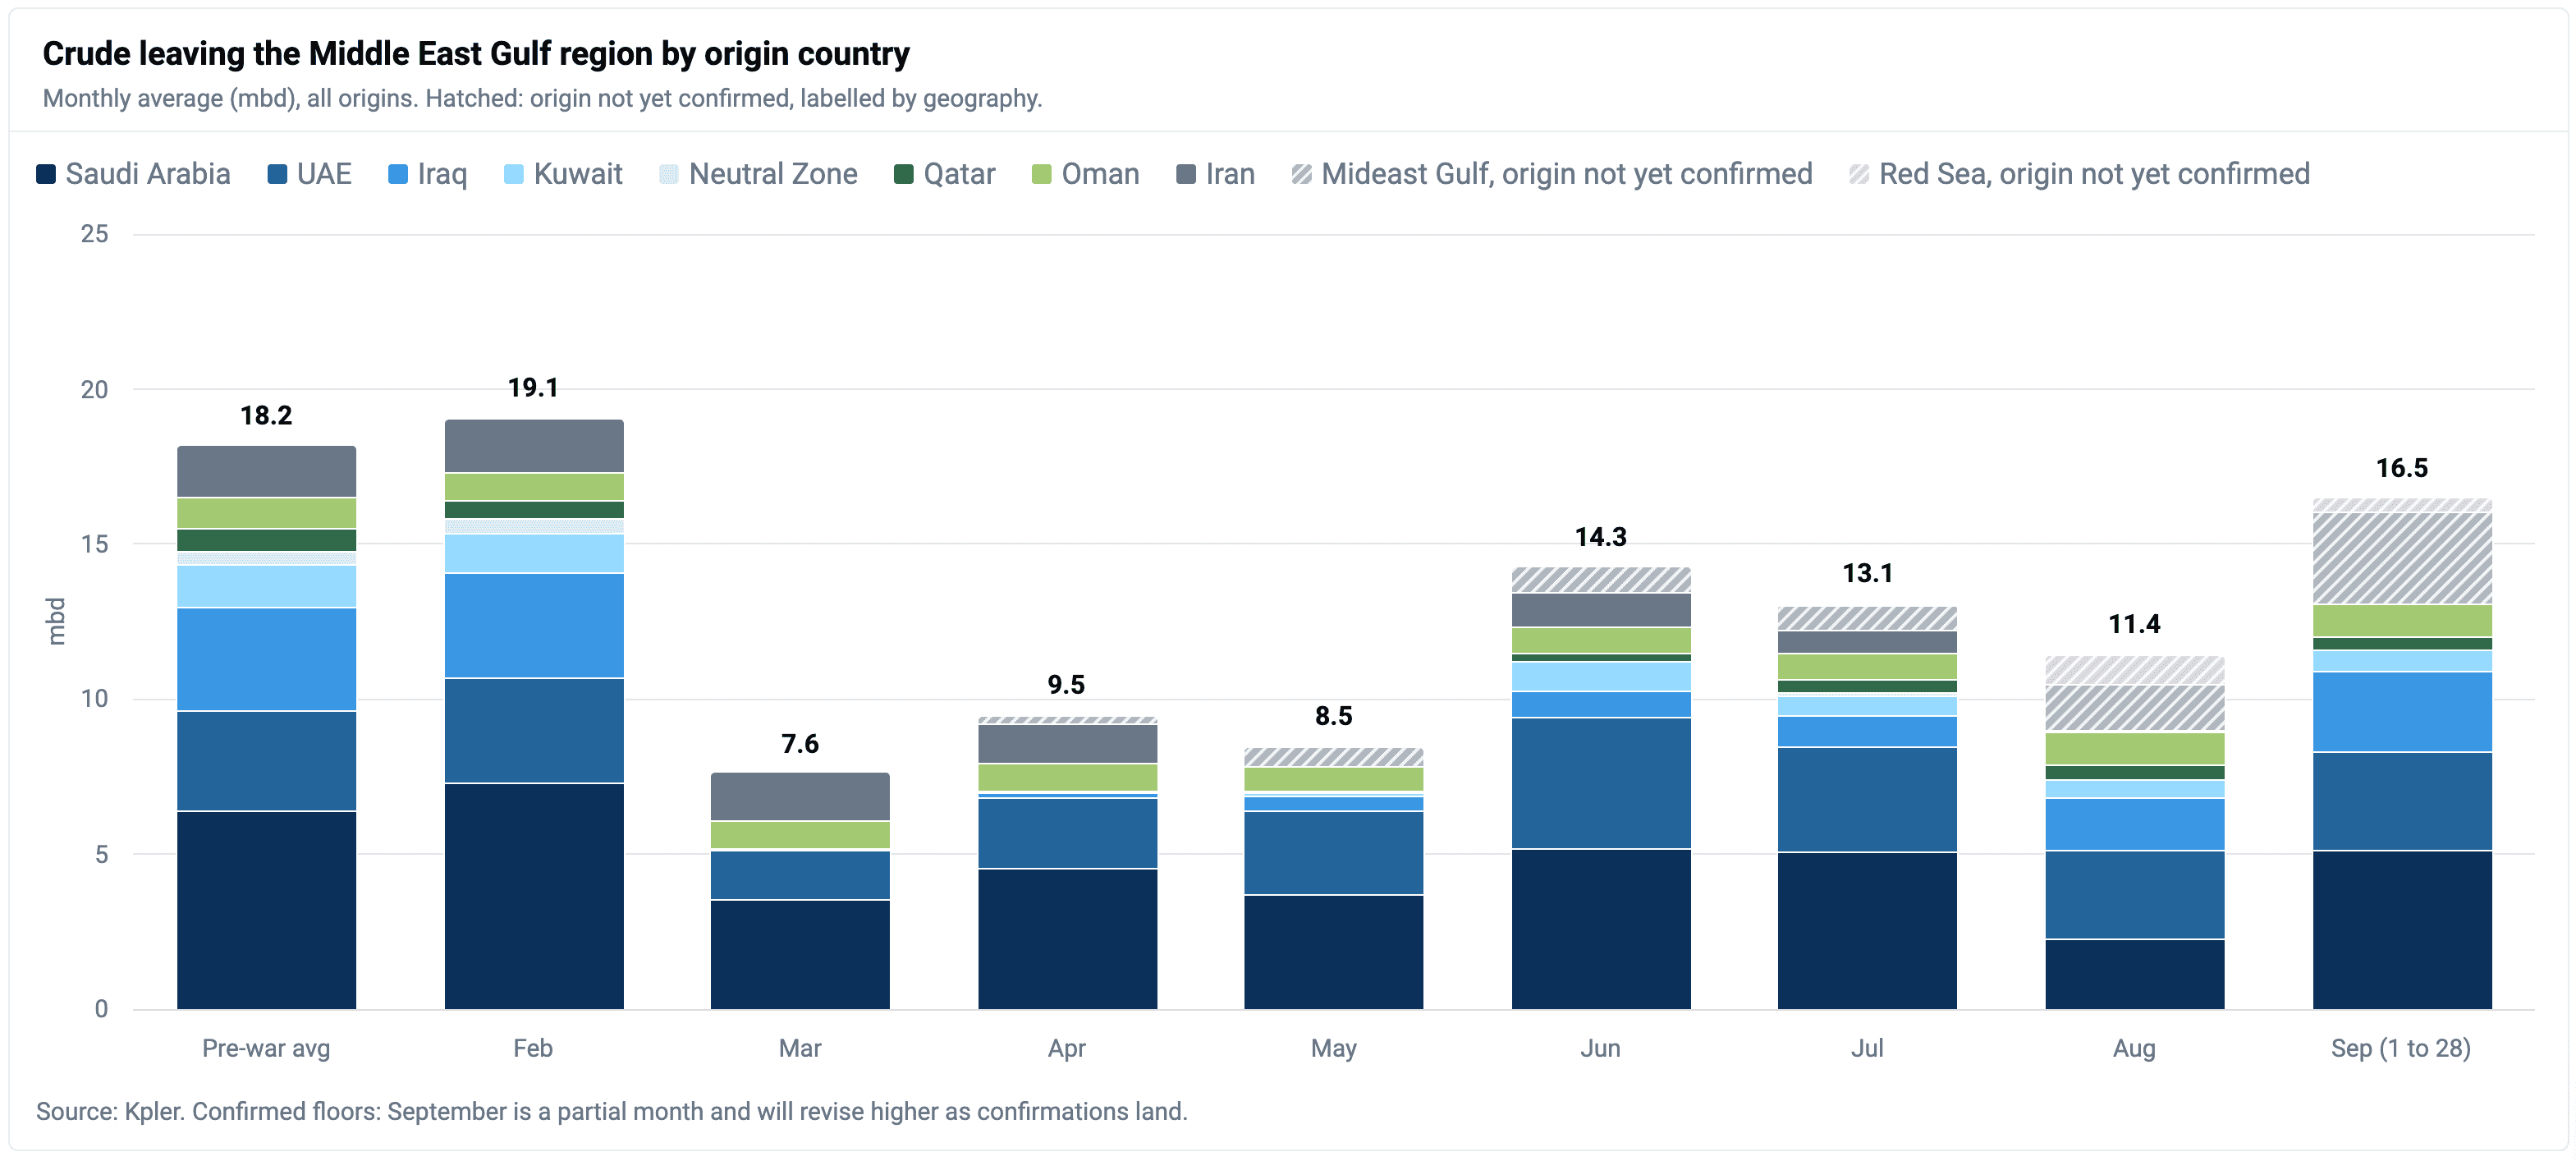
Source: Kpler
The buyers changed less than the routes. In August, Asia still took 84% of the region's crude, against 87% before the war. Egypt, Europe, and the wider Mediterranean nearly doubled their share to 16%, as Saudi Red Sea cargoes turned north. India's imports of Middle East crude are back at pre-war levels, near 3.0 mbd in September.
Iran, the exporter the new system leaves out
Iran is the main exception to the recovery. While other Gulf producers rebuilt routes around and through Hormuz, Iranian flows have moved with US policy rather than logistics.
In March, Iranian crude accounted for 1.6 mbd of the 1.8 mbd still crossing the strait. A US naval blockade from 13 April pushed crossings close to zero by May. The 17 June MoU and a temporary oil waiver brought them back to 1.1 mbd in June, before the waiver was revoked and the blockade reimposed in July. Iranian crossings have stayed near zero since. Talks resumed on 22 September, but Washington rejected an Iranian offer to reopen the strait within 7 days if the blockade was lifted.
Kpler satellite data show the effect onshore. Iranian crude stocks rose by about 20 mb from mid-February to late May, drew down as exports resumed in June, and have held near 67 mb since mid-August.
Nor does Iranian crude appear to be hiding among the barrels without a confirmed country. More than half of those with a known destination went to India, South Korea, Taiwan, Japan, and Europe. Since March 2025, those markets have taken just 4 mb of Iranian crude, against 382 mb for China.
Iran averaged 1.7 mbd before the war. Its absence explains the difference between September matching pre-war levels excluding Iran and reaching 91% including it.
A different export system
The recovery has already survived 3 shocks: the squeeze on the Red Sea route, the lapse of the US-Iran MoU, and the September attack on the East-West Pipeline. Each time, barrels shifted routes.
The question now is not only how much crude the region can export, but where the next barrel can leave. Three constraints matter:
- Iran. Any easing of the US blockade could return up to 1.7 mbd, Iran's pre-war average, which the current system does not carry.
- Yanbu. Loadings resumed in late September, but full Petroline repairs could take 4 to 6 weeks.
- Gulf of Oman transfer capacity. Ship-to-ship activity there hit a record in September, and more volume now means more direct voyages through the strait.
Methodology
Kpler adds a movement only once independent evidence confirms it, using vessel tracking, satellite imagery, draught changes, market sources, port information, and destination checks. Recent figures are therefore minimum confirmed volumes, and are backfilled to the date of movement as additional evidence arrives. Country origin is assigned only when the chain to the loading point is proven.
Figures are crude and condensate, excluding Iran unless stated. Pre-war refers to March 2025 to February 2026, and September covers 1 to 28 September. Domestic shipments and Egyptian and Sudanese Red Sea exports are excluded. Kpler data as of 29 September 2026. Full methodology · Saudi West Coast note

See why the most successful traders and shipping experts use Kpler

.jpg)