How Kpler's global data predicted refinery earnings — weeks before companies reported them
Before the bell
Kpler is actively developing an earnings metrics prediction model powered by its proprietary global data. The results below are predictions that were made on July 8, 2026 and sent to some interested early adopters weeks ahead of the earnings season. They represent initial output from this model across Q2 2026 earnings season. We will be hosting a beta for this product later this year — those interested can sign up at the bottom of this document to be contacted when access becomes available.
Accuracy that stands on its own
We generate predictions from physical signals based on Kpler’s proprietary data — independent of the guidance a company chooses to disclose. This quarter demonstrated what that independence means in practice.
Where we stood on guidance
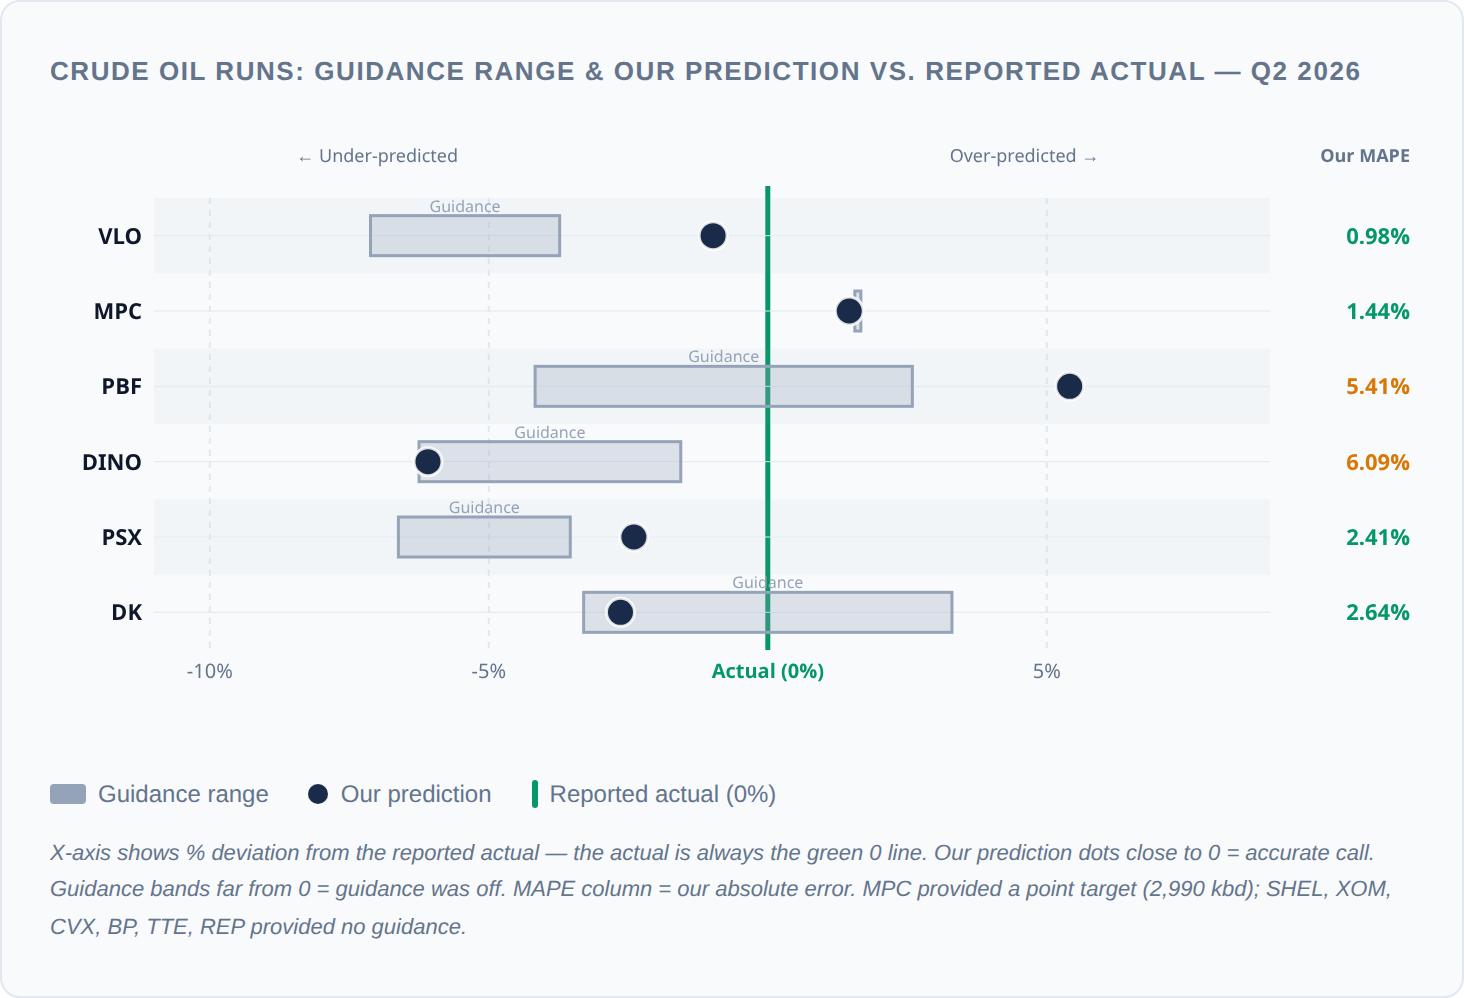
Six of our covered tickers disclosed formal guidance for Q2 2026 runs or throughput. Our predictions, built from derived predictive physical-features, were set before earnings and scored after. The chart below shows each prediction as a percentage deviation from the reported actual, with the company's guidance range shown for reference. Median MAPE (Mean Absolute Percentage Error) across six guided tickers: 3.14%
The numbers
Q2 2026 was a volatile quarter for global refining. Crack spreads, which had been compressed through Q1, recovered sharply by late May. Margins expanded across all reporting companies.
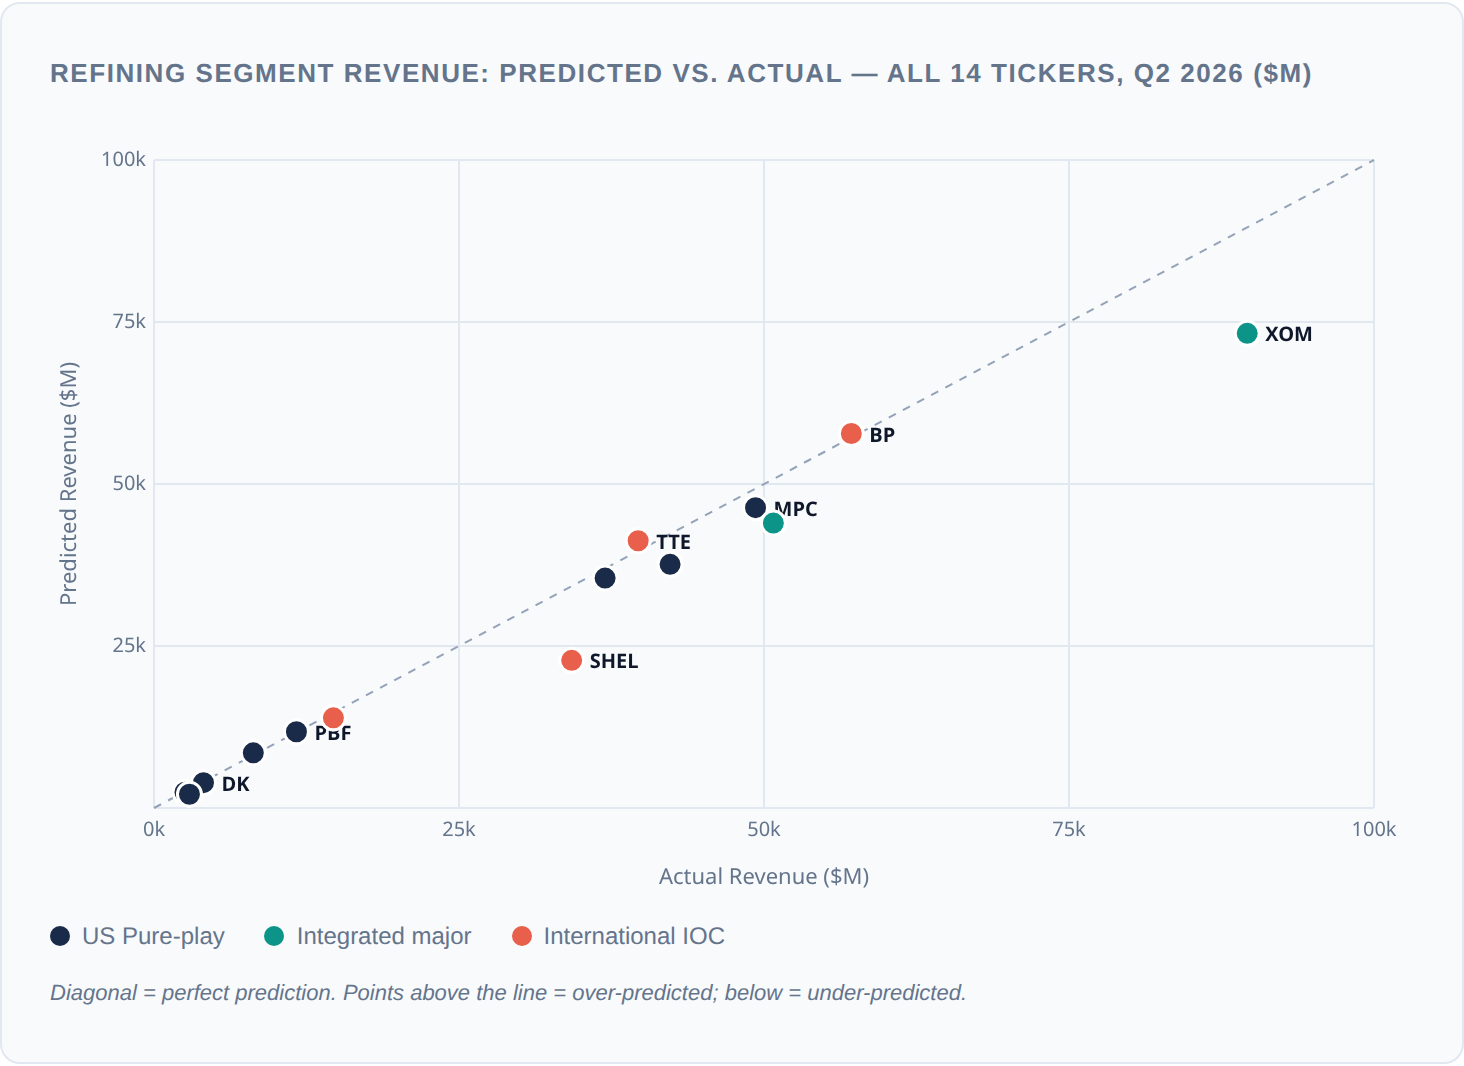
Revenue: predicted vs. actual — all 14 tickers
Refining Segment Revenue: Predicted vs. Actual — All 14 Tickers, Q2 2026 ($M).
KPI summary
Where the signal is cleanest
US refining pure-plays — companies whose reported revenue is almost entirely refining segment revenue — provide the cleanest test of our model.
Called before the print
Q2 2026 saw some of the largest QoQ swings in recent quarters, driven by sharp oil price volatility and a broad crack spread recovery from Q1 lows. When earnings surprises are amplified by macro moves, forecasting error tends to widen. Ours did not.
Across revenue, throughput, and margins — the calls held up precisely where the moves were largest.
Beyond US borders
Our model covers integrated majors and European independents — the same methodology, applied to refineries in Europe, Asia-Pacific, and the Middle East.
Our international coverage spans BP, Shell, TotalEnergies, and Repsol — four of the world's largest publicly traded refinery operators. For integrated majors, we model the refining segment specifically and publish a scope percentage alongside each prediction so customers can properly contextualize the signal.
For example, Repsol (REP) reports in euros. Currency conversion is handled natively — no accuracy is sacrificed at the currency boundary.
Margin predictions: we got the direction right 7 of 8 times
Q2 2026 marked the first live scoring of our gross margin predictions. The first iteration held up well: 87.5% directional accuracy on one of the hardest metrics in refinery forecasting.
Gross refining margins compressed and recovered sharply across the fleet in Q2 — VLO margins up 58%, MPC up 105%, DINO up 161%. Our model captured the direction of 7 of 8 covered tickers. We consider this a strong first step on a path of continual improvement and have decided to include this feature in our beta release later this year.
We have already identified new features and ensemble methods that improve margin prediction accuracy further. Gross margin predictions will be included in our Q3 2026 beta release — the first time this signal is available externally.
Not a one-quarter story
Our backtested predictions cover 12 consecutive quarters from Q3 2023 through Q2 2026 — different refining margin environments, crude price regimes, and post-COVID demand curves. Accuracy has improved consistently as the model has matured.
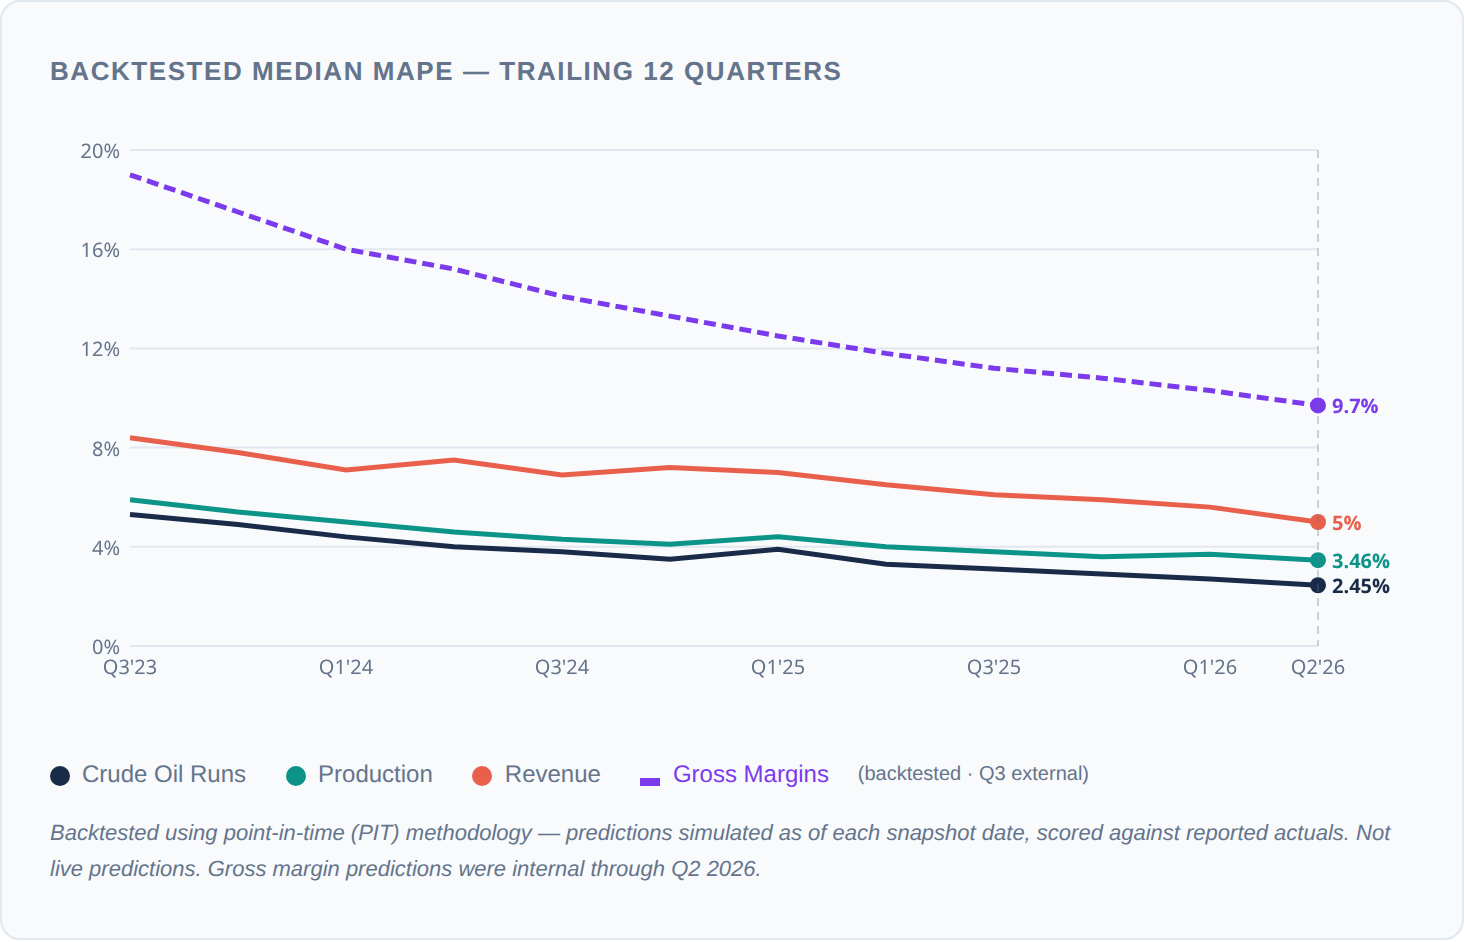
Backtested accuracy improved from ~5.3% median runs MAPE in Q3 2023 to 2.45% in Q2 2026 — a 54% reduction in error over 12 quarters. Revenue MAPE has followed the same trajectory, declining from 8.4% to 5.0%.
Gross margins tell a similar story — and the starting point matters for context. Margin is the most compositionally complex KPI we model: it is a function of throughput, product mix, crack spreads, and regional pricing dynamics, each carrying its own uncertainty. Backtested MAPE opened near 19% and has declined to 9.7% over 12 quarters — a 49% reduction that mirrors the improvement rate of our more established signals. We expect the trajectory to continue as we incorporate new features identified during Q2 validation. The pattern holds across every metric: as the model accumulates data and refines its signals, it consistently gets better.
What beta customers get
We are opening beta access ahead of our full launch. Here is exactly what the product delivers on day one.
Predicted KPIs — Updated Daily
- 🛢 Crude Oil Runs: Primary throughput — crude processed per day, per quarter, by refiner.
- ⚗️ Production Volume: Finished-product barrels produced and sold, aligned to company reporting.
- 💵 Refinery Revenue: Segment revenue in reporting currency, with FX conversion at prediction date.
- 📊 Gross Margins: Per-barrel crack spread aligned to company reporting. Included in beta release
Coverage
Launch coverage includes 20 publicly traded refiners across US pure-plays, integrated majors, and European IOCs. Historical predictions are available from Q1 2021 forward. Coverage expands with customer demand — tickers can be added on request.
Full scorecard: All tickers, all KPIs
Every prediction scored against reported actuals. Guidance shown where disclosed. Revenue in reporting currency ($M or €M). Reported actuals sourced from company earnings releases filed with the SEC (Form 8-K) and investor relations pages; international filings from company IR sites and LSE regulatory news.

See why the most successful traders and shipping experts use Kpler