Disrupted LNG supply to continue supporting European and Asian price benchmarks into next week
Severe disruptions to Qatari and UAE LNG supply persisted over the last week as the US and Israel continued military strikes on Iran and Iran retaliated on other countries in the region. Global LNG and natural gas prices remain elevated as uncertainty grows surrounding the duration of the current conflict and its possible aftermath.
Market & Trading Calls
European TTF front-month price outlook: Bullish, as the Middle East conflict keeps global LNG supply disrupted, intensifying competition for LNG from the Atlantic Basin. In addition, a drop in temperatures in NWE will support TTF prices into next week. However, geopolitical developments and changing weather forecasts present both upside and downside risks to this outlook.
Asian LNG front-month price outlook: Bullish, as South Asian buyers seek replacement cargoes in the spot market, supporting near-term prices amid tightening global supply and the upcoming May contract rollover. Falling LNG inventories in China, expected to drop below the five-year average, could trigger restocking demand and add further upside to May-June spot prices.
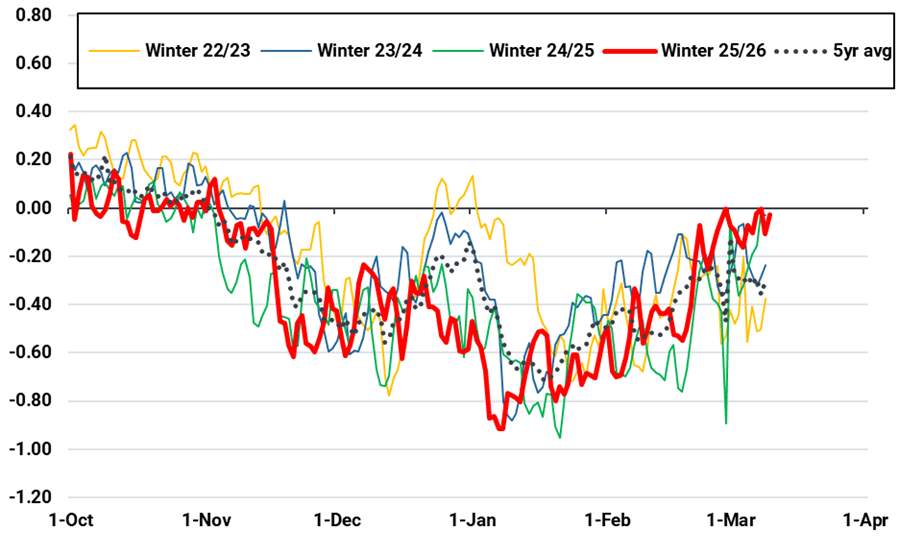
Asian LNG – TTF spread outlook: to widen, as Asian LNG prices roll over into significantly higher May prices, with the increase outweighing expected gains in TTF prices, and effectively inverting the trend from the last few days. The TTF premium widened to $0.99/MMBtu on 12 March, lower than $1.54/MMBtu on 4 March.
US Henry Hub front-month price outlook: Stable as weak mid-term fundamentals offset below-average temperatures in the eastern US, geopolitical risk, and volatile oil prices.
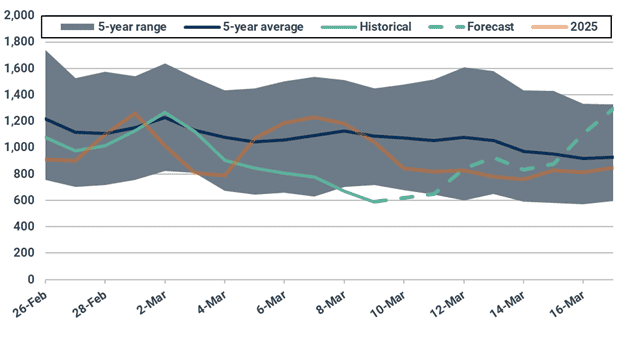
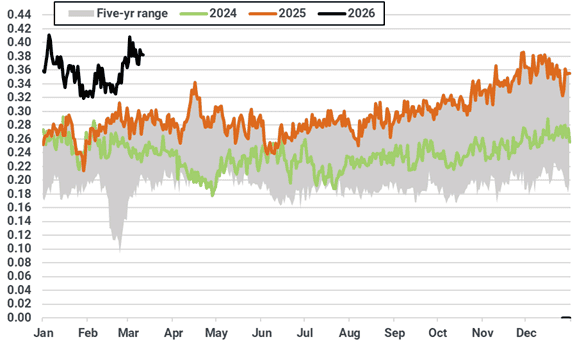
Key natural gas and LNG front-month prices ($/MMBtu)
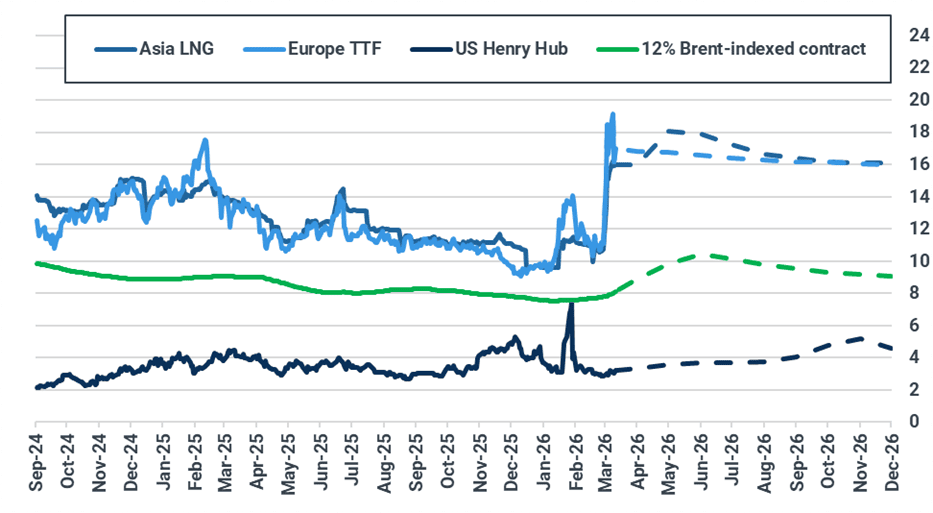
Source: ICE, NYMEX. Brent-indexed price represents 12% slope of 90-day moving average of Brent contract.
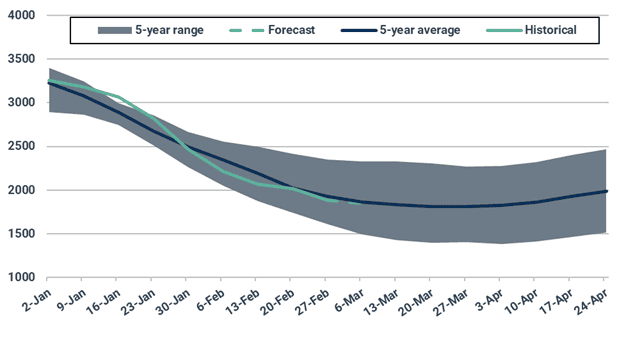
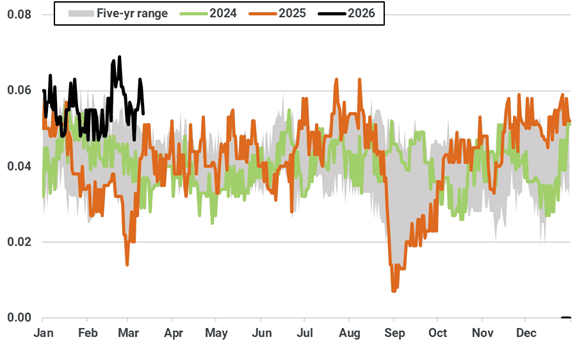
Asian LNG-TTF front-month spread ($/MMBtu)
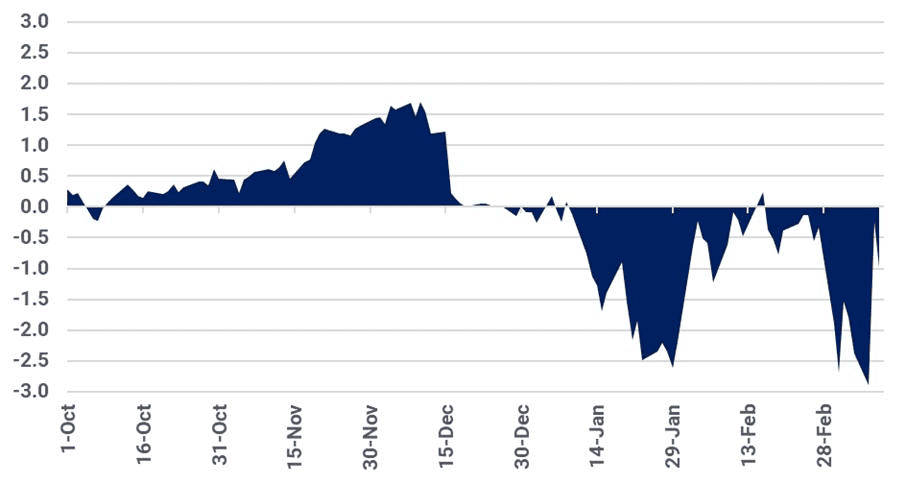
Source: ICE, Kpler Insight
Europe: Colder temperatures and disrupted global LNG supply to keep TTF prices well supported into next week
The European TTF front-month contract rose to $17/MMBtu on 11 March, up 2% from $16.7/MMBtu on 4 March. Prices rallied through Monday, surpassing $19/MMBtu, as the Middle East conflict showed no signs of early resolution, which continues to disrupt 20% of global LNG supply. The main European price benchmark fell 15% on Tuesday after the U.S. government indicated that the war was close to ending; however, the sentiment was short-lived, as attacks persisted across the Middle East. Additionally, lower pipeline and LNG supply, along with a significant decrease in wind speeds, supported prices in recent days. Finally, the latest weather forecasts indicate much colder temperatures than previously expected in NWE and parts of SEE which further boosted bullish sentiment.
Looking ahead, Kpler Insight maintains a bullish outlook on the TTF front-month contract for next week. This is primarily due to the unlikelihood that traffic through the Strait of Hormuz will restart this week, as attacks in the region are now spreading to energy infrastructure. This will likely extend disruptions to global LNG supply and increase competition with Asia for uncommitted cargoes. Additionally, below-average temperatures are forecast across NWE, including the UK, along with reduced LNG imports, which will further tighten the continental balance. However, geopolitical developments and changing weather forecasts present both upside and downside risks.
On the supply side, EU net pipeline imports fell w/w and to an estimated 2.7 bcm (-4% w/w). The decline resulted from lower Norwegian exports to the EU, as the UK increased its imports to offset a significant drop in wind speeds that outweighed increased flows via the Turkstream pipeline. Looking ahead, Kpler Insight expects net pipeline imports to remain stable next week, as an anticipated fall in UK temperatures will continue weighing on Norwegian flows to the continent and imports via the UK.
Daily Norwegian pipeline exports to the UK (bcm)
Source: Kpler European Gas, Kpler Insight.
European LNG imports fell to 2.8 mt (-14% w/w), mostly driven by lower UK and Turkish imports, which follow their typical seasonal trend, and increased competition with Asia and Egypt for uncommitted cargoes. As of the publication of this report, Kpler has confirmed 11 diversions to Asia and another two to Egypt.
Looking into next week, Kpler Insight expects LNG imports to decrease due to a stronger pull of Atlantic supply from Asia. However, a potential change in weather forecasts indicating sustained lower temperatures in Europe during the second half of March could support TTF prices and attract additional LNG supply into the continent.
European weekly LNG imports by region (mt)
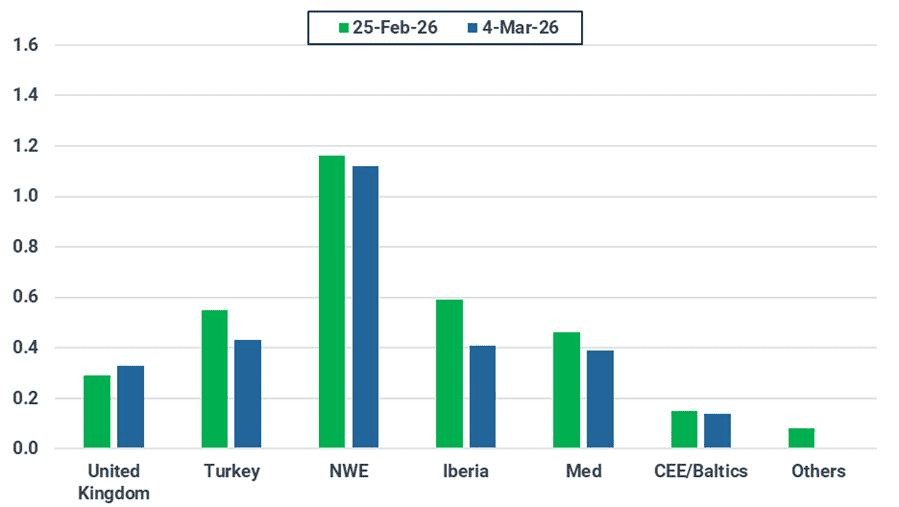
Source: Kpler Insight. Data represents week commencing 18/02 and 25/02. NWE=FR, BEL, NL, GER. Iberia=ESP, POR. Med=ITA, HVR, GRE. Baltics/CEE=FI, LT, POL. Others=SWE, MT.
On the demand side, aggregate local distribution demand across 16 EU countries declined by 6.2% w/w to an estimated 3.3 bcm. The decrease resulted from diverging temperature patterns across the continent, with higher-than-average temperatures behind the reduced gas usage for heating in NWE and Central Europe more than offsetting the colder temperatures in Italy and Iberia. For next week, Kpler Insight expects local distribution demand to increase, as temperatures are forecast to fall in most of Europe.
EU-16 weekly consumption in the local distribution sector (bcm)
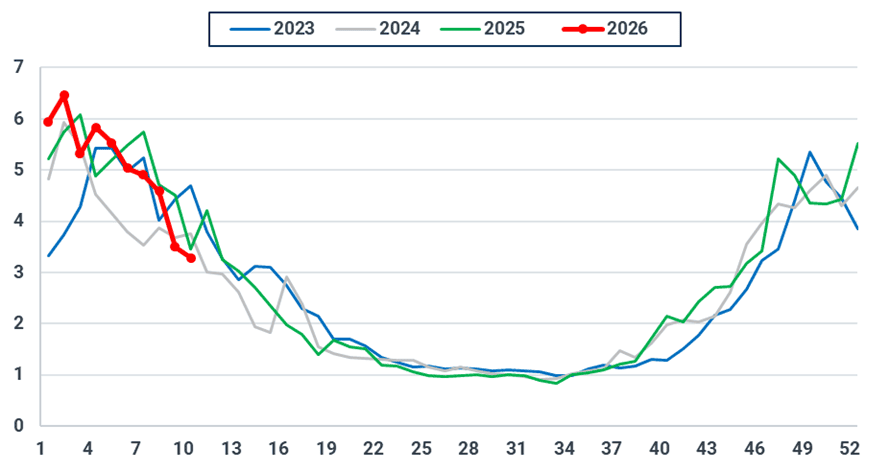
Source: ENTSOG, ENAGAS, Eustream, AGCM, Kpler Insight. The EU-16 perimeter includes AT, BE, DE, CZ, FR, HU, GR, IT, NL, LU, PL, PT, RO, SL, SK, and ES.
On the power side, EU-25 gas-fired generation saw its first w/w increase since January, rising to 7.4 TWh (4% w/w), despite a 3% decrease in overall power demand and higher TTF prices. The rise in gas-fired generation was caused mainly by a deep decline in wind generation w/w, particularly in NWE and SE. Looking ahead, we anticipate gas-fired generation to increase slightly as higher power demand from lower temperatures will only partly offset by stronger solar and an expected gradual recovery in wind speeds in parts of Europe.
EU-25 weekly gas-fired generation (TWh)
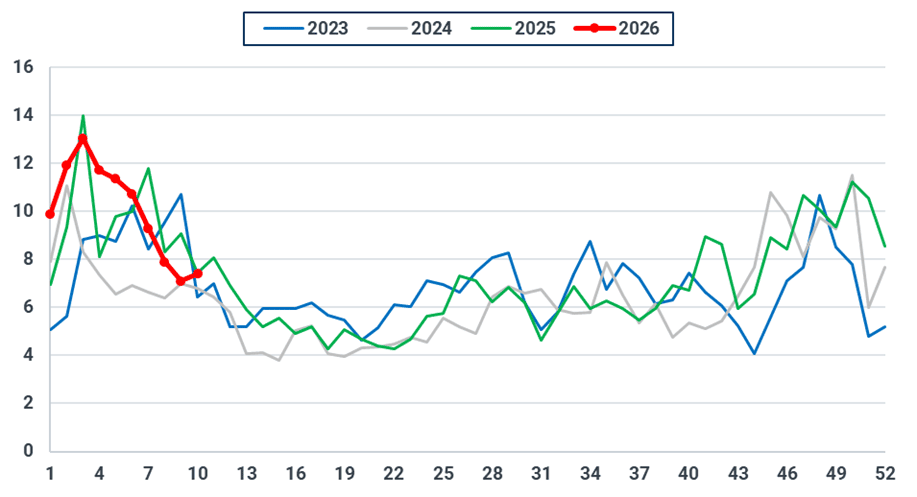
Source: Kpler Power, Kpler Insight.
Average forecast temperatures for NWE, excluding the UK (°C)
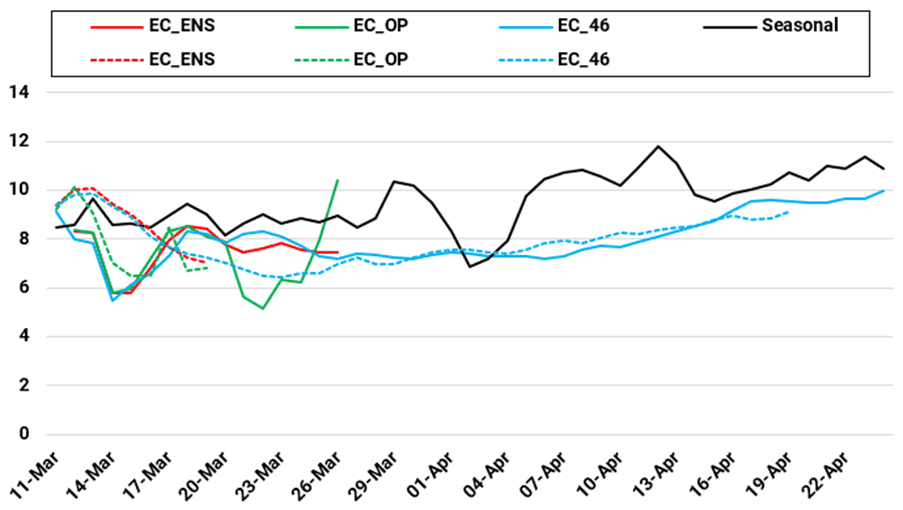
Source: Kpler Insight. Run comparison 12/03 (solid) vs. 05/03 (dotted), 00:00 UTC. Seasonal is a five-year average. NWE includes BE, NL, FR, DE
EU-27 underground gas stocks declined to 29.3% full as of 10 March, down only 0.48 percentage point w/w. Looking ahead, the anticipated drop in temperatures in the latest weather forecasts should likely increase the pace of withdrawals, particularly given our expectation of a decline in LNG imports into the continent.
EU-27 daily UGS change (bcm)
Source: GIE, Kpler Insight. Latest data as of 10/03/26.
Asia: Active South Asian spot buying and contract rollover keep Asian LNG prices bullish
Asian LNG prices rose by $0.88/MMBtu week on week to $15.98/MMBtu on 11 March from $15.11/MMBtu, driven by high geopolitical risk premiums over Hormuz and on-going Qatari supply disruptions.
Asian LNG prices are likely to remain bullish in the week ahead, supported by strong South Asian replacement demand, and May contract rollover under tight supply. Indian, Bangladesh and Pakistan buyers became active in the spot market, driving firm price upside and outweighing the muted spot activity in Northeast Asia with storage buffer. With widening inter-basis arbitrage, multiple Atlantic cargoes have been diverted to Asia and more such diversions are expected.
Into next week, temperatures across North and East China are forecast to track below seasonal norms, slightly boosting heating-related gas demand. South Asia is expected to see below-average temperatures, lowering cooling-related gas demand. Overall, the temperature profile points to stable weather-driven demand w/w, with a neutral impact to prices.
Forecasted average temperatures for Asian countries (°C)
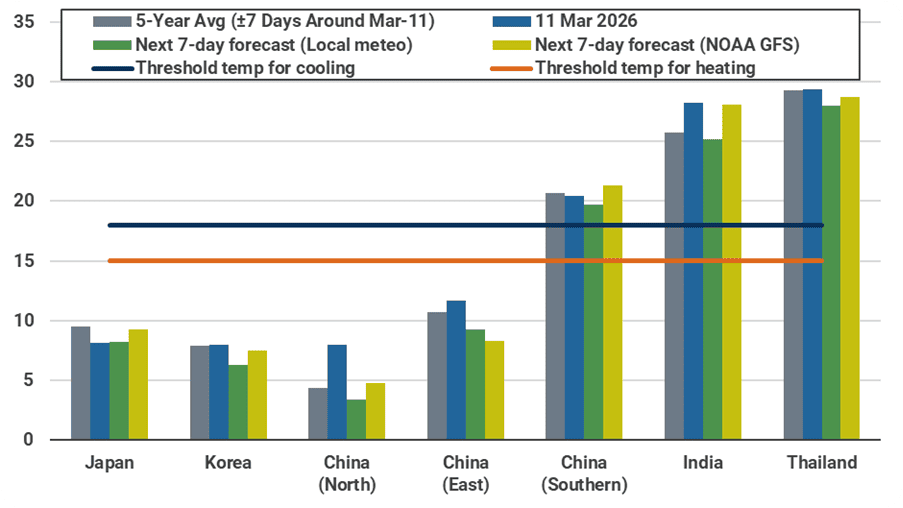
Source: Meteostat, Kpler Insight. As of 12 March 2026 00:00:00 UTC. Population-weighted average temperature of selected major cities across a country is shown for both historical and forecast.
Japan’s major utility LNG inventories edged down 0.07 mt w/w to 2.12 mt as of 8 March, in line with seasonal drawdown trends. Japan’s implied total LNG inventories are projected to decline from 4.4 mt at end-February to around 4.2 mt by end-March, before recovering slightly to about 4.3 mt by end-April. Healthy inventory levels are expected to mitigate short-term Hormuz-linked supply disruptions, limiting near-term spot market activity from Japanese buyers.
Japan implied total LNG inventory forecast (mt)
Source: METI, Kpler Insight
Japan available nuclear capacity by plant (GW)
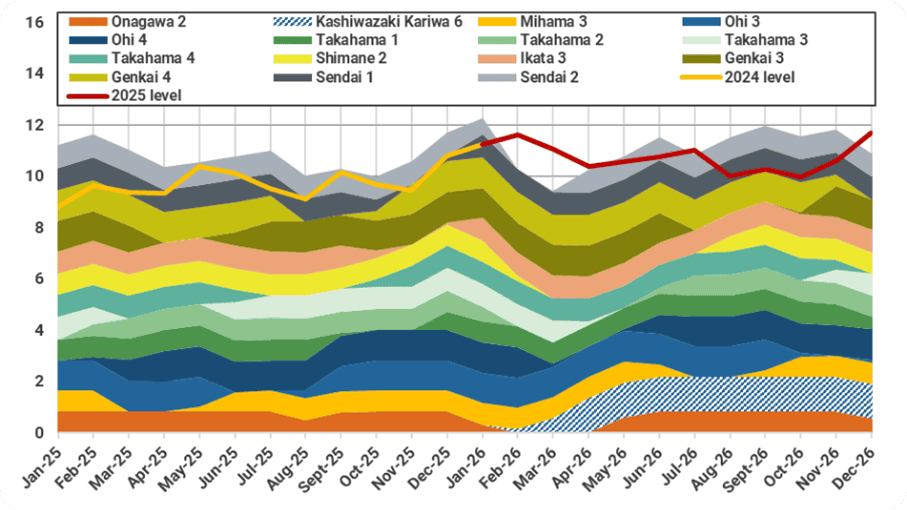
Source: HJKS, Kpler Insight. Note: Dashed area shows the assumed restart timeline and capacity availability of Kashiwazaki Kariwa 6
South Korea’s implied LNG inventories stood at 3.5 mt at end-February and are expected to rebuild only modestly to around 3.7 mt through March–April, as inventory draws cushion short-term supply disruptions. Lower coal maintenance should keep coal-fired output higher through March-April, reducing spot LNG demand for power. However, Korea’s relatively higher exposure to Qatar and UAE supply may support modest spot buying, lending slight support to near-term prices.
South Korea monthly implied LNG inventory (mt)
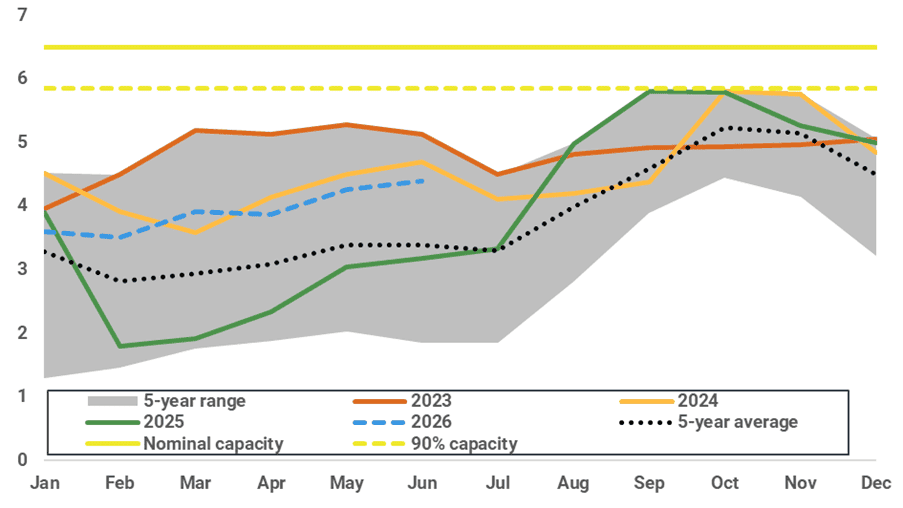
Source: Kpler Insight, KESIS
Monthly coal plant maintenance (GW) and estimated coal-fired load factor in Korea (%)
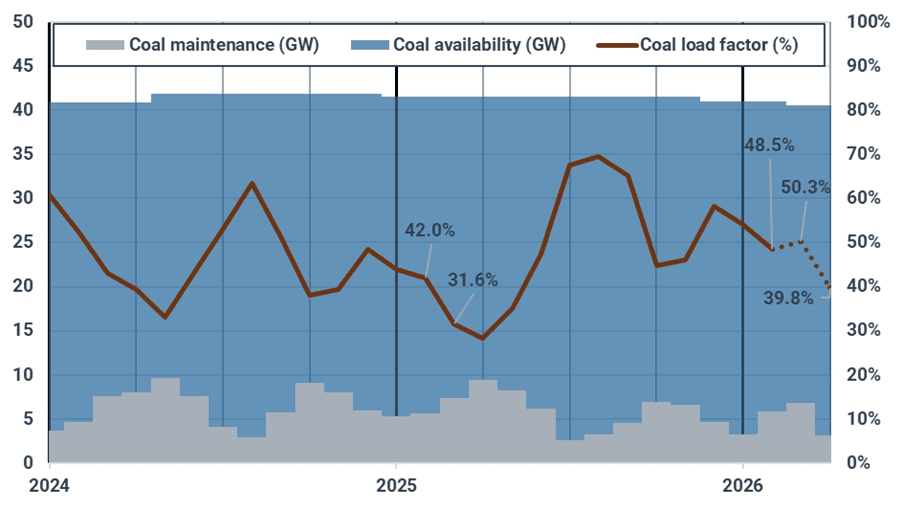
Source: KPX, Kpler Insight. Note: Latest maintenance data is as of 6 March 2026.
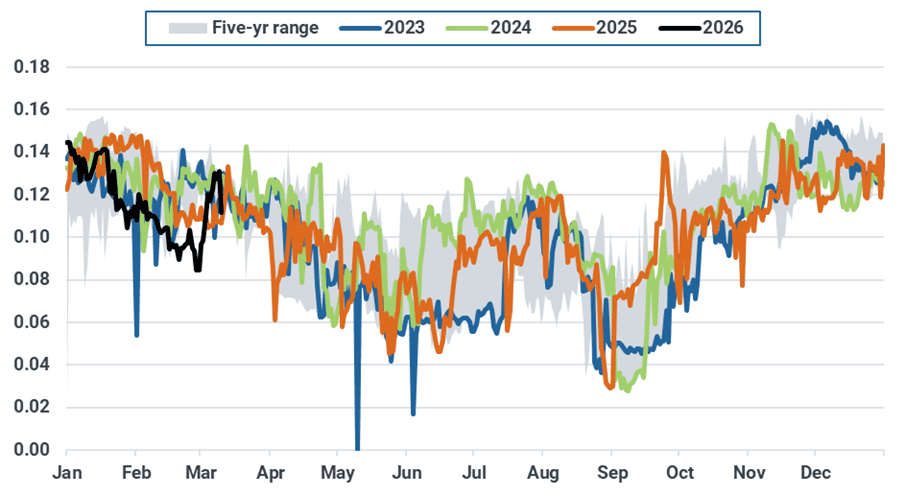
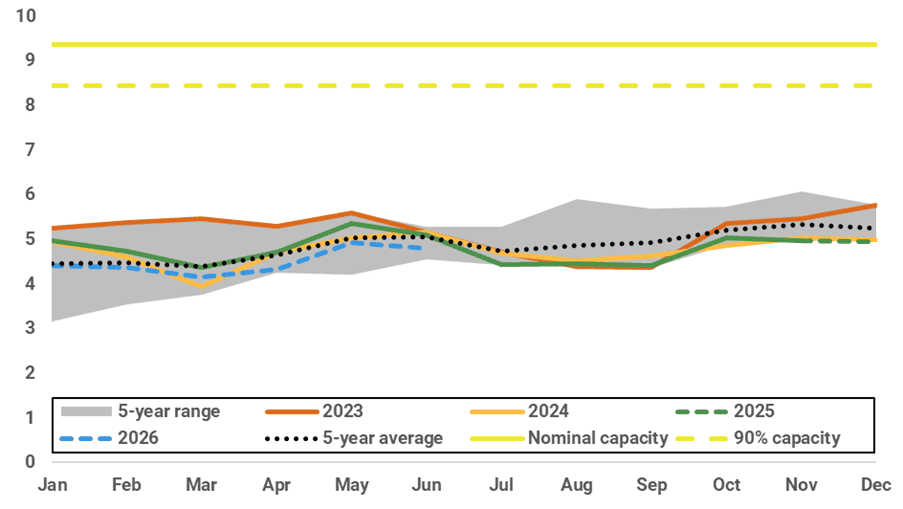
Higher Asian spot LNG prices should curb price-sensitive Chinese demand, with inventory drawdowns helping absorb initial Hormuz disruptions and near-term prices. China’s implied LNG inventories stood at 7.6 mt (53%) at end-February and are expected to fall to 7.4 mt (51%) through March–April. However, inventories are forecasted to drop below the five-year range by end-April, prompting restocking demand and supporting spot prices through May-June.
China implied LNG inventory forecast (%)
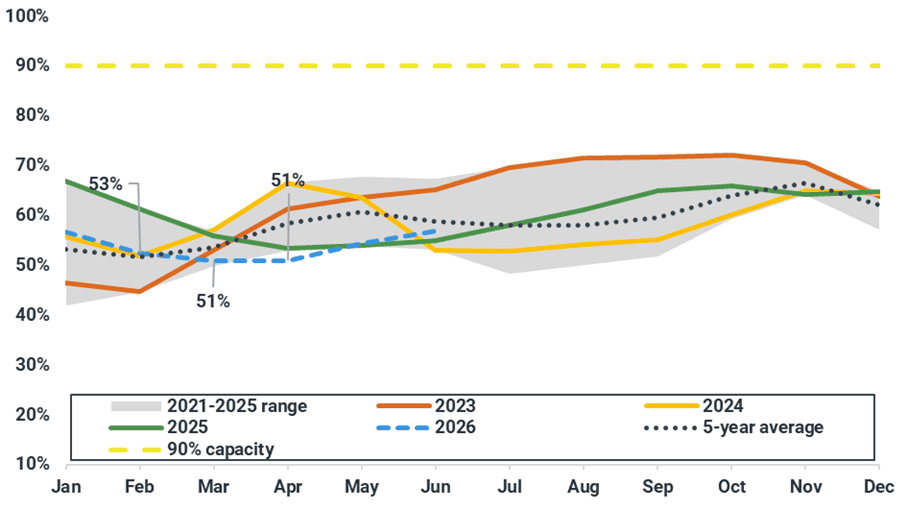
Source: Kpler Insight
China implied total LNG inventory vs terminal capacity (% of nominal capacity, mt)
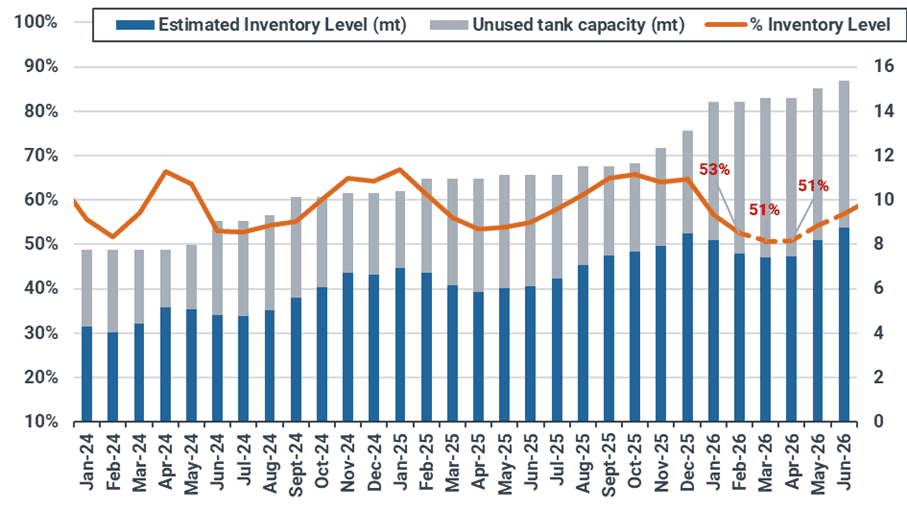
Source: Kpler Insight
South Asia remains the most structurally exposed region to disruptions in the Strait of Hormuz. With tightening regional LNG availability, price-sensitive sectors in India start to curb discretionary gas consumption, while utilities in Pakistan and Bangladesh turn to fuel oil for power generation. Despite price-induced demand curtailment, South Asian LNG buyers remain active to secure prompt-month spot cargoes to replace disrupted volumes, supporting near-term Asian spot LNG prices.
India monthly gas consumption by sector (bcm)
Source: PPAC, Kpler Insight
Southeast Asian spot procurement remains muted amid elevated LNG prices and supply uncertainty, as buyers await clearer signals on Hormuz disruption risks and price direction. In the near term, Southeast Asian countries such as Thailand and Malaysia are expected to ramp up coal-fired generation to partially displace more expensive gas-fired output, reducing near-term spot demand.
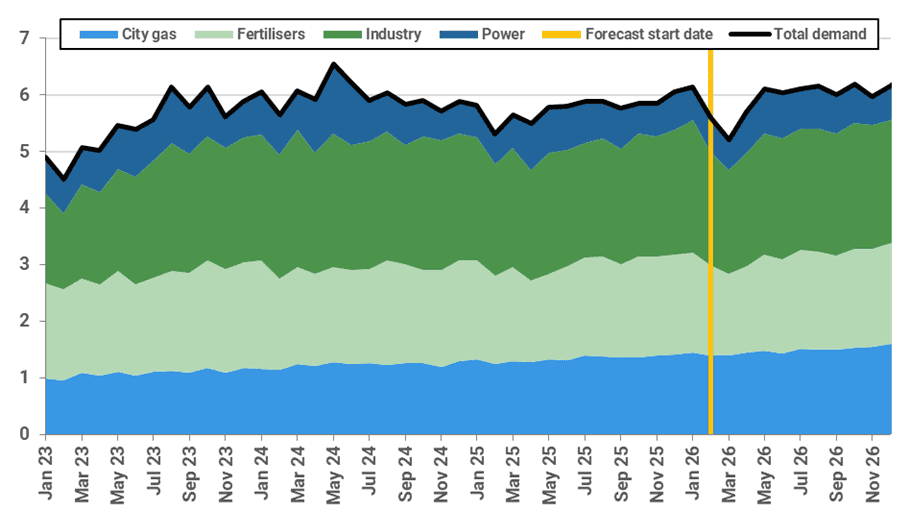
Projected year on year changes in electricity generation by fuel in Thailand (TWh)
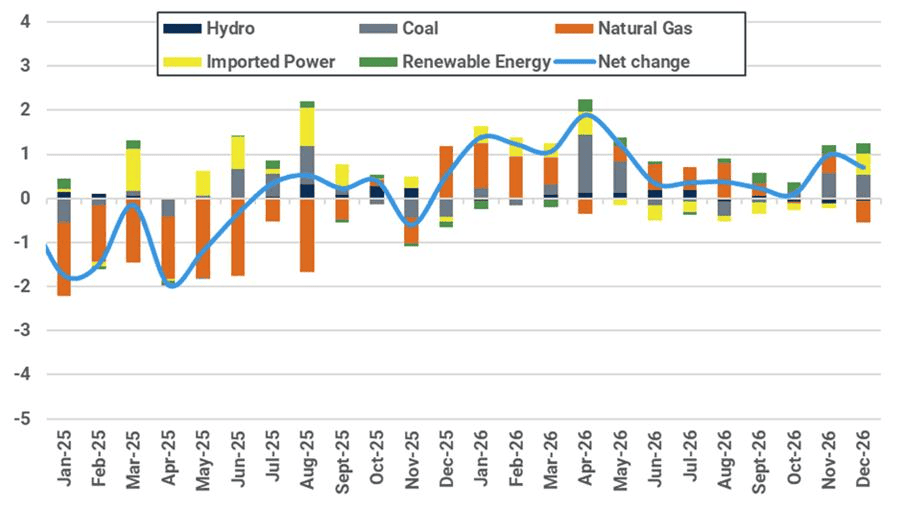
Source: EPPO, Kpler Insight. Note: Forecast data starts from January 2026.
US: Henry Hub trading proves volatile amid oil price swings and forecasts of mid-March cold
US Henry Hub front-month prices settled at $3.21/MMBtu on 11 March, up from $2.92/MMBtu on 4 March. Though the underlying structure of the gas market continues to be led by fundamentals, geopolitical risk began to have a more pronounced effect on Henry Hub front-month prices over the last week. A slightly bullish storage print for the week ending 27 February and broad geopolitical uncertainty led to Henry Hub settling at $3.19/MMBtu last Friday. Despite bearish weather model revisions over the weekend, the rapid, albeit brief, rise of international oil prices to $120/bbl on Sunday pushed US gas prices upward during early trading on Monday. Though, gas prices ultimately fell on Monday as oil prices retreated, with Henry Hub settling at $3.12/MMBtu. Tuesday saw a fairly broad sell off, which moved front-month prices down to $3.02/MMBtu. Henry Hub increased on Wednesday on an upcoming bout of cold weather in the northern US as well as climbing oil prices.
US domestic gas consumption by sector (bcf/d)
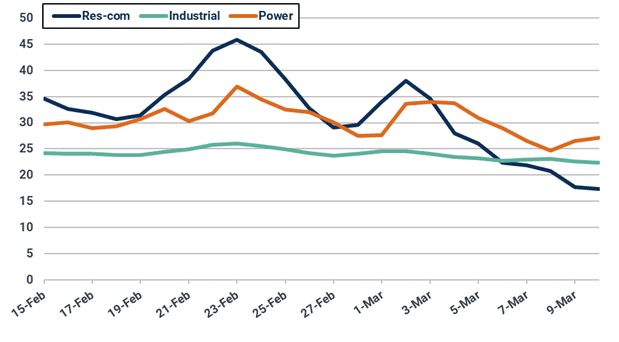
Source: EIA
Residential and commercial heating demand fell precipitously over the last week as much of the Lower 48 experienced unseasonably warm temperatures. Heating requirements dropped below 20 Bcf/d on 9 March, the lowest levels thus far in 2026. However, a cold front is forecast to impact the eastern third of the US over the next week, causing a modest resurgence of heating demand. Heating degree days are projected to reach the top end of the 5-year range, bringing gas burns back up to 40+ Bcf/d. These cooler conditions are forecast to last through the middle third of March before giving way to more Spring-like temperatures in the final days of the month.
Though near-term cold, geopolitical risk, and volatile oil prices will offer some bullish support to prices, weak medium-term fundamentals are expected to continue driving the market over the next 7 days. As a result, Kpler Insight anticipates that Henry Hub front-month prices will remain largely rangebound between $3.00-3.20/MMBtu.
Forecast of residential and commercial demand (bcf/d)
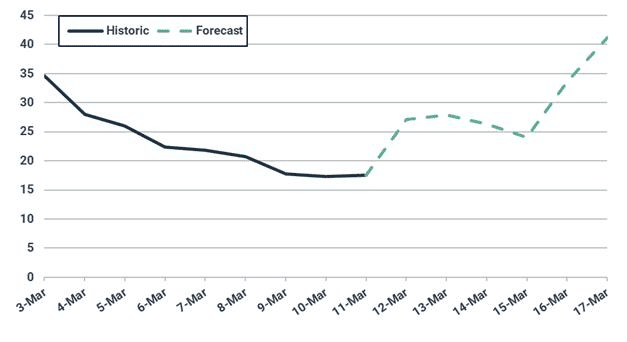
Source: National Weather Service
Forecast of heating degree days
Source: National Weather Service
US dry gas production averaged near 110 Bcf/d over the last week, rising slightly w/w despite national demand plummeting amid above-average temperatures. Kpler Insight expects supply to remain near current levels over the next week.
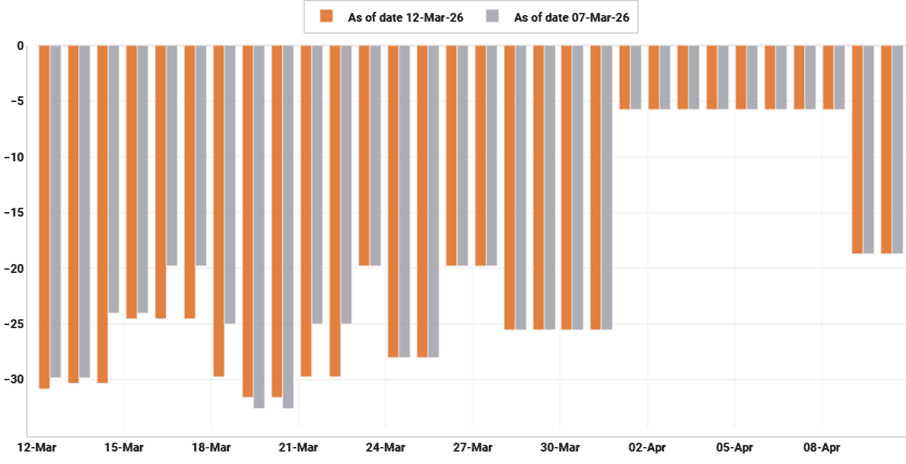
Forecast of natural gas volumes in underground storage (bcf)
Source: EIA
The US withdrew 132 Bcf for the week ending 27 February, a bullish result that came in on the higher side of consensus estimates. The pull widened the current deficit to the 5-year average from 0.3% to 2.2%. Though, inventories are widely expected to return to a surplus to average levels in the coming weeks amid rising temperatures in early March, potentially even facilitating an early net injection. Kpler Insight projects a 37 Bcf withdrawal for the week ending 6 March.
Global LNG Supply: Global exports plunge amidst continued Hormuz disruptions, Pacific Basin supply forecasted to remain somewhat resilient.
Global LNG exports dipped by 1.57 mt w/w to 8.15 mt last week, marking the lowest level seen since mid-September last year. The decline was largely driven by lower Qatari exports (-1.2 mt w/w) as the Strait of Hormuz remained close, while Peruvian exports were halted due to an outage caused by an explosion on the vital Camisea pipeline.
Global LNG exports (mt, 10-day moving average)
Source: Kpler
The impact of the Strait of Hormuz closure was fully felt last week, as vessels stopped loading at the 77 mtpa Ras Laffan and 5.8 mtpa Das Island plants. Only one vessel is currently docked at Ras Laffan, with all loadings since 27 February floating near the Ras Laffan anchorage. Currently, 0.99 mt of Qatari LNG (and 0.06 mt of UAE LNG) is trapped in the Persian Gulf. Production at the 77 mtpa Ras Laffan remains halted, with QatarEnergy issuing force majeure notices to some of its long-term LNG buyers. The Strait of Hormuz remains effectively closed, with no LNG tanker transits (ballast and laden) observed since 28 February.
Qatari exports last week dipped to just 0.33 mt (-1.2 mt w/w), with those volumes idle near the Ras Laffan anchorage. The roughly 0.87 mt of Qatari LNG that was outside the Persian Gulf before the commencement of US-Israeli military strikes is still in transit, with most of it heading to Europe. No ballast vessels are set to load at Ras Laffan, effectively making Al Rayyan the last vessel that could theoretically load LNG there. Once this vessel loads, Kpler Insight does not forecast any additional loadings for the week ahead in Qatar. No volumes are expected out of the UAE either, with the last load at Das Island dated 3 March.
Qatar LNG exports (mt, 10-day moving average)
Source: Kpler
In Oman, however, the Marvel Pelican loaded at the 11.4 mtpa Qalhat plant on 10 March and is now heading east towards Asia. Another vessel, the Cool Runner, is expected to dock at the plant on 13 March. Omani exports last week reached 0.29 mt (4 cargoes), which corresponded to a usual loading schedule. While Omani LNG loadings have thus far continued unabated, recent attacks by Iran could disrupt operations.
Elsewhere in the Atlantic Basin, US LNG exports fell by 0.27 mt w/w to 2.52 mt, mainly due to a dip in Sabine Pass exports. An unplanned outage at Freeport (due to an issue at an upstream pretreatment facility) disrupted feedgas flows for three days, but has since been alleviated. With nearly every US liquefaction facility running at capacity, relatively robust exports from the US are expected for the week ahead.
US LNG exports (mt, 10-day moving average)
Source: Kpler
US diversions continued last week, with a total of five cargoes diverted away from Europe towards Asia, or approximately one day’s worth of US exports. This reflects the continued pull from the Pacific Basin for Atlantic cargoes. All diversions are visible here.
Nigerian exports continued performing well, reaching 0.42 mt (+0.07 mt w/w). Most volumes were now heading to Asia, with four Nigerian cargoes diverted to Asia since the start of the conflict in the Middle East.
Bonny LNG exports (mt, 10-day moving average)
Source: Kpler
In the Pacific Basin, Malaysian exports fell by -0.19 mt to 0.42 mt due to lower output from the Bintulu complex. The lineup for the week ahead was looking strong however, with exports set to reach ~0.6-0.7 mt.
Malaysia LNG exports (mt, 10-day moving average)
Source: Kpler
Australian exports fell to 1.48 mt (-0.34 mt w/w), amidst lower output from the NWS, Pluto and Prelude plants. No cargoes loaded at the 3.7 mtpa Darwin plant last week, but the Bishu Maru was set to arrive there on 15 March, supporting Australian exports for the week ahead.
Canada continued its usual loading schedule of 2-4 cargoes per week, having exported 0.22 mt last week. Kpler Insight expects this trend to continue going forwards.
Lastly, Peru has not exported any cargoes since 25 February after an explosion occurred on the Camisea pipeline. No ballast vessels were idling close by, indicating that no imminent restart was expected. We do not forecast any Peruvian exports for the next few days.
Peru LNG exports (mt, 10-day moving average)
Source: Kpler
Market insights you can actually trust
Kpler delivers unbiased, expert-driven intelligence that helps you to track critical LNG market developments for your own analysis. Our precise forecasting empowers smarter trading and risk management decisions. In times of conflict and geopolitical uncertainty, our real-time data keeps you ahead of supply disruptions and price volatility.
Unbiased. Data-driven. Essential. Request access to Kpler today.

See why the most successful traders and shipping experts use Kpler
.png)