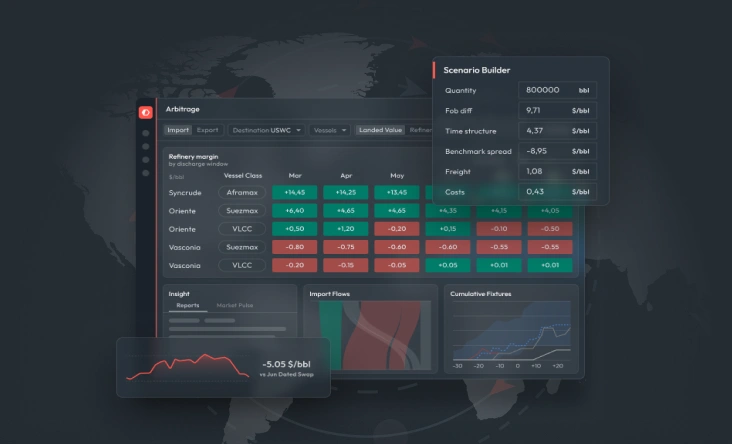
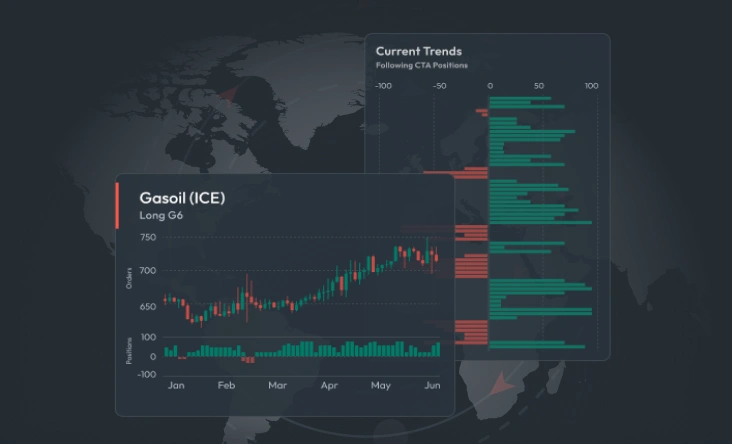
Real-time value comparison, refining margins & route profitability


.webp)


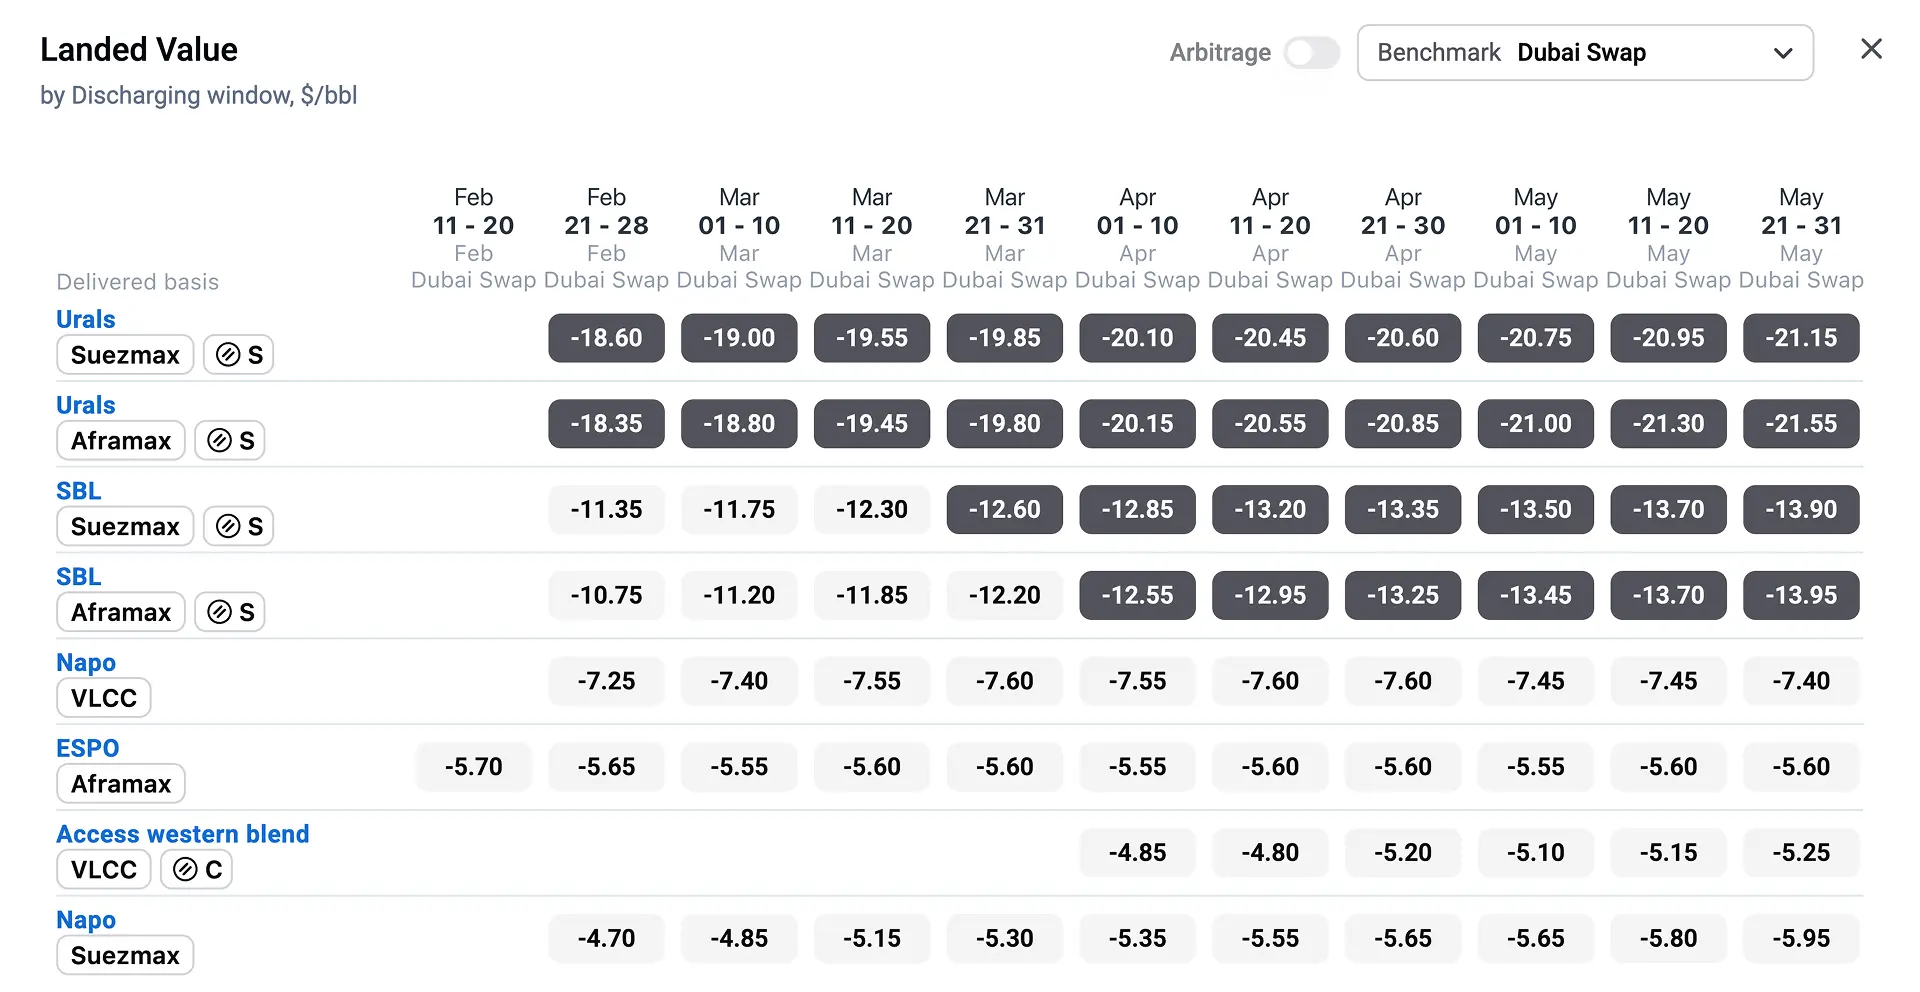
Pinpoint the most profitable crude routes by comparing delivered values across regions, factoring in freight, quality, and pricing.
- Split by origin/destination, grades, matrix granularity (5 day, 10 day, or monthly), vessel classifications, refinery type
- Greyscale cells update every 30 minutes
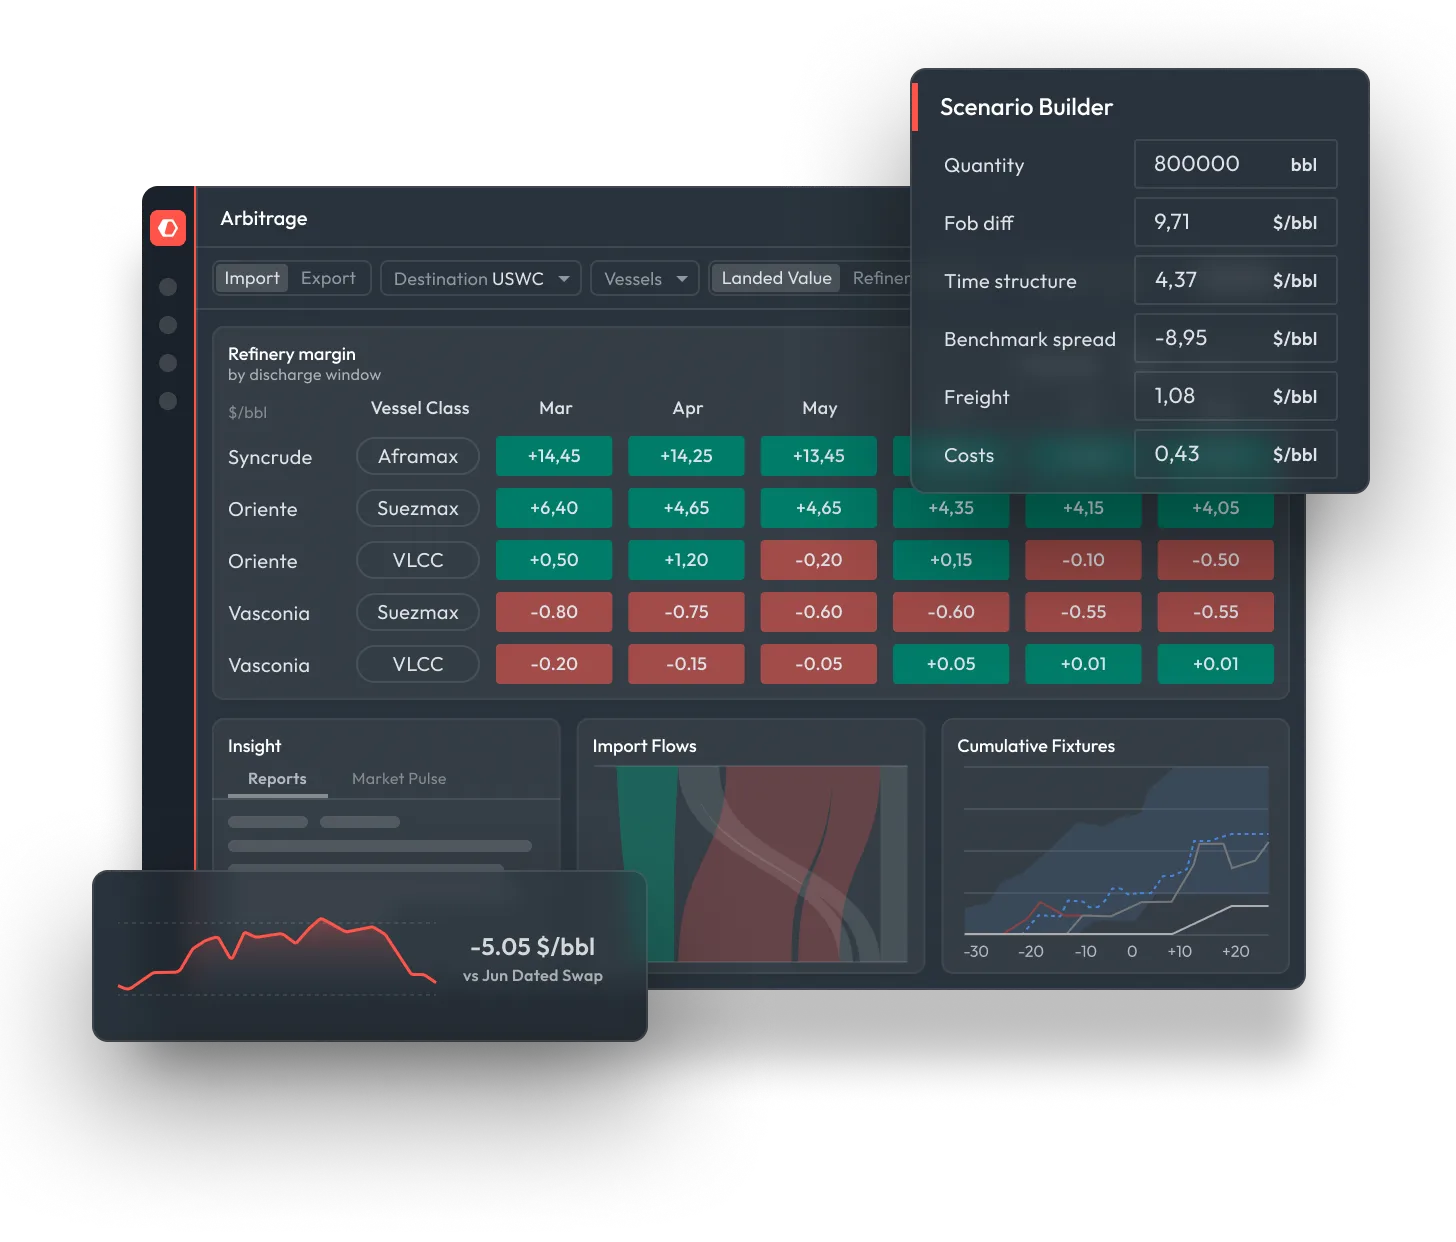
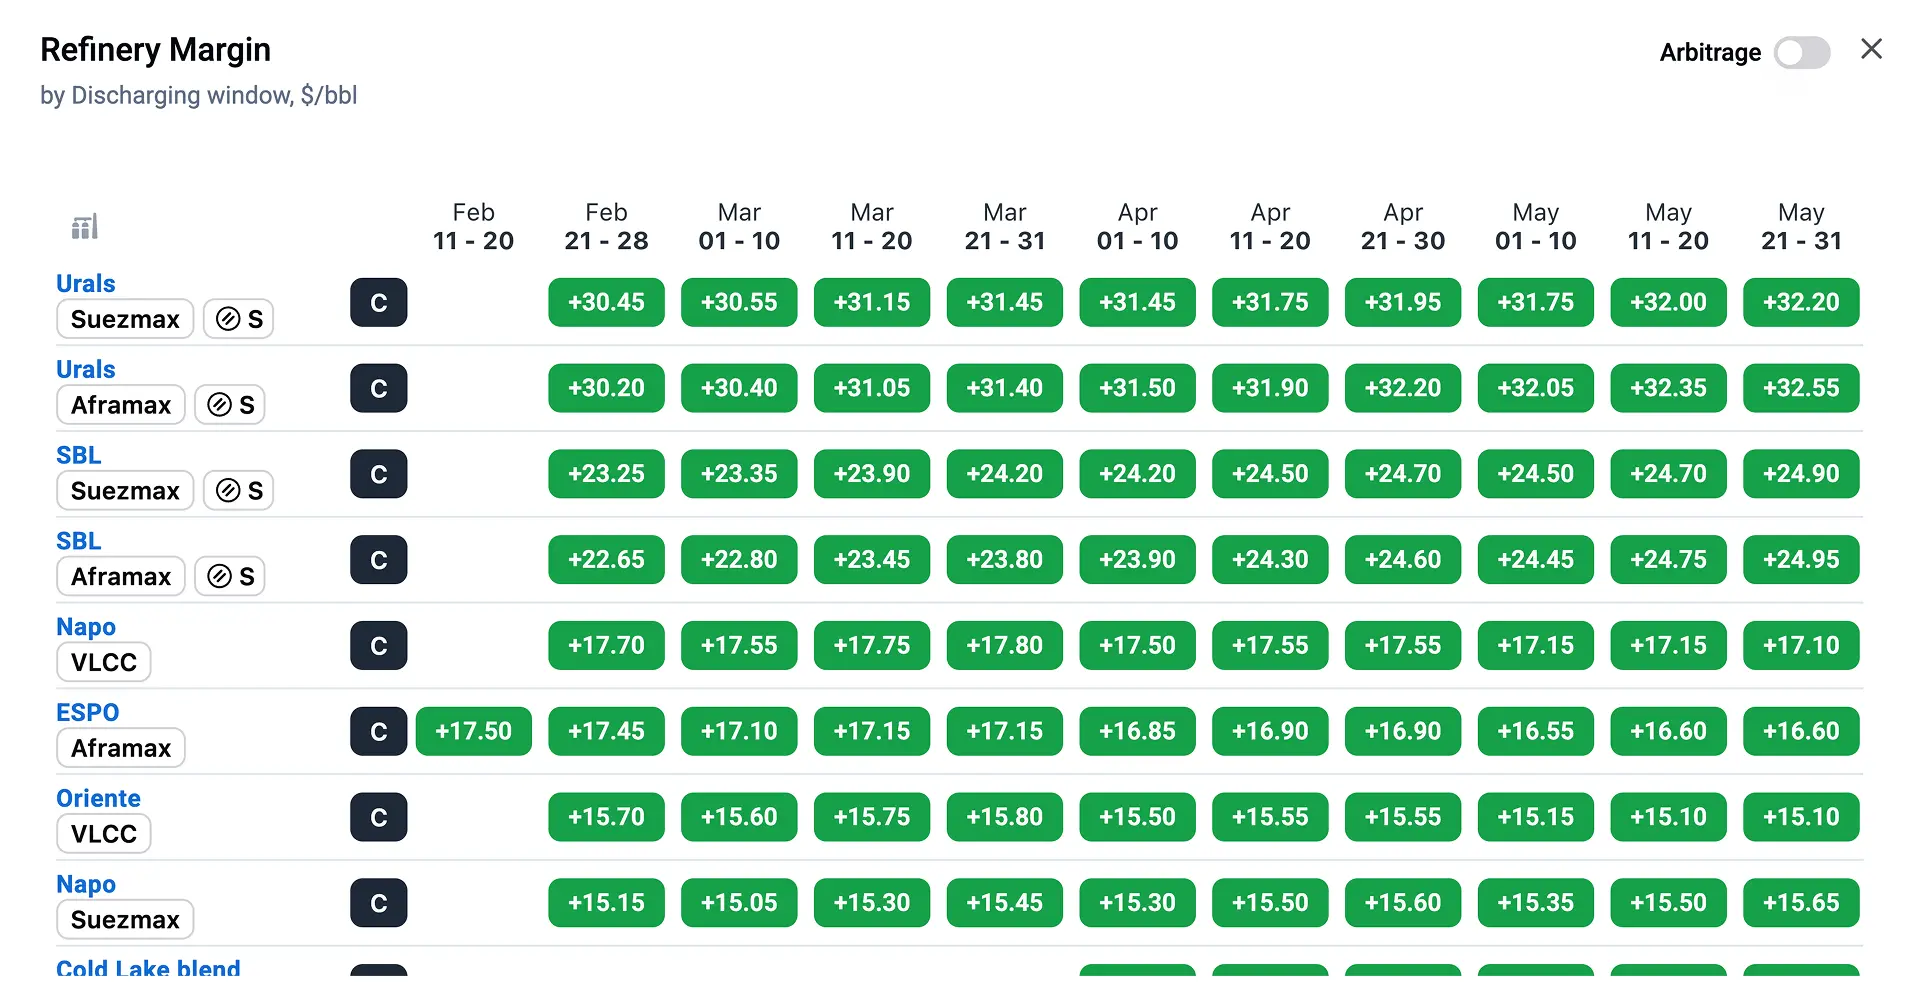
Instantly gauge refinery profitability by tracking crude costs versus refined product values across global markets.
- The matrix displays refining margins by crude, refinery type, route, vessel type, and voyage time
- The refining margin view is the profit lens: how much money can a refiner make running this crude?
- It shows the absolute profit potential of each crude for a refinery type
- The landed value doesn’t take crude quality into consideration - the refinery margin does
- This view is useful for ranking crude grades for a refinery
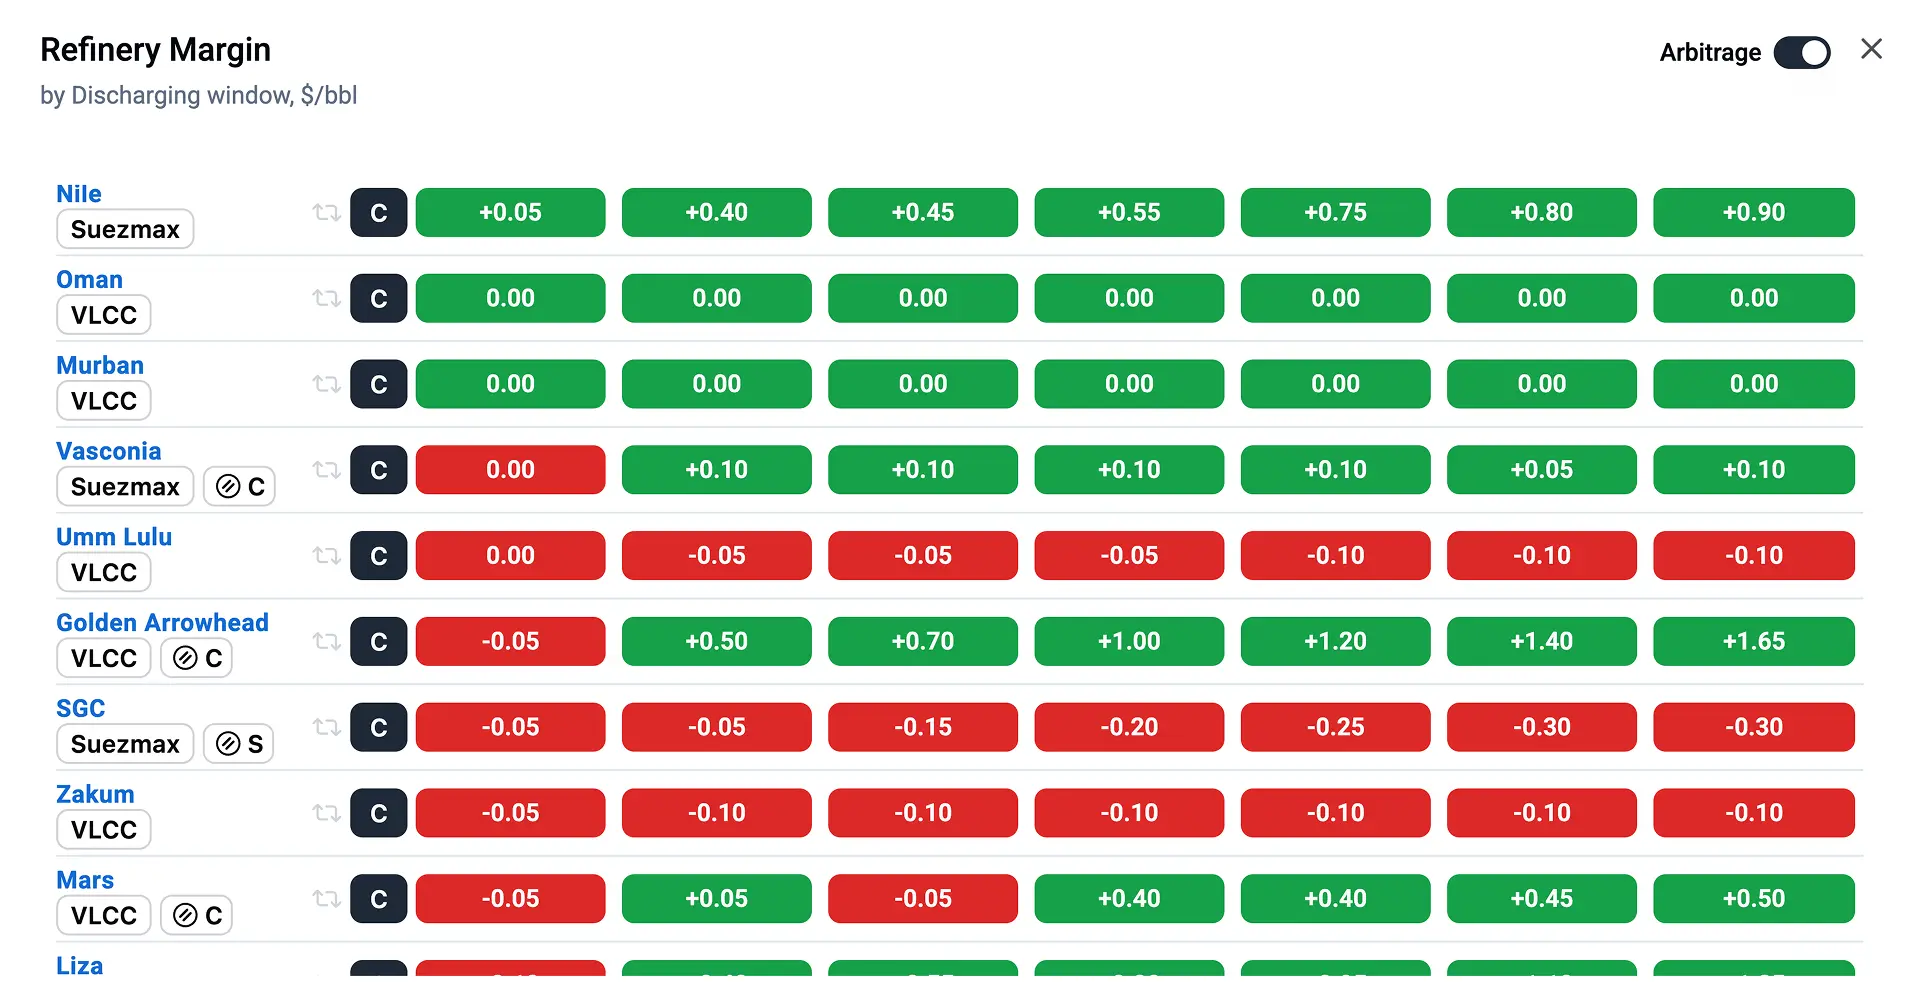
Spot real-time price gaps between markets to uncover high-value trading and reallocation opportunities.
- Shows whether an imported crude delivers higher profitability than the local reference grade — the ultimate “is it worth switching?” test
- Distills complex economics into a simple red/green signal, saving hours of manual diff and margin comparisons
- Highlights incremental gains or losses versus local supply, so refiners and traders can act quickly on open arbs or avoid loss-making moves
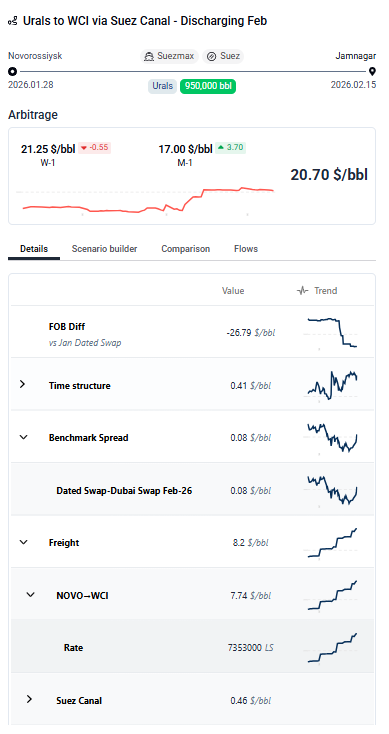
See exactly what drives landed value with a full breakdown of freight, quality, and pricing components.
- Displays the component and subcomponent values for:
- FOB diff
- Time structure
- Benchmark spread
- Freight
- Costs
- See clearly why a landed value, refining margin, or arbitrage value has changed by interrogating the component values
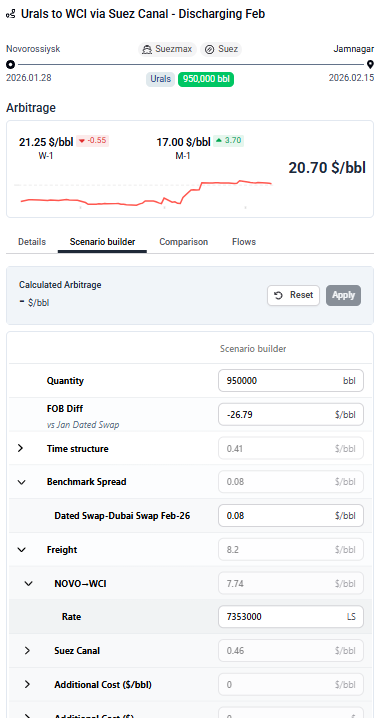
The Scenario builder is an interactive tool that helps traders, analysts, and risk managers test, compare, and visualise arbitrage opportunities in dynamic market conditions.
- Custom assumptions: Adjust inputs such as freight rates, duties, and pricing basis to reflect the specific market environment you want to test
- Scenario modelling: Evaluate how a particular set of conditions impacts arbitrage economics
- Sensitivity exploration: Quickly see how changing a single assumption (e.g., freight or duty) shifts the outcome of a trade
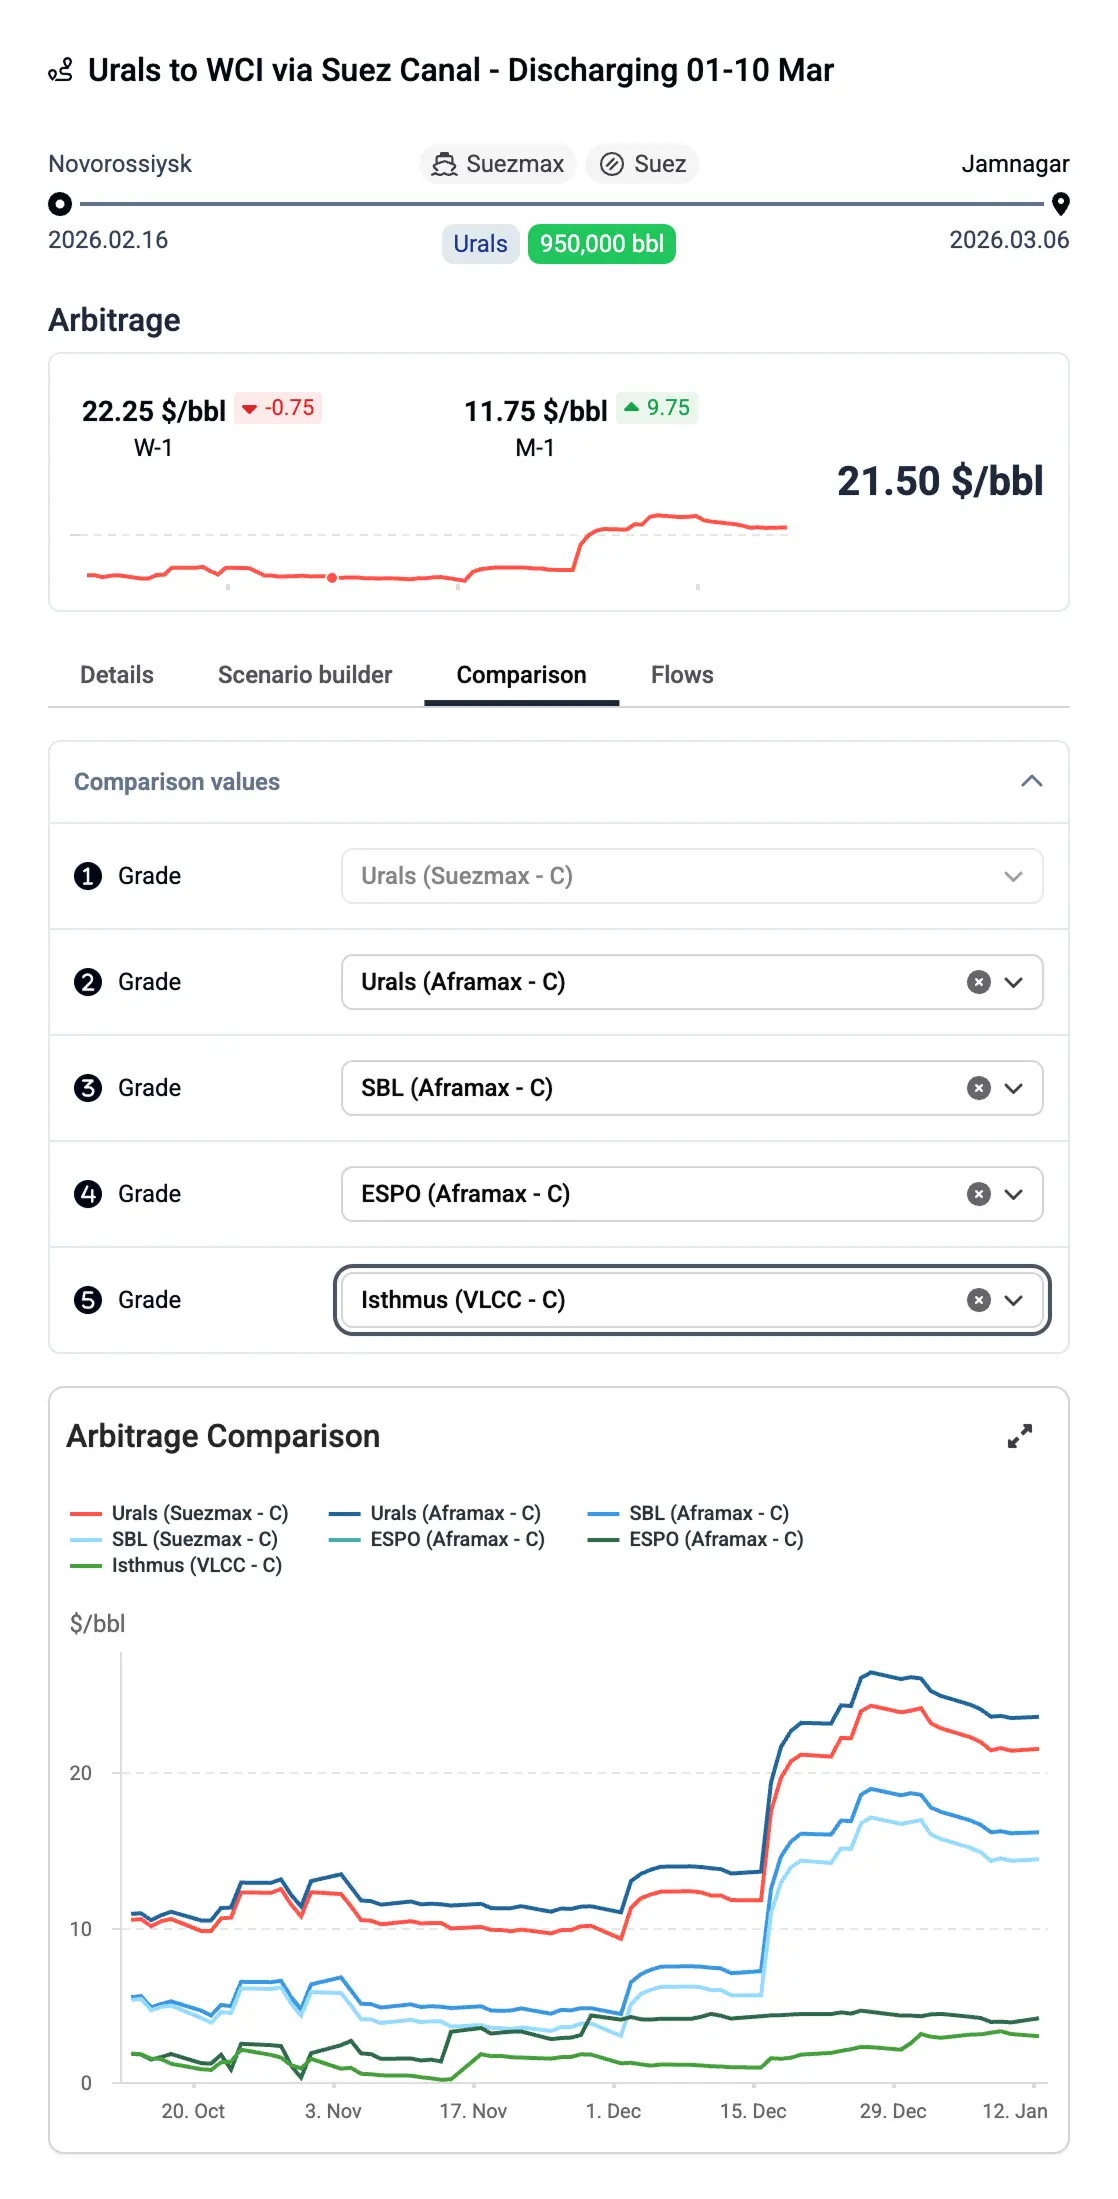
The comparison feature lets users quickly benchmark arbitrage values or refining margins for a crude grade across multiple regions, helping them see where that crude is most competitively valued.
- Compare a single crude grade across several destination markets in one view.
- Compare multiple crudes within a trading region.
- Instantly spot which regions offer the strongest economics or weakest demand signals.
- Supports faster, data-driven decisions on pricing, tender strategy, and market allocation.

“Kpler is one of the few truly objective research outfits. No agenda, just data-driven insights.”