How to navigate terminal congestion with Kpler
Congestion is a major global cost center. Industry estimates show that demurrage and detention fees, along with time lost at congested ports, cost container lines and shippers billions each year. Maritime congestion drives significant financial burdens through delays, higher fuel consumption, and extended container dwell times. One study found that in 2021 alone, shippers incurred nearly US $321 million in additional interest expenses as cargo sat idle at berth.
These added costs, combined with longer transit times, flow directly into higher freight rates and broader supply-chain expenses. One analysis shows that port bottlenecks are a major driver of elevated transport costs worldwide. As vessel waiting times rise due to congestion, so do chartering, demurrage, and fuel expenses, ultimately increasing the cost of moving goods by sea. Given that over 90 % of world trade is seaborne, these inefficiencies impose a substantial drag on overall trade performance.
Limited visibility into terminal level traffic compounds these issues. When operators are planning their routes and organizing schedules, they have limited visibility into congestion at the terminal level, which is ultimately where their managed vessels have to berth. Typically operators and fleet managers will not have this data available until their vessel is close to port, and by then they have limited flexibility and can face issues with delays due to not discharging on time – further amplifying costs.
To address these issues in the container shipping sector, Kpler has recently released Container Intelligence. This new product delivers real-time insight into terminal level congestion at global container ports and enables forward-looking scheduling.
In this blog, we look at several studies highlighting port congestion, the disruptions that faced the Port of Durban – one of the largest ports in South Africa – and how Kpler’s Container Intelligence tool can provide critical insight to navigate complex and constantly shifting logistical issues at port.
Durban at a glance, a vital yet vulnerable hub
The Port of Durban, also known as Durban Harbour, is the largest and busiest port in sub-Saharan Africa, handling up to 31.4 million tons of cargo per year and 4.5 million TEUs. Stretching over 21 km of quayside and 302 km of rail track, it hosts 58 berths managed by more than 20 terminal operators and welcomes over 4,500 commercial vessels annually.
Given its scale and strategic role, linking South Africa to inland markets across Zambia, Zimbabwe, Malawi, Lesotho, and Eswatini, one might expect Durban to have efficient operations. However, Durban is one of the most difficult ports in the world to maneuver for shippers and traders. The 2024 World Bank Container Port Performance Index (CPPI) ranked Durban 403rd of 403 ports globally, based on severe vessel delays and low terminal productivity. This Index ranks global container ports based on their efficiency. The primary metric is the total time a vessel spends in port, which includes time at the port limits, waiting to berth, and being at the berth to complete cargo operations.
Why this matters globally
Each extra day of delay at Durban, Africa’s largest container gateway ripples through supply chains stretching far beyond Southern Africa. Successfully navigating congestion is now critical to maintaining margins – that starts with terminal-level visibility.
Durban handles about 60% of South Africa’s container traffic and acts as a key entry and exit point for goods moving in and out of the region. While many blame seasonal demand or port-wide issues, the reality is clearer, disruptions start at the terminal, not the port.
Get ground-level visibility with Container Intelligence
With Kpler’s Container Intelligence, users gain direct access to granular, real-time congestion data at the terminal level. You can see which terminals are backed up, how many vessels are in queue, current and forecasted vessel calls, and performance trends like average stay and waiting times, all refreshed in real time.
In the example below, Durban's three terminals, Terminal 1, the Multi-Purpose Terminal (MPT), and Terminal 2, show significant differences in operational performance. As of now, Terminal 1 shows higher congestion, while MPT is currently clear. Yet MPT’s 6-month performance index is still underperforming compared to Terminal 1 at 4.8. This index compares the last 7 days of performance to the past 6 months: 1 = major underperformance, 5 = average performance, 10 = strong improvement.
This kind of insight helps logistics teams anticipate which terminals will be problematic and plan accordingly, whether that’s rerouting, adjusting schedules, or renegotiating with carriers.
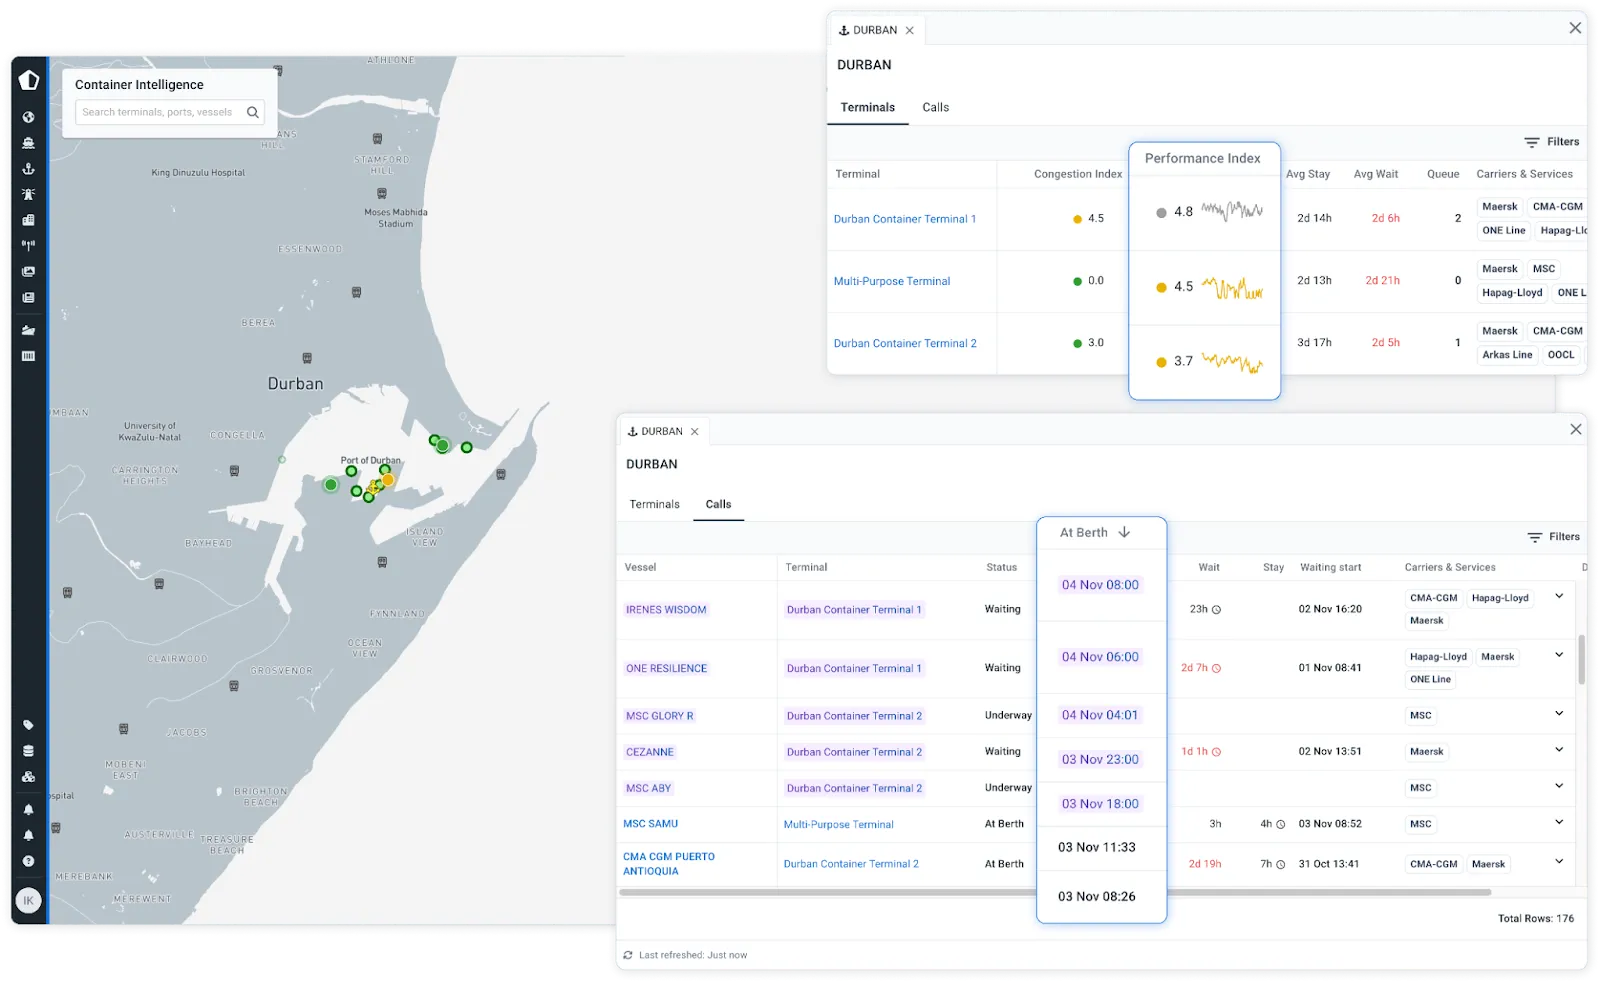
Users can see which vessels are scheduled to call at each terminal over the next six weeks and beyond, providing valuable foresight for effective planning and informed negotiations.
The case explored in this article highlights the issue of port congestion. While such analyses provide valuable insights into global port performance, they overlook terminal-level dynamics, the layer that truly reveals where delays originate and where operational improvements can be made. For this study, we focus on data from Durban, which recorded an average delay of 9.8 days in June, up from 6.9 days in May, as reported in the referenced article. Let’s now dive into historical data from that period to explore the insights that Kpler’s Container Intelligence can uncover.
At first glance, Kpler’s Container Intelligence port-level data indicates only a mild deterioration from May to June:
- Vessel calls ↓ 11 % in June
- Total calling TEU capacity ↓4 %
- Share of vessels experiencing waiting ↑ from 93.2 % → 95.8 %
- Average waiting time ↑ 28 % (from 19.7 → 25.3 hours) congestion became more widespread even as total traffic eased slightly
- Average staying time ↓ 22 % (from 63.3 → 49.2 hours) suggesting that terminal operations themselves became more efficient and that the problem lies before berthing, not at the quay.
Although vessel calls decreased and average waiting time increased, the average staying time fell accordingly, balancing the overall turnaround time of container vessels and keeping it roughly in line with the previous month.
Deep dive at the terminal level
What truly reveals the port’s operational dynamics is a deep dive into Durban’s three terminals. While two terminals experienced shorter delays in June, one emerged as the key congestion hotspot, highlighting the limitations of relying solely on port-level data.
By shifting the focus from the port to the terminal level, Container Intelligence uncovers the underlying disparities, identifying which facilities are genuine bottlenecks and which maintained steady performance. This level of visibility empowers users to negotiate more effectively with terminals, monitor in real time which vessels and carriers are being prioritised, and receive early congestion alerts to adjust rotations. It also supports strategic network planning, enables performance benchmarking across terminals, and helps teams understand the root causes of disruptions, so that the right people can make informed operational decisions.
Looking at the data from Kpler’s Container Intelligence tool, it becomes evident that the port’s average waiting time does not reflect what’s happening at each terminal. Terminals 1 and the Multi-Purpose Terminal (MPT) performed relatively well, while Terminal 2 was the clear bottleneck. This reassures users that vessels calling at T1 or MPT can expect smoother operations, whereas those scheduled for T2 should anticipate potential delays.
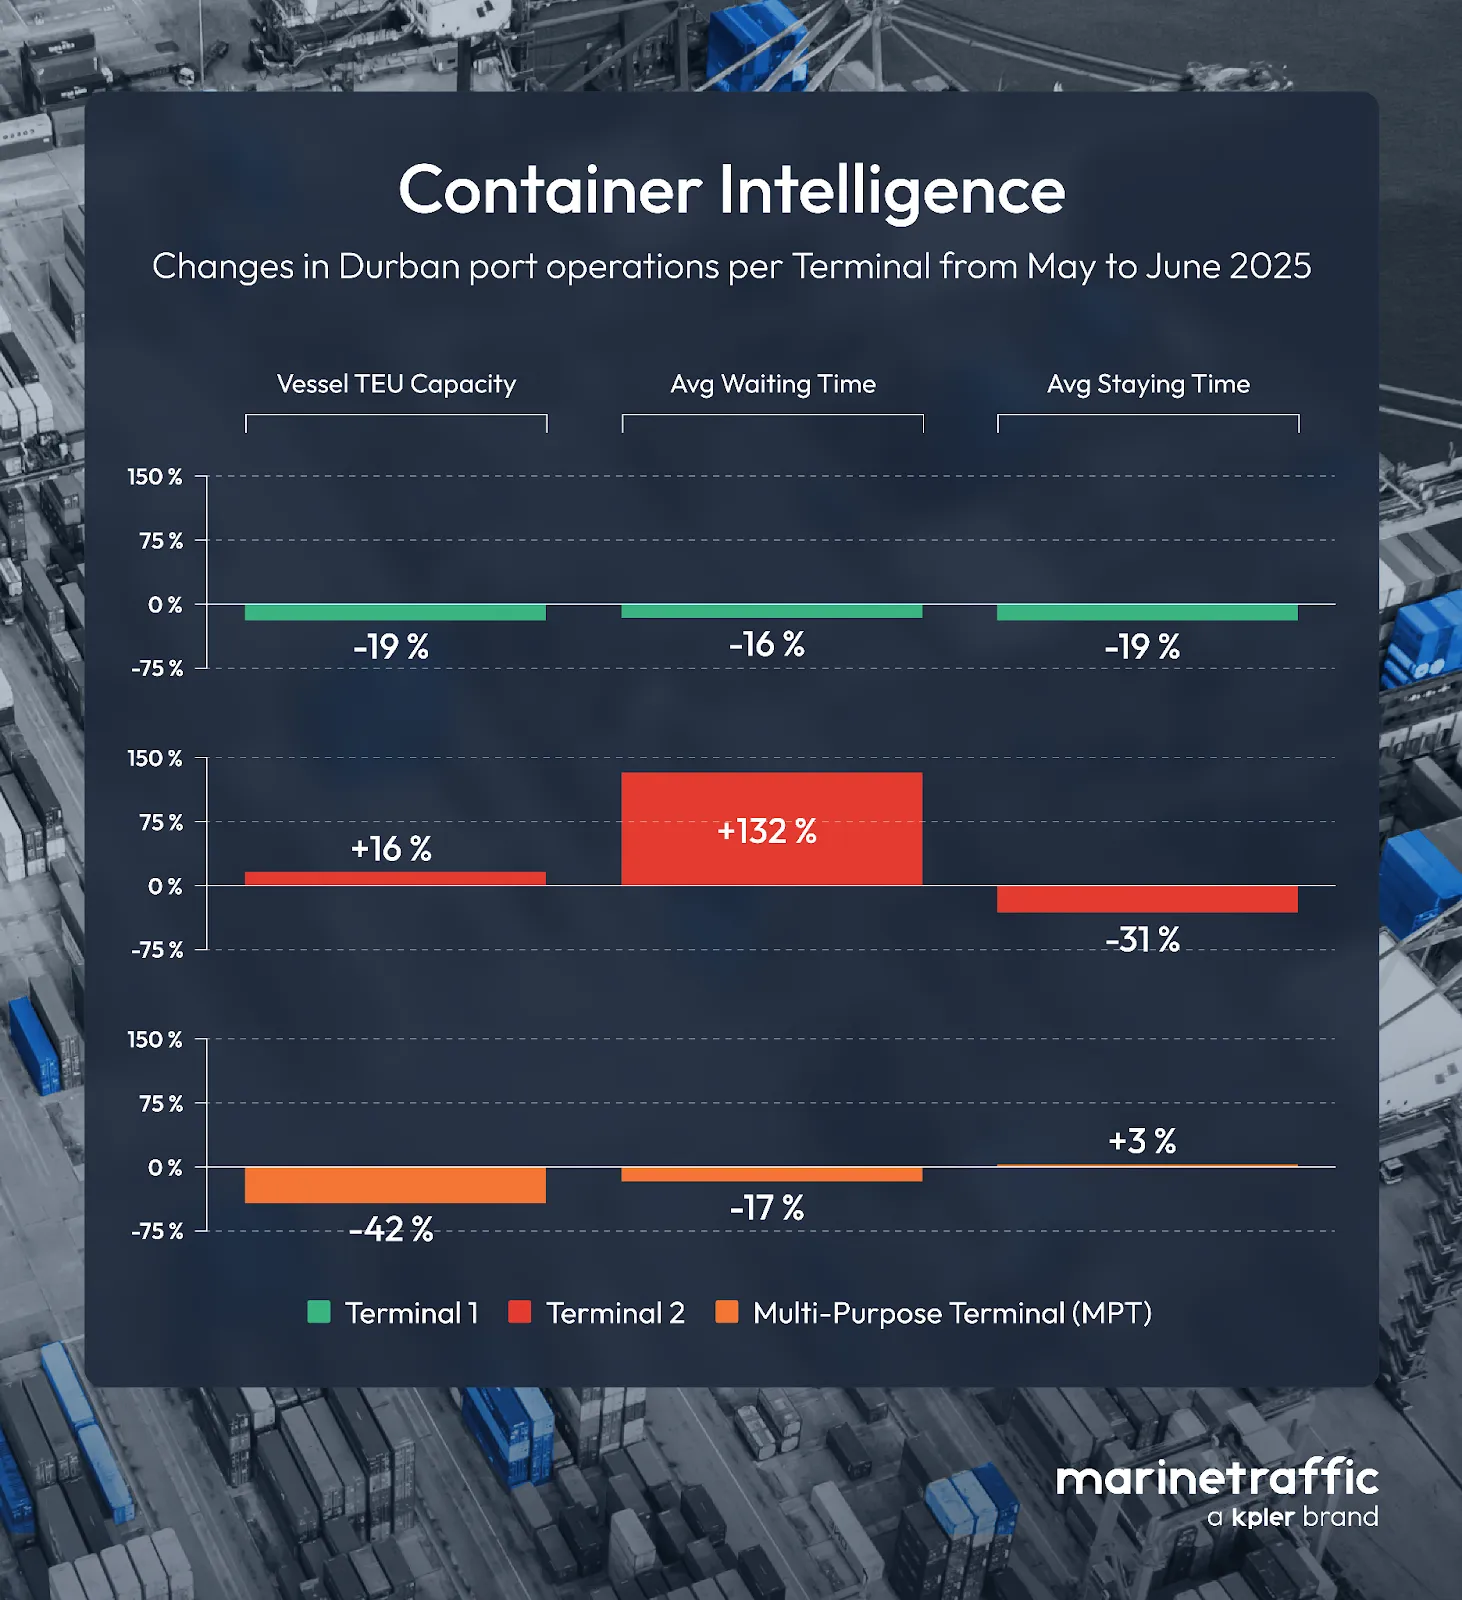
This comparative view clearly demonstrates how Container Intelligence identifies operational imbalances between terminals, providing a far clearer and more actionable picture than port-level metrics alone.
Container Intelligence surfaces these contrasts instantly, pinpointing where real pressure builds. Instead of relying on a single “Durban delay” figure, stakeholders can visualise where and why queues form, laying the groundwork for more targeted berth planning, scheduling, and resource allocation.

See why the most successful traders and shipping experts use Kpler
%201.webp)
Improve schedule reliability and lower operational costs with accurate, terminal-level intelligence.