Extended conflict becomes the baseline assumption
The Strait of Hormuz has re-closed and the Bab el-Mandeb is destabilizing, compounding supply outages and pushing recovery timelines into 2027.
Summary
- Extended Conflict Now the Baseline: After Trump chose re-escalation on July 7 with 13 straight days of bombing, a JCPOA-lite deal now looks to be a near-zero probability, leaving only “walk away” or “go kinetic” as realistic options. Iran’s leverage has risen materially – it controls the Strait of Hormuz, has struck critical Gulf infrastructure, and has withstood US strikes. We now assume an extended conflict baseline involving both low-level engagement and periodic re-escalation.
- The Strait of Hormuz Re-Closes: Daily commodity-related transits have collapsed to a 7-day average of just 7 per day as of July 28, below pre-MOU level, with dark activity back near 60% of transits. Crude/co volumes moving through the Strait have fallen to 1.7 Mbd from a June 25 peak of 11.9 Mbd, with Iran unable to export anything under the blockade and the remaining flow dominated by Iraq and the UAE.
- The Second Chokepoint: Houthi attacks on Saudi Arabia and a partial Bab el-Mandeb blockade have cut commodity-related transits to 24 per day, down from a pre-escalation average of 34. Crude/co volumes transiting the Bab have declined slightly, holding at a 7-day average of 4.9 Mbd, under the March to June average of 5.7 Mbd. Nonetheless, at least for now, Yanbu crude/co loadings continue to hold steady just under 4 Mbd. Saudi can theoretically re-route all Yanbu exports northward, but vessel availability will become an issue.
- Supply Recovery Pushed Back: We forecast Middle East crude/co outages to average 9.9 Mbd against the February 2026 baseline between August and November with no recovery until year-end at the earliest. Refinery outages will persist at 2.4 Mbd through October. LNG supply is most damaged – outages will hold at 4.7 Mt/month through November. Structural damage at Ras Laffan will limit supply from the facility to just 27 Mt this year, down from 81 Mt in 2025, and only recovering to 61.5 Mt in 2027. Uncertainty is high around forecasted supply figures, and the potential for further delays should not be discounted.
Market Analysis
We move to an extended conflict scenario baseline despite Trump’s de-escalation rhetoric following two weeks of strikes.
Over the past two months, we have attempted to not only follow, but provide a view on the evolving Iran conflict, and the options available to the White House. In our May edition of the Commodity Geopolitics Report, we argued three choices were possible. First, at a 70% probability, was the “make a deal” option where at a minimum Trump would sign an MOU ending the war, with the possibility for a JCPOA-lite type of agreement later on. Second, at a 20% probability was the “walk away” outcome, where Trump signed no deal, leaving the Strait fully under the control of the Iranians, and providing no forward path for negotiations. Third, and most unlikely, was the “go kinetic” outcome, which would involve a return to active fighting.
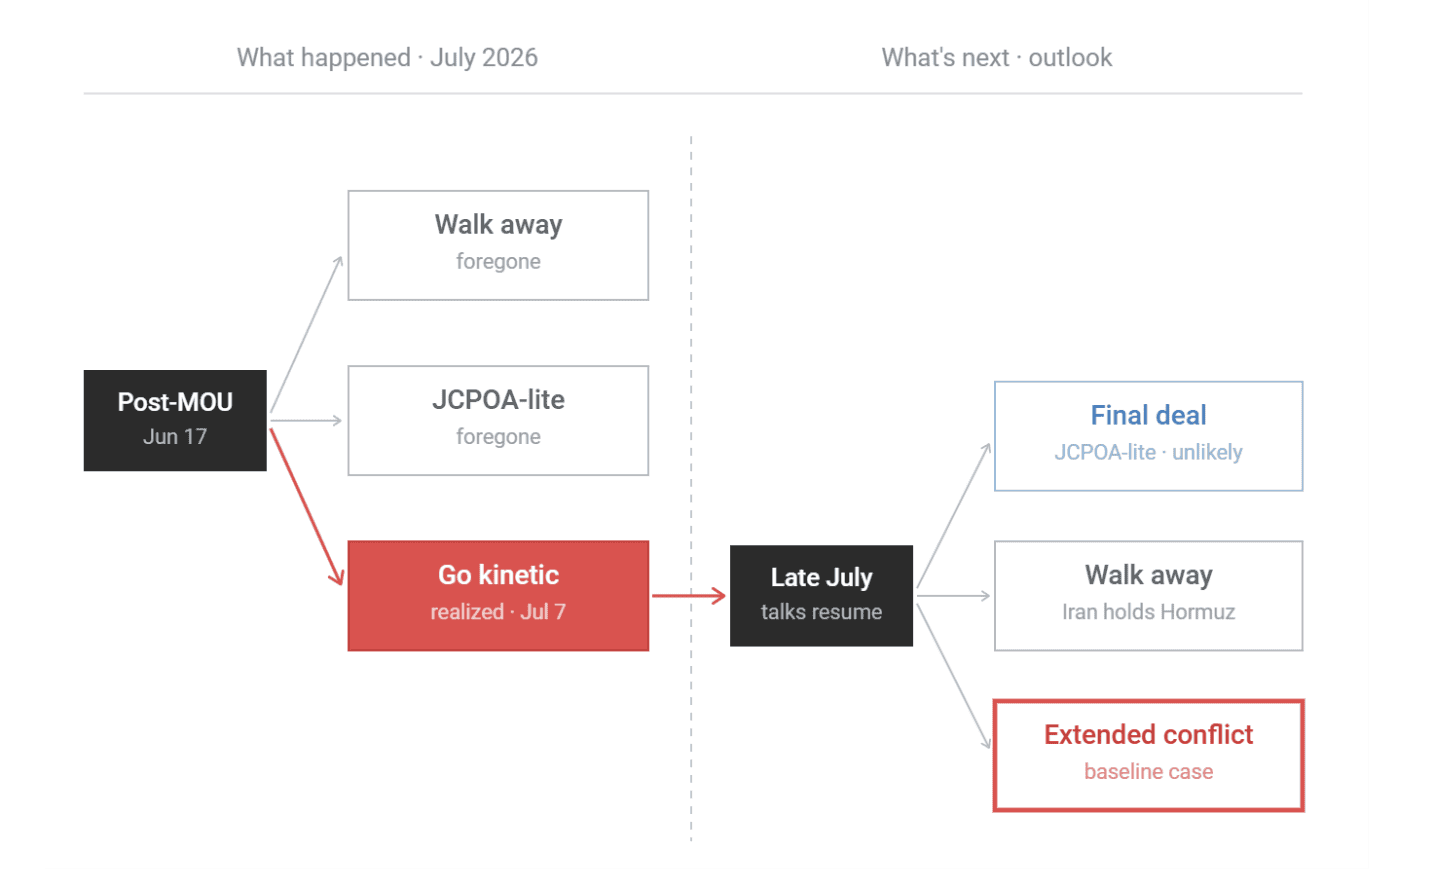
By late-June, when we issued a follow up to the May edition of the Commodity Geopolitics Report, Trump had decided to take the “make a deal” option by signing an MOU that provided a minimum 60-day window for negotiations. The period following the MOU signing was initially successful for global energy markets. Oil began to flow through the Strait, upstream production began to recover, and oil prices bottomed at the lowest levels since the war began. The situation appeared to be normalizing, and it seemed as if Trump was taking the off-ramp.
Following the MOU signing, we argued Trump had a set of three options. He could either push for a JCPOA-lite agreement, he could walk away without a deal, or he could re-escalate. Beginning on July 7, Trump ultimately chose the path of re-escalation, implementing 13 straight days of a bombing campaign that saw Iran retaliate aggressively against a number of Gulf states, including Kuwait, Bahrain, and Qatar. The United States, on July 14, also moved to reimpose a blockade on Iranian shipping. The Strait of Hormuz was effectively re-closed, and oil prices surged by 40% in the two week period through mid-July.
As the July edition of the Commodity Geopolitics Report was readying to be published (July 29), despite Trump attempts to de-escalate over the prior weekend, Iranian pre-emptive strikes at US bases in Jordan (July 28) appeared to be pushing the White House back to kinetic engagement. It seems as if the same cycle of escalation and de-escalation continues apace. Oil prices, which sold off 14% in the three trading days ending July 28, rallied again by more than 6% on July 29.
The road ahead grows ever more complicated for the Trump administration. The Houthi’s, an Iranian backed group in Yemen, have begun launching missiles and drones into Saudi Arabia while simultaneously implementing a partial blockade of the Bab el-Mandeb. The Jizan Refinery, which processes 400 kbd of Saudi crude, has been taken offline as a result of Houthi attacks. In addition, Iran’s successes in striking critical Gulf infrastructure in the re-escalation period with the United States, which included a hit on a desalination plant in Kuwait, also raise questions about whether Iran even feels it needs to make a deal with the United States at this juncture.
Daily Brent Front-Month Price ($/bbl)

Source: NYMEX; price data through July 28
The question now is what happens next? Trump’s position has weakened following two weeks of strikes on Iran. In our June Commodity Geopolitics Report, we argued that following the MOU signing, the White House would need to show the American people that the President has gained something from the Iran conflict despite holding ever decreasing leverage. This would likely center on gaining concessions around the Iran nuclear program in exchange for direct financial concessions, permanent sanctions relief, and potentially hundreds of billions in foreign direct investment commitments.
A month on from the June report, and the possibility of any deal looks increasingly unlikely. Iran has little incentive to make a deal – their leverage has risen amid an ability to control the Strait of Hormuz, strike critical infrastructure, and withstand US military strikes. We now feel that Trump faces two realistic options, either “walk away,” with no deal and allow Iran to control the Strait of Hormuz, or “go kinetic” which could involve low level engagements, or re-escalation once again. The prospects for a JCPOA-lite deal now appear to be a near-zero probability outcome. Our baseline assumption now holds to an extended conflict scenario that will likely involve periods of both low level kinetic engagement, and re-escalation. Iran will push to maintain full control over the Strait of Hormuz.
The Strait of Hormuz, after steadily reopening, has re-closed; impacts along the Bab el-Mandeb are also being felt.
Following the signing of the MoU in June, vessel activity through the Strait of Hormuz steadily recovered. Daily commodity-related Strait transits, including dark vessel activity, peaked on June 26 at a 7-day moving average of 44 transits-per-day, up from a daily average of less than 10 in the period between March and May. While the recovery along the Strait of Hormuz was still far below the pre-conflict level of more than 100, the recovery was still real and present. The uptick in transits was roughly split between vessels entering and exiting the Mideast Gulf, and the percentage of vessels transiting with AIS turned off declined rapidly – both signs that things were normalizing.
However, following re-escalation on July 7, transits through the Strait of Hormuz have rapidly declined. On a 7-day moving average, transits as of July 28 were holding at just 7 per day, falling below levels seen ahead of the MOU signing. The percentage of vessels with AIS turned off has also rapidly increased to nearly 60% of all transits, off a post-conflict low of 35% in late June, a sign that the normalization process reversed.
Daily Commodity-Related Strait of Hormuz Vessel Transits
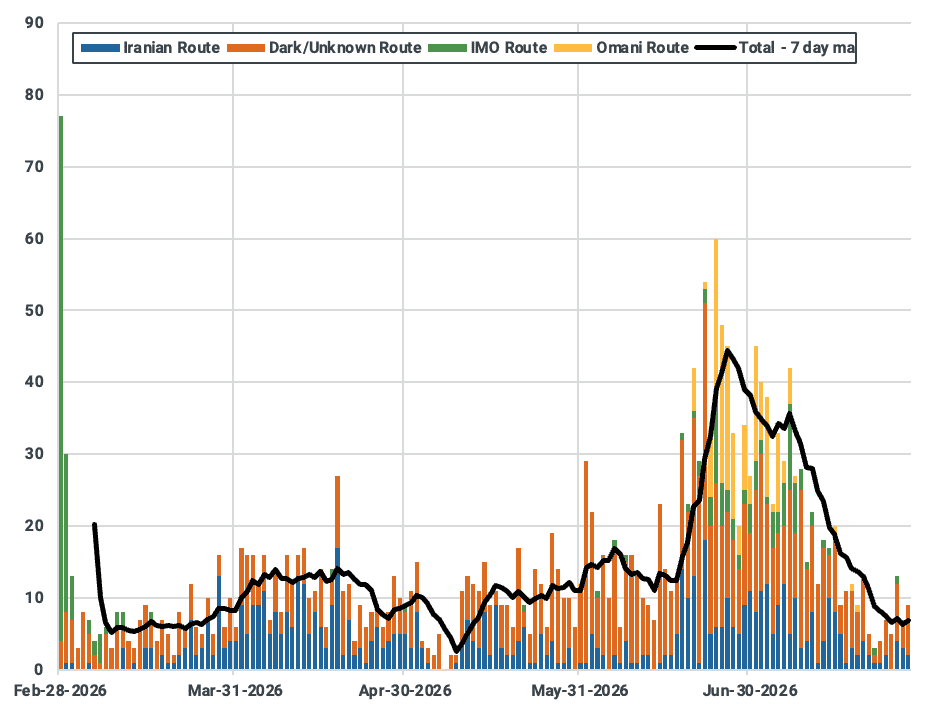
Source: Kpler; data through July 28
In terms of total crude/co volumes leaving via the Strait of Hormuz, Kpler tracking initially noted an impressive uptick following the MOU signing, mimicking the improvement in transit count. Crude/co export volumes, when smoothed on a 7-day moving average, managed to peak at 11.9 Mbd on June 25, and spiked again on July 7 ahead of the US re-escalation. In total through June, Strait of Hormuz crude/co transits averaged out to 6.1 Mbd, up from an average of just 1.8 Mbd seen through March, April, and May.
Unfortunately, crude/co transits through the Strait have precipitously declined. As of July 28, the 7-day moving average was holding at just 1.7 Mbd, roughly back in line with the pre-MOU signing level. Since the US blockade went into effect, Iranian exports have fallen dramatically. Most of the 1.7 Mbd has been volume from Iraq (50% of total, 850 kbd), and the UAE (34% of total, 570 kbd).
Daily Crude/Co Strait of Hormuz Transits by Origin Country (kbd)
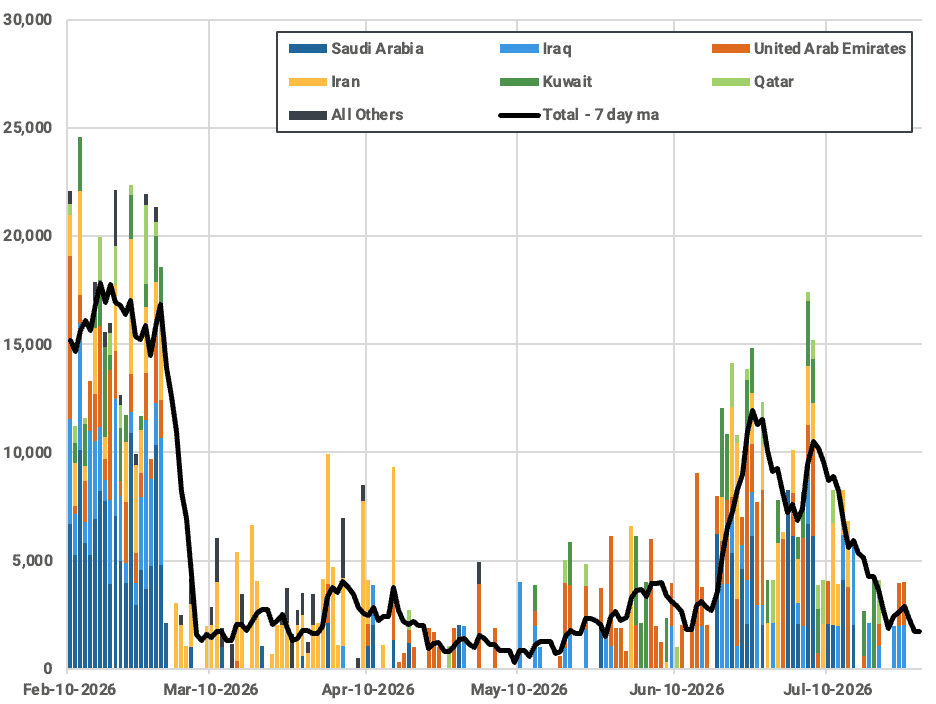
Source: Kpler; data through July 28
LNG transiting the Strait of Hormuz also picked up following the signing of the MOU, albeit not to the degree seen across crude. In June, total LNG exports along the Strait of Hormuz managed at 1.1 Mt, up from a monthly average of just 0.2 Mt seen over March, April, and May. However, LNG transits have remained at zero since July 12.
The temporary surge in crude/co volume exiting the Mideast Gulf via the Strait of Hormuz caused a rapid drawdown in combined onshore + offshore crude storage across the Middle East. However, after bottoming at 390 Mb, total Middle East crude/co stocks have risen to 402 Mb amid a re-closure of the Strait of Hormuz. There is roughly 40 Mb that can currently be drawn from stocks if the Strait reopened again like we saw post MOU signing. Beyond that, upstream production will need to resume.
Daily Onshore + Offshore Middle East Crude/Co Inventories (Mb, 7-day ma)
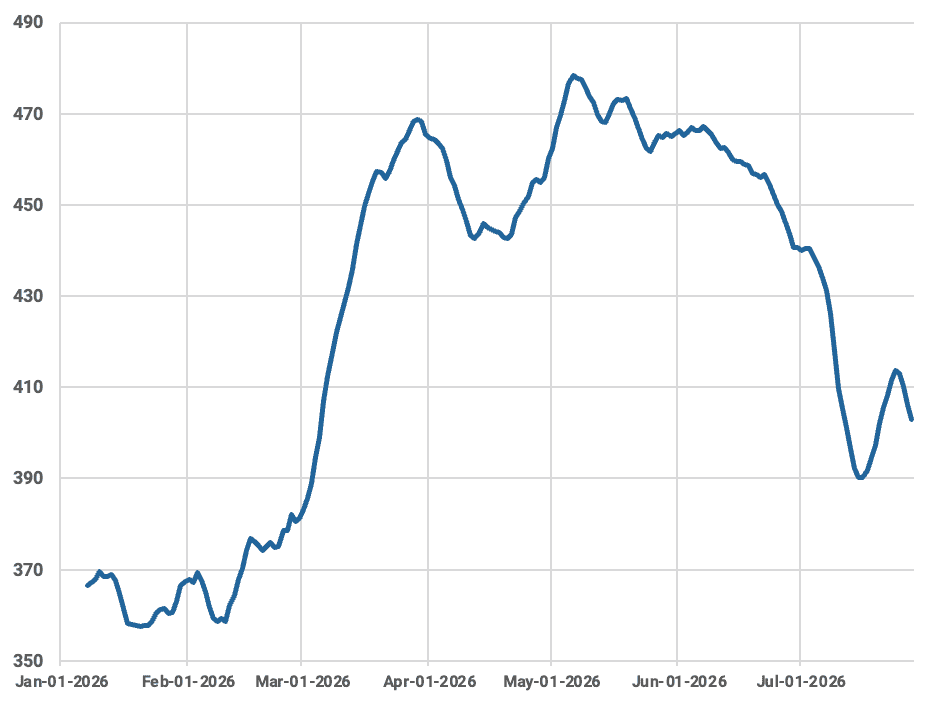
Source: Kpler; data through July 28
The situation along the Bab el-Mandeb also looks to be destabilizing somewhat as fighting between Saudi Arabia and the Houthi’s intensifies. The Houthi’s have implemented a partial blockade that allows some vessels through, while restricting others. Ahead of the escalation between Saudi Arabi and the Houthi’s, commodity-related vessel transits through the Bab el-Mandeb Strait averaged 34 per day. Based on our tracking, the 7-day transit average has fallen to 24 per day as of July 29, a noticeable decline. We will continue to monitor whether traffic stabilizes at a lower level or continues to fall.
Daily Commodity-Related Bab el-Mandeb Vessel Transits
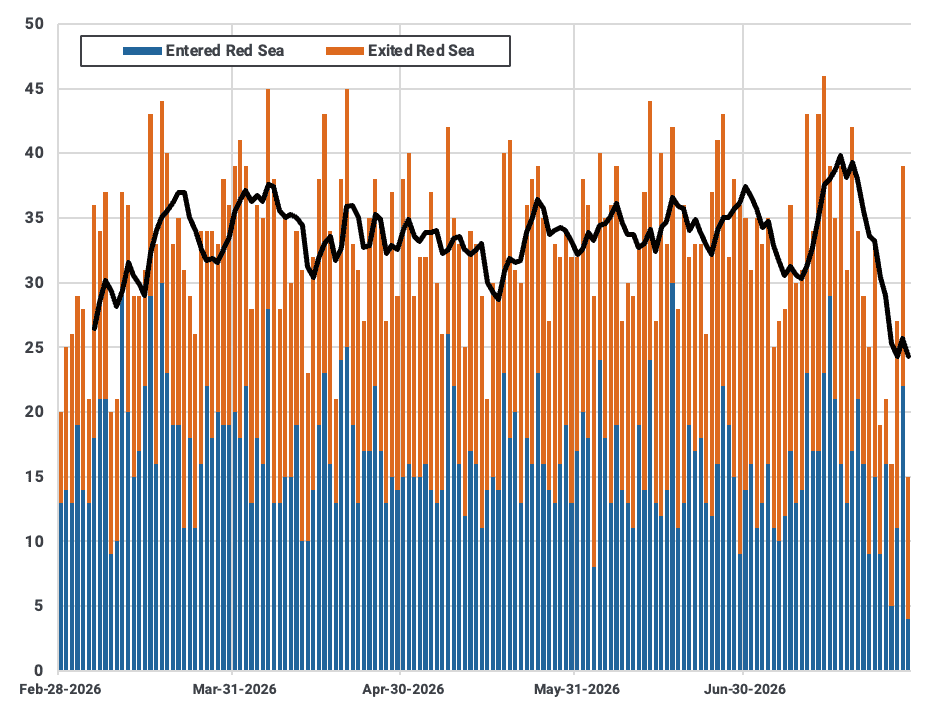
Source: Kpler; data through July 29
The decline in transits along the Bab el-Mandeb is having only a limited impact on crude/co volumes moving through the waterway. Before the recent escalation between Saudi Arabia and the Houthi’s, crude/co volumes through the Bab el-Mandeb had surged to an average of 5.7 Mbd in the period between March and June, as Saudi redirected oil exports to Yanbu amid the closure of the Strait of Hormuz. Before the Iran conflict, Bab el-Mandeb crude transits held at ~2.8 Mbd. For now, the 7-day moving average for crude/co volumes through the Bab is holding at 4.9 Mbd – transits volumes have taken a hit, but they have yet to show signs of outright collapse.
The Yanbu terminal, located at the end of the East-West pipeline on Saudi Arabia’s Red Sea coast, ramped crude/co exports to nearly 4 Mbd after the start of the Iran conflict. Of this 4 Mbd, roughly 3.2 Mbd transited south through the Bab el-Mandeb up until the most recent flare up with the Houthi’s. Flows data currently tags the 10-day moving average for loadings out of Yanbu at 3.8 Mbd, revealing that exports, at least for now, continue without interruption. Saudi Arabia could theoretically push all 4 Mbd of Yanbu exports towards the Suez, but tanker availability will become an issue.
Daily Yanbu Crude/Co Loadings (kbd, 10-day ma)
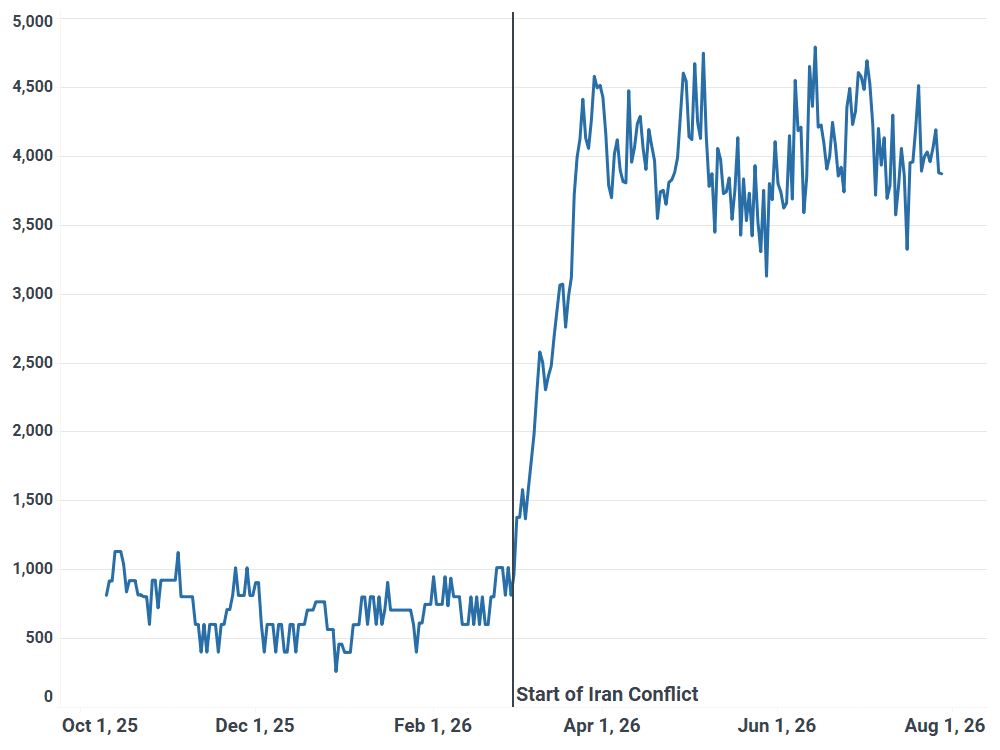
Source: Kpler; data through July 28
Our extended conflict baseline pushes back expectations for Middle East energy production recovery.
Our expectations for a recovery in Middle East energy production have been pushed back significantly following US re-escalation, and a move to an extended conflict base case. In our June Commodity Geopolitics Report, we were optimistic about production restarts, arguing that a full recovery in Middle East crude/co output would occur by September. These hopes have since been dashed. We now anticipate no recovery until the end of the year at the earliest.
Despite a short-lived improvement through late-June and early-July, Middle East crude/co production outages, relative to a February 2026 baseline, will persist at an average of 9.9 Mbd between August and November. Note this is still an improvement against outages seen in May (-12 Mbd) as we anticipate the UAE will manage to keep production at nearly pre-conflict levels after output steadily recovered in April, May, and June. It is our belief that the UAE will be able to strategically utilize the ADCOP pipeline to bypass the Strait of Hormuz for much of its produced crude.
Monthly Middle East Crude/Co Production Differential Against February 2026 Baseline (kbd)
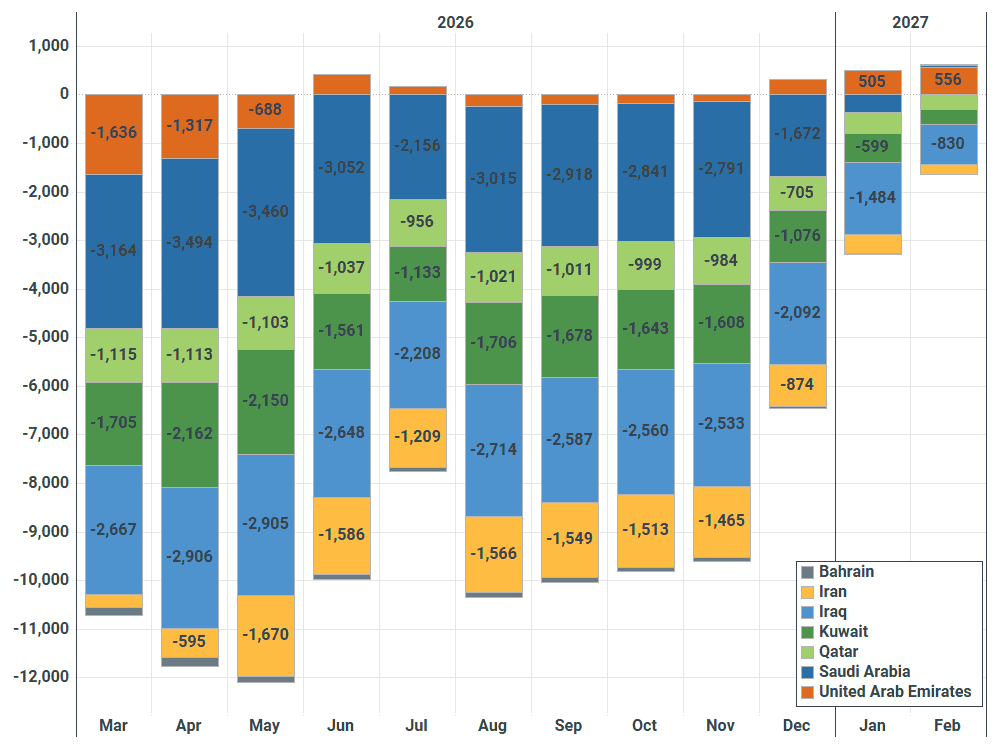
Source: Kpler
While our outlook for Middle East crude/co production recovery took on an optimistic outlook before American re-escalation on July 7, the same could not be said of Middle East refinery runs. Even within the post-MOU period, when Trump appeared to be taking an off-ramp from the war, we did not see Middle East runs recovering until the end of the year. Now that we have moved to an extended conflict scenario, we don’t anticipate much recovery in refinery runs until the very end of the year, at the earliest. Outages, relative to a February 2026 baseline, will persist at 2.4 Mbd between August and October before some slow improvement in November and December.
Similar to the crude/co production side of the ledger, refinery run cuts, even with our worsening outlook, have still narrowed a bit relative to April, when throughput was down more than 3 Mbd relative to February 2026. This improvement is mostly to do with Iran. In April, Iranian run cuts were nearly 500 kbd, a level that we believe will hold in a range between 180 – 200 kbd through October.
Monthly Middle East Refinery Run Differential Against February 2026 Baseline (kbd)
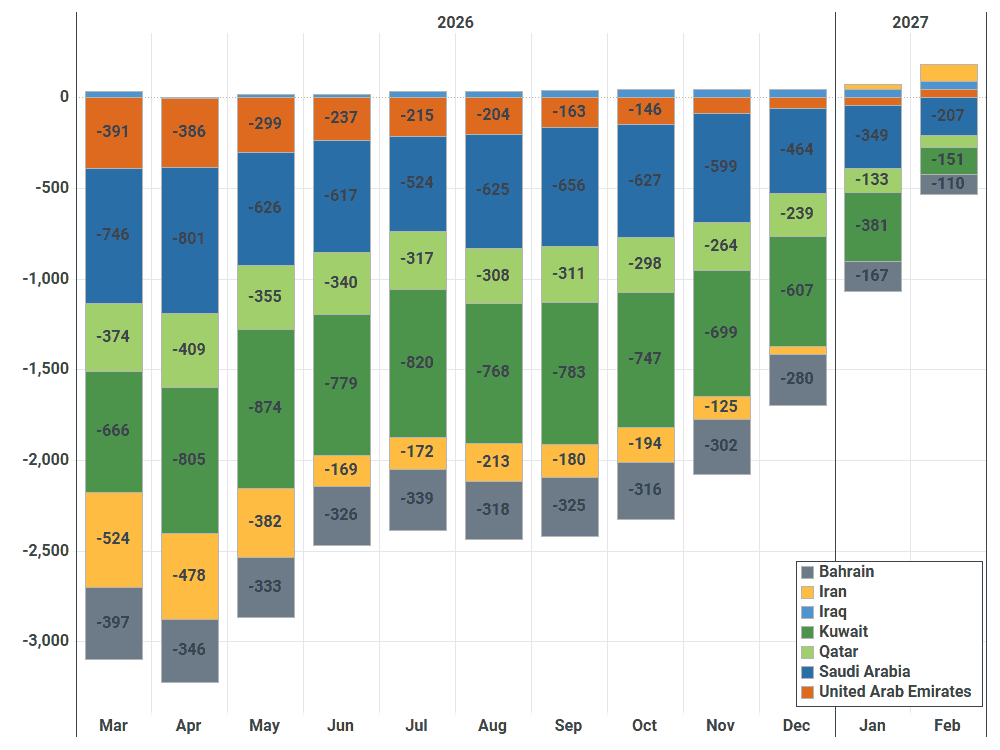
Source: Kpler
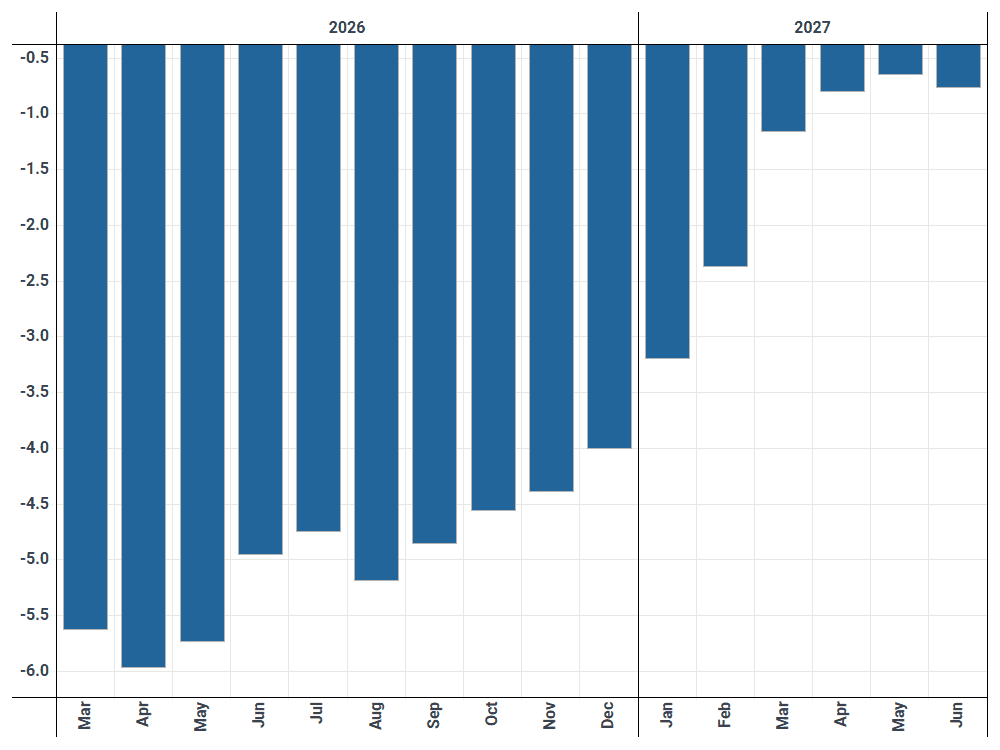
The outlook for LNG supply also looks increasingly bleak following our shift to an extended conflict baseline scenario. As mentioned in the prior section of this report, while some crude is still managing to make it out of the Middle East, LNG-based transits through the Strait of Hormuz have ground to a halt. LNG supply outages relative to a February 2026 baseline will persist at 4.7 Mt/month between August and November before a larger improvement by late-Q1 of next year. This is a considerable hit to supply. Over the course of 2026, we anticipate that Ras Laffan, Qatar’s critical LNG facility, will supply just under 27 Mt to the market, down from 81 Mt in the year prior.
Even with a recovery in supply expected by early next year, damage to Ras Laffan will have a long-term structural impact. We expect Ras Laffan to produce roughly 61.5 Mt of LNG supply next year, down nearly 20 Mt from 2025. The United States, which is expected to add +13 Mt in LNG supply in 2027, will represent a critical backstop.
Monthly Middle East LNG Supply Differential to February 2026 Baseline (Mt)
Source: Kpler
Market insights you can trust
Kpler delivers unbiased, expert-driven intelligence that helps you stay ahead of supply, demand, and market shifts.
Trade smarter. Request access to Kpler today.

See why the most successful traders and shipping experts use Kpler