

Tailwinds for LNG bunkering in 2026
Global LNG bunkering shifts gears from capacity expansion of LNG bunkering vessels (LNGBV) to increased utilisation
Executive summary
If 2024 was characterised by a wave of new vessel deliveries helping unlock supply bottlenecks, 2025 has capitalized on the expanded fleet to radically step-up bunkering activities.
The global LNG bunkering market continued its upward trajectory, climbing to nearly 4 mt, marking a 38% year-on-year increase. While this growth rate is more modest than the doubling of volumes seen in 2024, it is arguably more significant in its quality. This expansion occurred despite the addition of only three LNG bunkering vessels in 2025, two of which are newbuild, compared with ten in 2024, demonstrating that the market is no longer driven solely by new infrastructure capacity, but by a stronger pull driven by economics and regulatory incentives across the shipping industry.
Demand growth was unevenly distributed, reshaping the global map of LNG bunkering:
- Asia served as the primary engine, accounting for nearly half of the global increase, +45% year-on-year.
- Europe remained the largest market overall, while undergoing a structural shift toward utilisation-led growth, +26% year-on-year.
- The Americas experienced a breakout year, pushing regional growth to 57% year-on-year.
LNG Bunkering Volume by Continent (t) vs Active LNG Bunkering Vessel
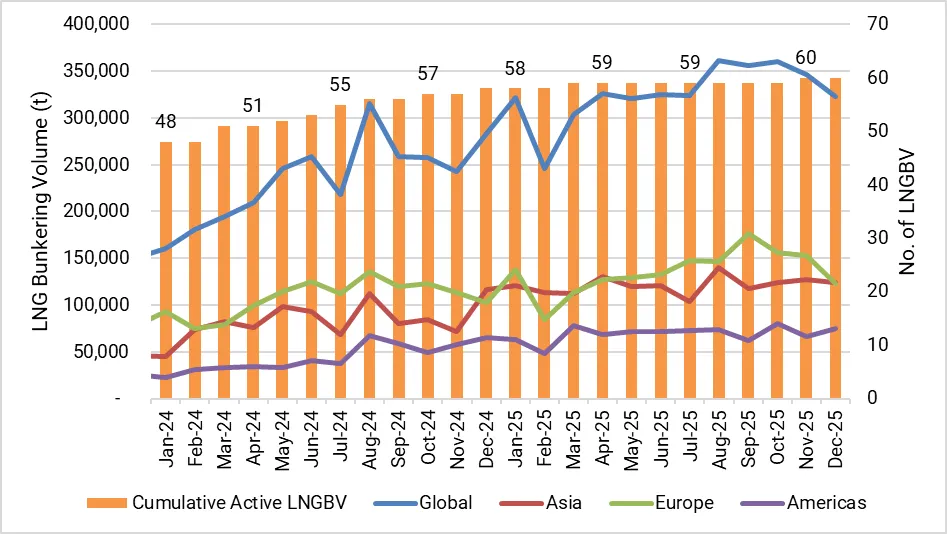
Note: Active LNGBV exclude operating LNGBV that never conducted LNG bunkering activity since 2023
Regional deep-dive
Asia
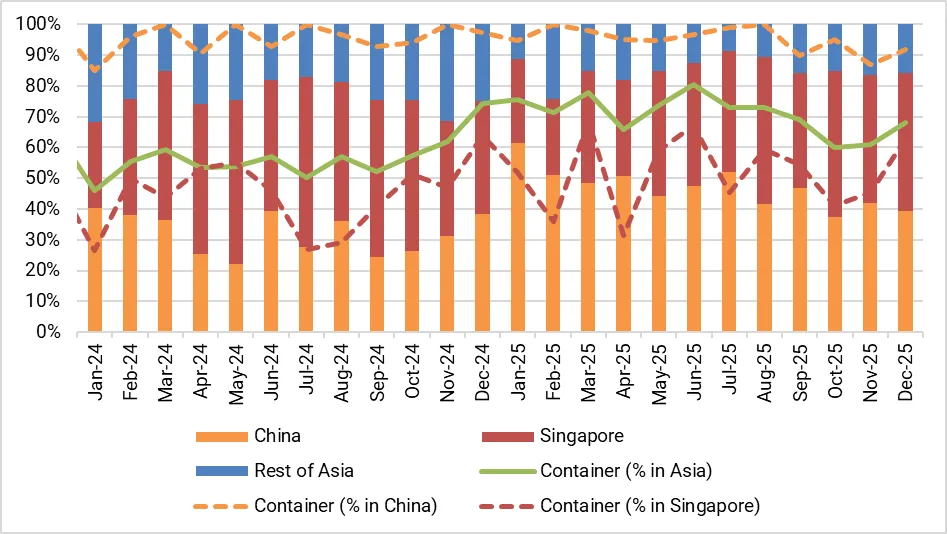
Asia entered a high-growth phase in 2025, with total volumes surging 45% year-on-year as the regional network expanded to 920 operations compared to 599 in 2024.
This breakthrough performance was spearheaded by China, which contributed nearly 80% of the region’s growth, largely driven by two new vessels introduced in mid-2024: Hai Yang Shi You 302 and Huaihe Nengyuan Qihang.
These assets catalysed a massive uptick in the container ship segment, which accounted for 95% of China’s total volume increase, with MSC and CMA CGM emerging as primary anchors of demand.
While the Huaihe Nengyuan Qihang integrated with the Hai Gang Wei Lai in Shanghai to extend services for CMA CGM, CNOOC's Hai Yang Shi You 301 and Hai Yang Shi You 302 drove an additional 59 operations for MSC across the Shenzhen and Ningbo hubs.
Singapore reinforced this regional momentum with a 24% rise in consumption of LNG as a bunker fuel, sustained by the high utilisation of its three vessels: FueLNG Bellina, FueLNG Venosa and Brassavola. The expansion was particularly led by the vehicle carrier segment for which operations nearly tripled, underpinned by robust demand from major players including COSCO, MOL, and K Line, alongside a robust container segment that contributed 83% of incremental growth in Singapore.
Conversely, structural constraints hampered momentum in other key hubs. Malaysia recorded a 39% year-on-year contraction following the conclusion of the Titan Vision charter in early 2025; while the Paolina Cosulich ramped up activity, it was unable to fully bridge the resulting capacity gap. Similarly, South Korea saw a 44% volume decline precipitated by a collapse in "gas-up and cooldown" activity, which stripped 19,000 t from the market. However, this masked a positive structural shift: KOGAS’ Blue Whale increased its operation count, signaling a pivot toward more frequent, consistent liner demand within the container segment.
LNG Bunkering Volume Distribution in Asia
Europe
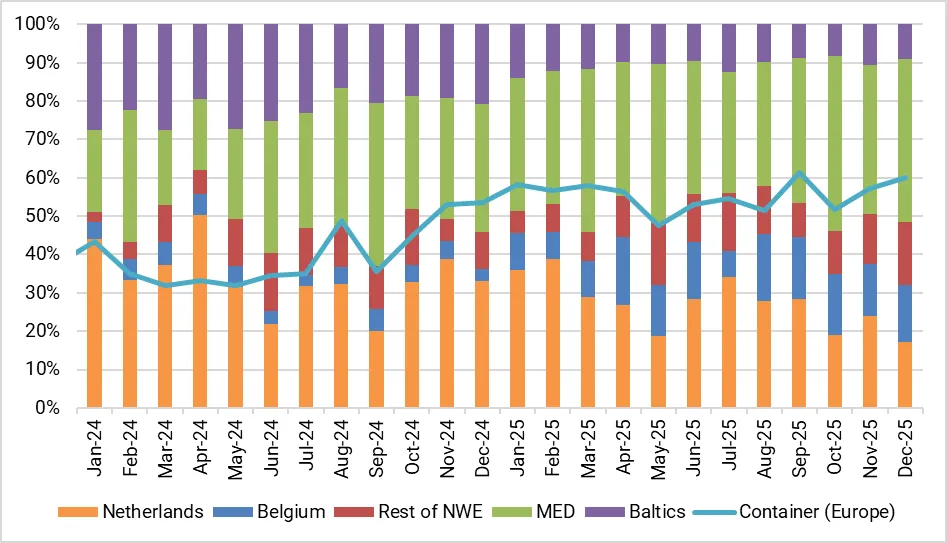
Despite the rapid emergence of competing markets, Europe remains the global hub for LNG bunkering, accounting for 41% of global volumes.
Europe’s sustained prime position stems from repeat consumption, deep fleet integration and more stable supply patterns. Northwest Europe (NWE) strengthened as the industrial backbone. Belgium emerged as a primary hub in 2025, particularly Antwerp, handling about 158,000 t, a 266% year-on-year increase, while Germany recorded steady growth of around 39%.
This growth was underpinned by differentiated supplier strategies: Shell focused on high-volume, repeat container operations for MSC, while Titan aggregated demand across vehicle carriers such as UECC, NYK and K Line.
In sharp contrast, the Baltics saw a contraction of 47%, or about 115,000 t, in ship-to-ship volumes as the region pivoted toward greater flexibility, including increased bio-LNG use via truck-to-ship operations.
The decline was structural, driven by the relocation of the Avenir Aspiration, reduced utilisation of Gasum’s Coralius amid softer Ro-Ro demand, and the sanctions-driven departure of Gazprom’s Dmitry Mendeleev, leaving passenger ferries such as Destination Gotland and Viking Line as the remaining structural demand hubs.
The Mediterranean region (MED) cemented its status as the demand frontier, catalysed by Emission Control Area (ECA) regulation, which structurally eroded the competitiveness of low-sulphur marine gasoil against LNG once compliance costs were fully internalised.
This regulatory pressure drove a growth of 113% year-on-year, or roughly 212,000 t, across the Iberian Peninsula, where activity surged in Algeciras and Gibraltar, supported by Shell’s deliveries to MSC and Peninsula’s expansion with ZIM.
The region also widened its footprint, with Portugal entering the LNG bunkering market and Italy performing its first operations in Genoa and Trieste.
Collectively, these developments indicate that European LNG bunkering has moved from build-out to utilisation, now defined by deeper fleet integration, more resilient supply chains and a clear economic advantage over conventional fuels in key trade lanes.
LNG Bunkering Volume Distribution in Europe
The Americas
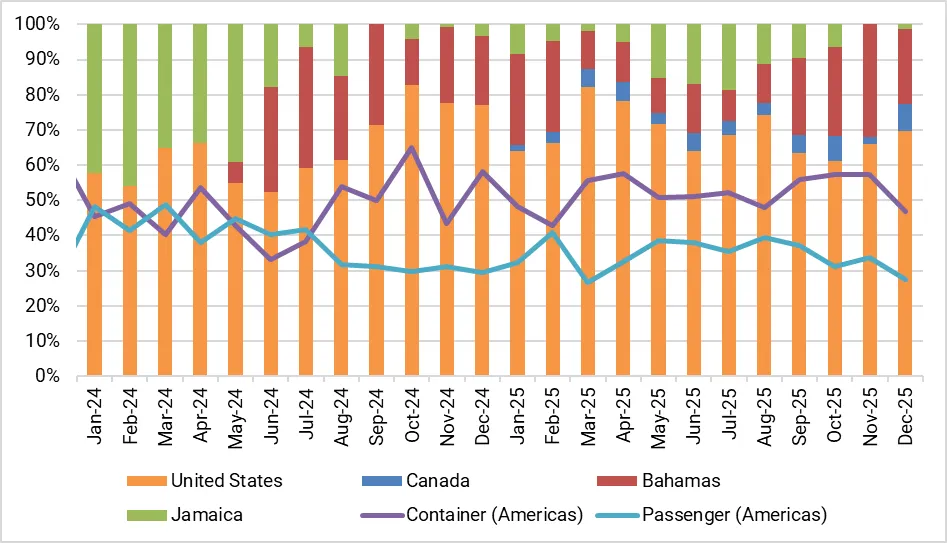
The Americas posted a sharp acceleration in LNG bunkering activity in 2025, with total volumes expanding 57% year-on-year to roughly 833,000 t.
The US anchored this growth, with volumes climbing 62% to nearly 578,000 t as bunkering events rose from 353 to 438. But, Bahamas’ rise as a major hub and Canada’s strategic entry shaped the regional dynamic. By segment, growth was two-pronged: container ships drove roughly 174,000 tonnes of incremental demand, largely from ZIM and CMA CGM, while the passenger segment added about 99,000 tonnes, underpinned by Disney, Royal Caribbean and Carnival.
Shell’s Progress served as the primary volume driver delivering 141,000 t alone to the booming container segment, and was complemented by the Seaspan fleet (Lions, Garibaldi and Baker), while Seaside LNG’s Clean Everglades and Clean Canaveral supplied the cruise sector.
Canada emerged as a new node in January 2025, contributing 38,000 t in its debut year. The market opened with the Seaspan Lions bunkering the Pacific Jade in Vancouver, establishing a key West Coast supply point. Canada’s demand profile was diversified: crude oil tankers and vehicle carriers drove roughly 27,000 t, outpacing container demand and signalling broader LNG adoption across vessel classes in the Pacific Northwest.
A structural pivot occurred in the Caribbean, with activity shifting from Jamaica to the Bahamas. Activity in the Bahamas jumped by 61% to roughly 148,000 t, solidifying its position as the region’s leading cruise hub. This growth was powered by Royal Caribbean and MSC and supported largely by Eagle LNG’s Coral Favia and increased deliveries from Shell’s New Frontier 2.
In contrast, Jamaica contracted by 17% to around 70,000 t, driven by redeployment of capacity as Shell’s New Frontier 2 reduced its local activity from 16 operations in 2024 to just four in 2025. While the Avenir Achievement ramped up container operations, it could not offset the wider volume exodus.
LNG Bunkering Volume Distribution in Americas
The infrastructure gap and market potential
The impressive headline numbers, however, mask a persistent operational reality: the infrastructure gap remains a critical constraint.
While the fleet of LNG-powered vessels is expanding, the "anywhere, anytime" flexibility of conventional marine fuels has not yet been replicated in the LNG space. LNG bunkering vessels still face constraints on where they can load and deliver product, limiting their operational flexibility compared with conventional fuel barges. As a result, record volumes are being handled by a network that still cannot reliably serve the growing dual-fuel fleet at every port of call.
This friction is evident in the latent potential of the current fleet. To assess the scale of this opportunity, we looked beyond theoretical tank capacities and calculated potential demand at the individual vessel level across LNG and conventional fuels.
A granular review of more than 500 dual-fuel vessels operating in 2024 and 2025 shows that the market is capturing only about 35% of its theoretical demand. While passenger vessels are achieving utilisation rates of nearly 90%, most container ships and tankers continue to run on conventional fuels for significant portions of their voyages.
In volume terms, actual demand of around 4 mtpa compares with potential demand of roughly 11 mtpa, implying that nearly 7 mtpa of LNG consumption remains unrealised, due to economic spreads or logistical rigidities.
Looking toward the latter half of the decade, this unrealised demand creates a powerful economic dynamic. With a large wave of LNG supply from the US and Qatar expected to enter the market, spot prices are likely to soften, making LNG bunkering increasingly competitive against conventional fuels.
If this price shift incentivises shipowners to switch fully to gas, the maritime sector could emerge as a flexible demand sink.
Much as coal-to-gas switching in the power sector supports gas prices, could a fully mobilised dual-fuel fleet provide a similar floor for global LNG spot prices?
As shipping shifts from a niche buyer to a baseload consumer, it may create enough competition to challenge legacy industries for volumes, fundamentally altering the global gas balance.

See why the most successful traders and shipping experts use Kpler


