


Middle East flow and disruption tracker: 1 Oct 2026
A briefing recapping Kpler's recent coverage of the Middle East disruption, alongside Kpler flow-tracking data for the region. The latest regional flows data is presented as of two days prior (T-2) to reduce day-to-day revision noise.
Saudi Arabia is exporting at full stretch from both coasts 3 weeks after the attack on the East-West Pipeline. Saudi crude loadings averaged about 8.8 mbd in the week to 27 September, the highest weekly level since April 2020. Confirmed Total Hormuz Clearance ranged between 7,581 kbd and 14,942 kbd a day over 26 to 29 September. The 7-day average stands at 12,652 kbd, about 74% of the 17,134 kbd pre-war baseline, and the latest days remain preliminary. Adding Gulf of Oman terminals and the Red Sea lifts the regional 7-day average to 20,317 kbd, about 13% below its 23,293 kbd baseline. Prices reflect rising supply and persistent risk at once. Brent gained 0.4% on the week while Dubai M1 to M3 backwardation eased from about $25/bbl to about $15/bbl. Kpler Insight sees looser physical markets pressing on Dubai-linked differentials, yet warns that Iranian threats to Gulf infrastructure keep bearish positioning risky.
Middle East Regional Flows (kbd)
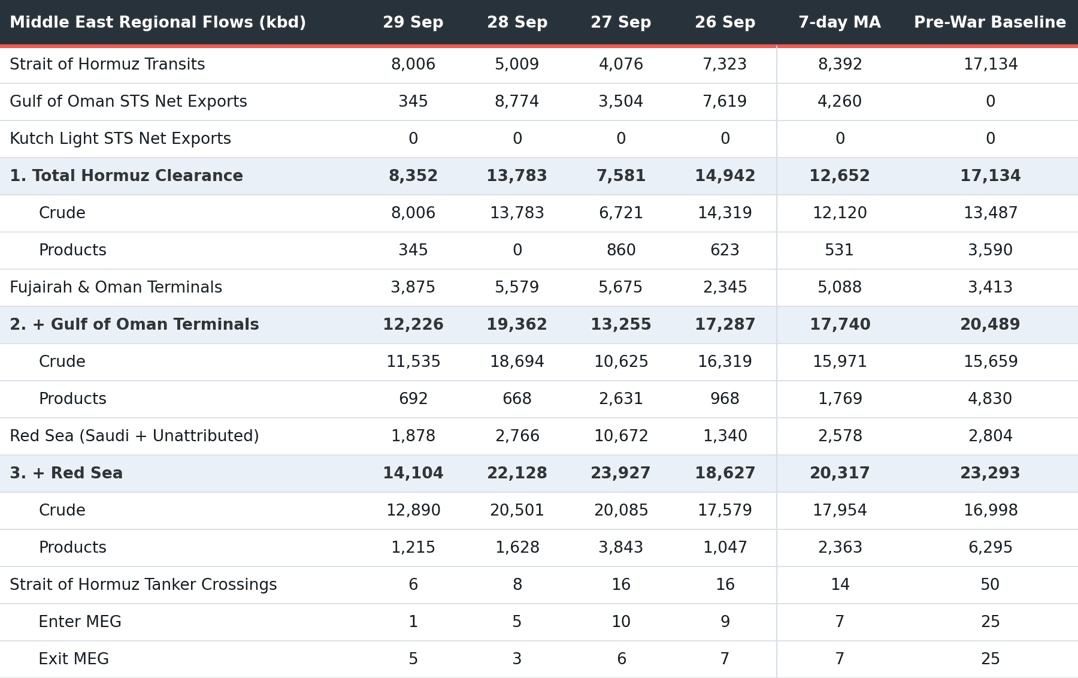
Three cumulative measures of confirmed clearance move outward from the strait itself (1) to Gulf of Oman and Fujairah/Oman terminal loadings (2) and then Red Sea volumes (3). Iranian-origin transits are excluded throughout. Figures are oil only, covering Crude/Co, CPP, DPP and Chem/Bio and excluding NGLs and LNG. Source, Kpler.

See why the most successful traders and shipping experts use Kpler
%20(1).webp)







