Empower your strategy with real-time refinery data
trusted by thousands of organisations worldwide


.webp)


900+
Refineries covered worldwide
7+
Years historical data
100+
Mbd primary distillation capacity tracked
500+
Crude grades tracked
- Investigate refinery runs by crude quality to gain insight into the interplay of sweet, sour, heavy and light barrels in addition to API and sulfur
- Evaluate demand with utilisation rates for any selection of refineries, players or geographies and understand constraints
- Understand chemical and commercial implications of changing slates with crude imports and pipeline connectivity mapping for a comprehensive picture of operations
Request demo
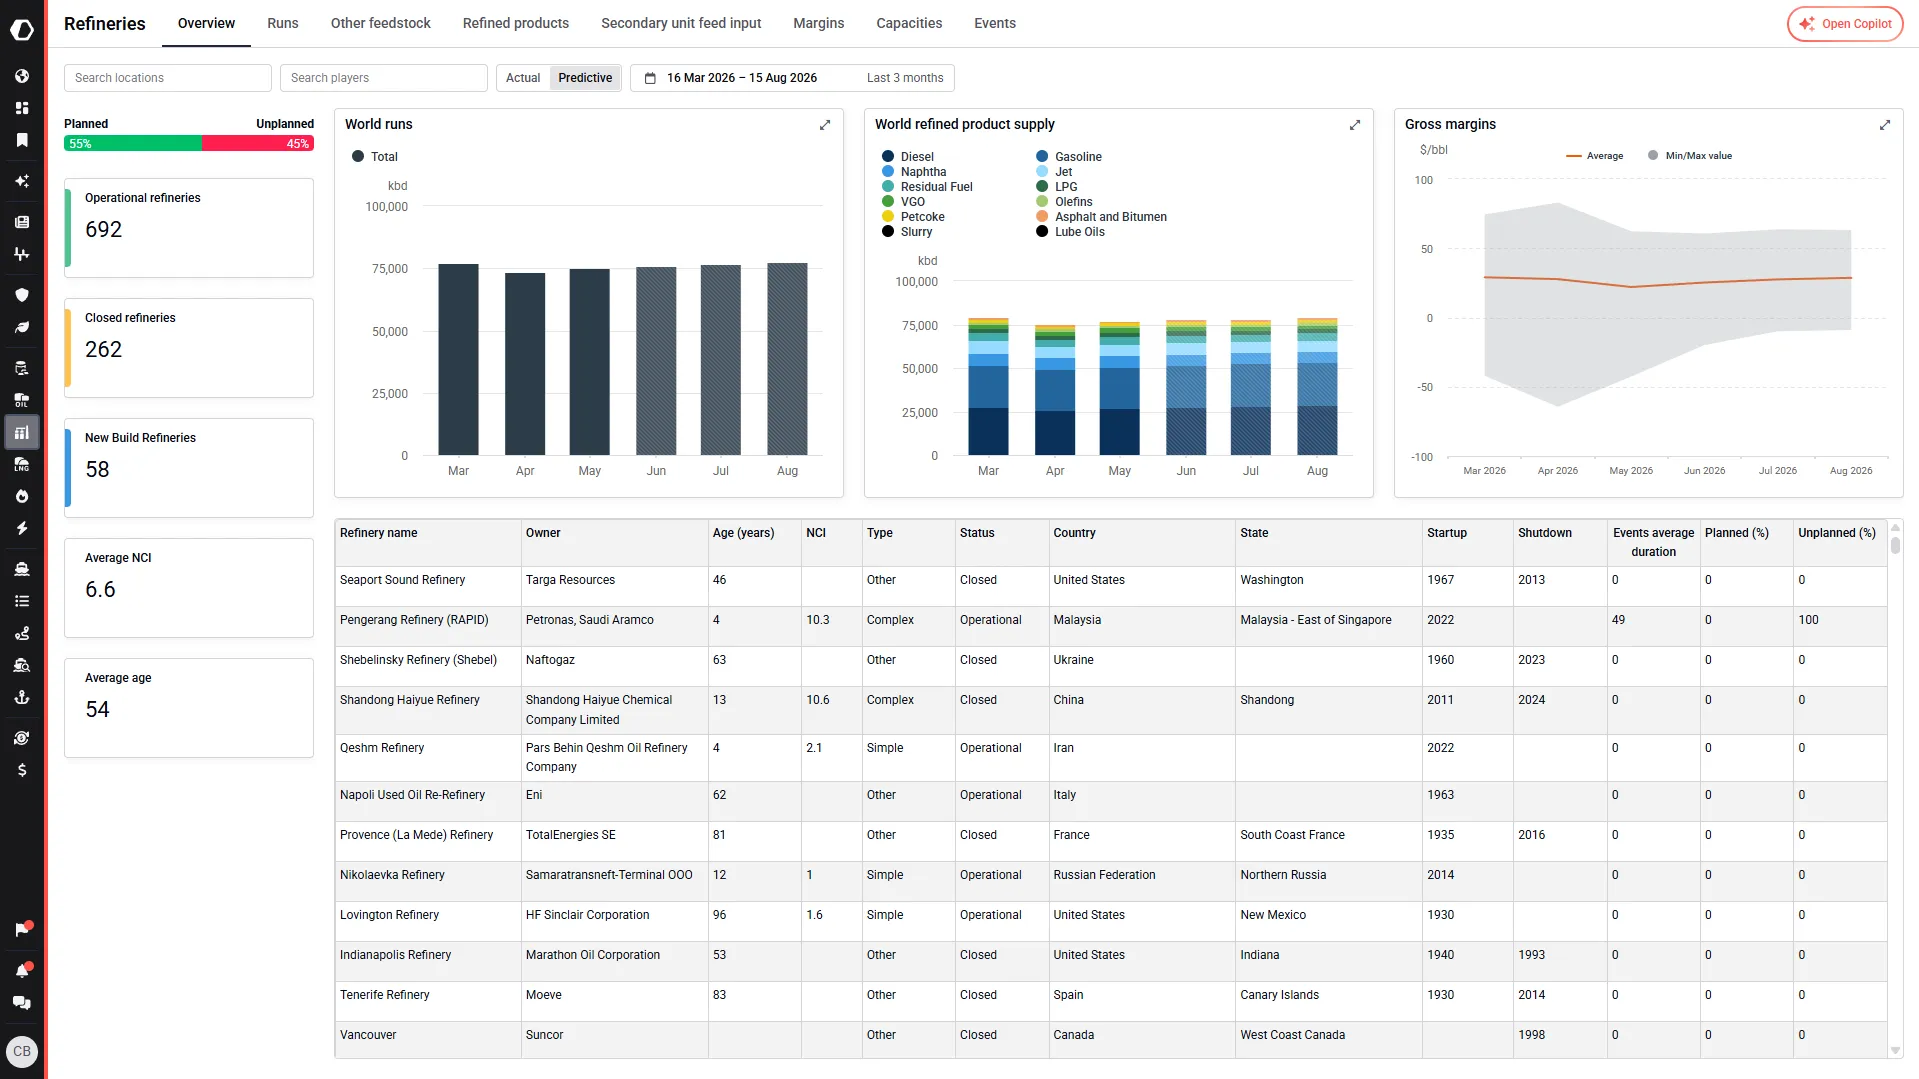
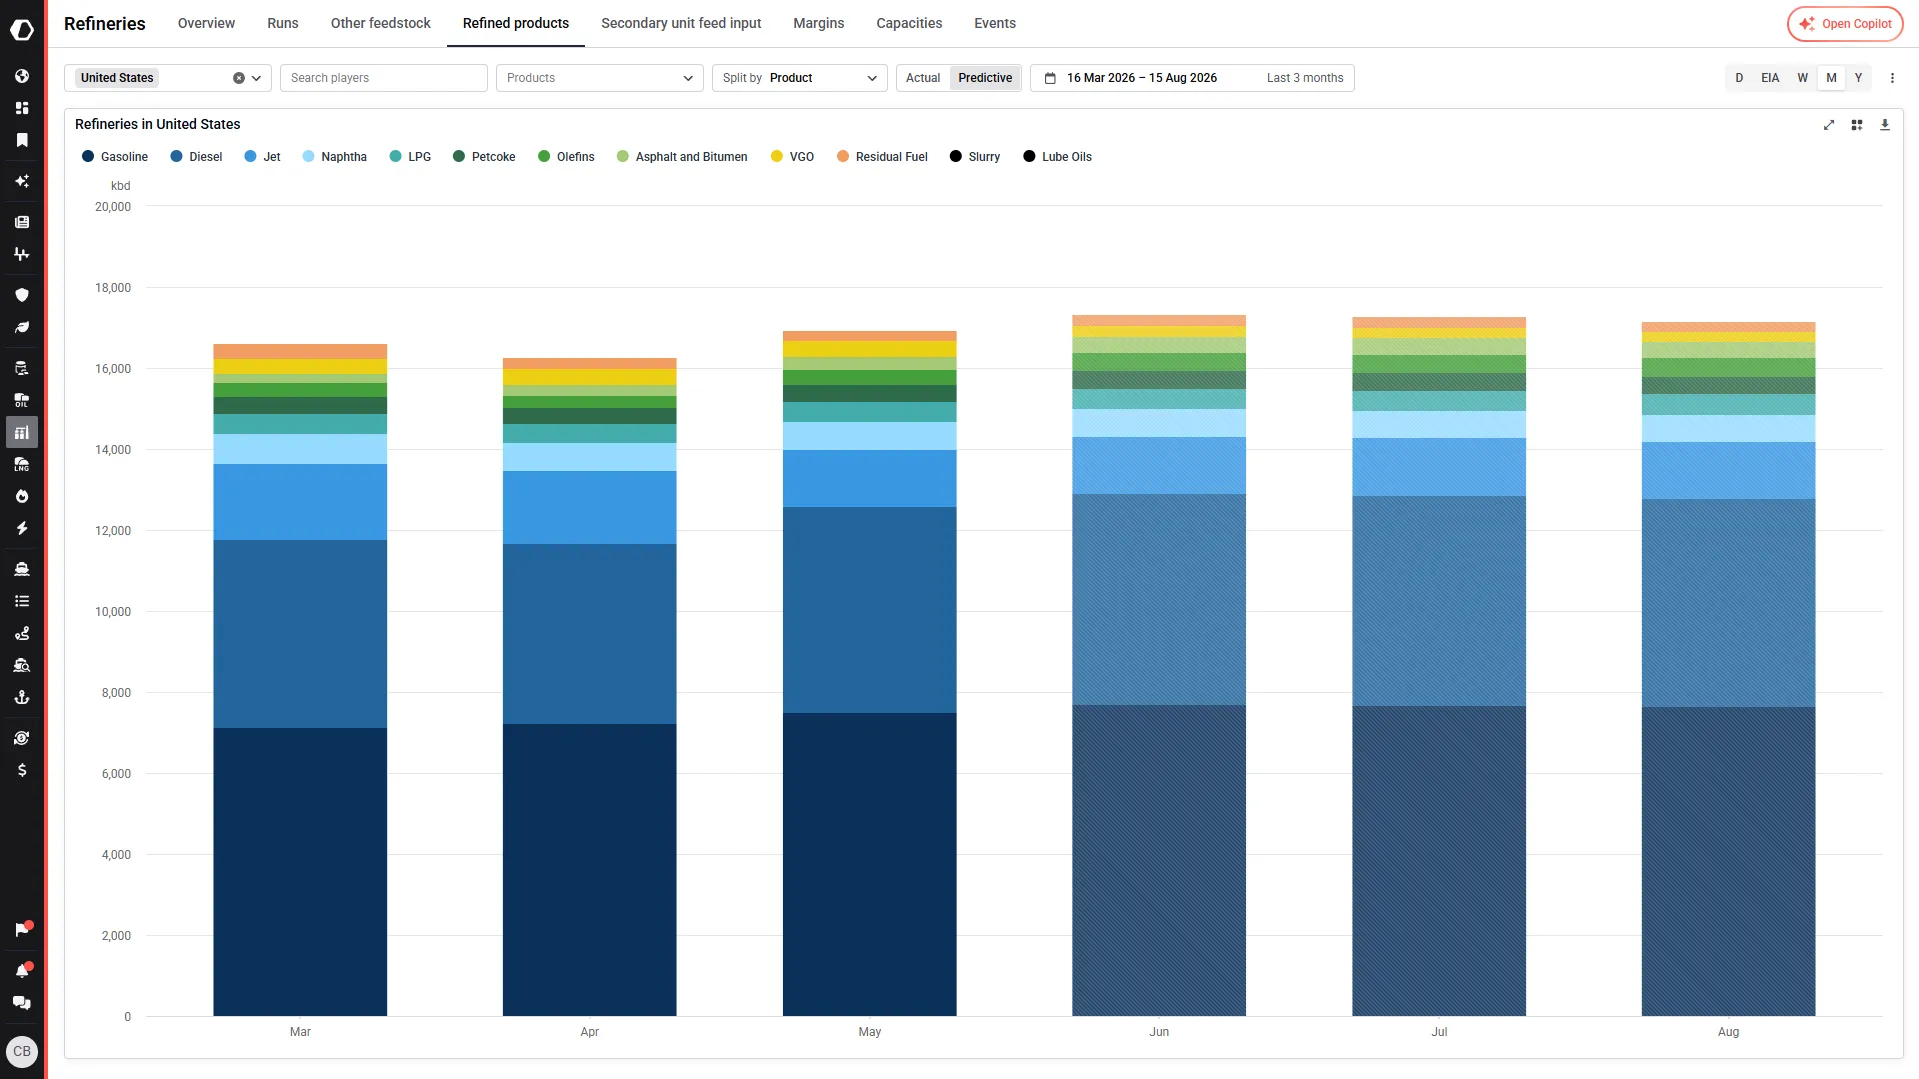
- Gain granular daily production data for 13+ products across the top, middle and bottom of the barrel
- See how geopolitical, refinery maintenance, and other crucial market factors impact product supply in real-time for a competitive edge
- Look across 7+ years of history to determine seasonality and compare year over year production across global refineries
Request demo
- Determine utilisation rates for reformers, fluid catalytic crackers (FCCs), distillate hydrocrackers, and cokers to determine where constraints may lie
- Follow shifting secondary unit inputs to understand how shifting feedstock dynamics are changing the product supply in order to position your strategies for success
- Analyse detailed data across a variety of splits including commercial, geographical and refinery level
Request demo

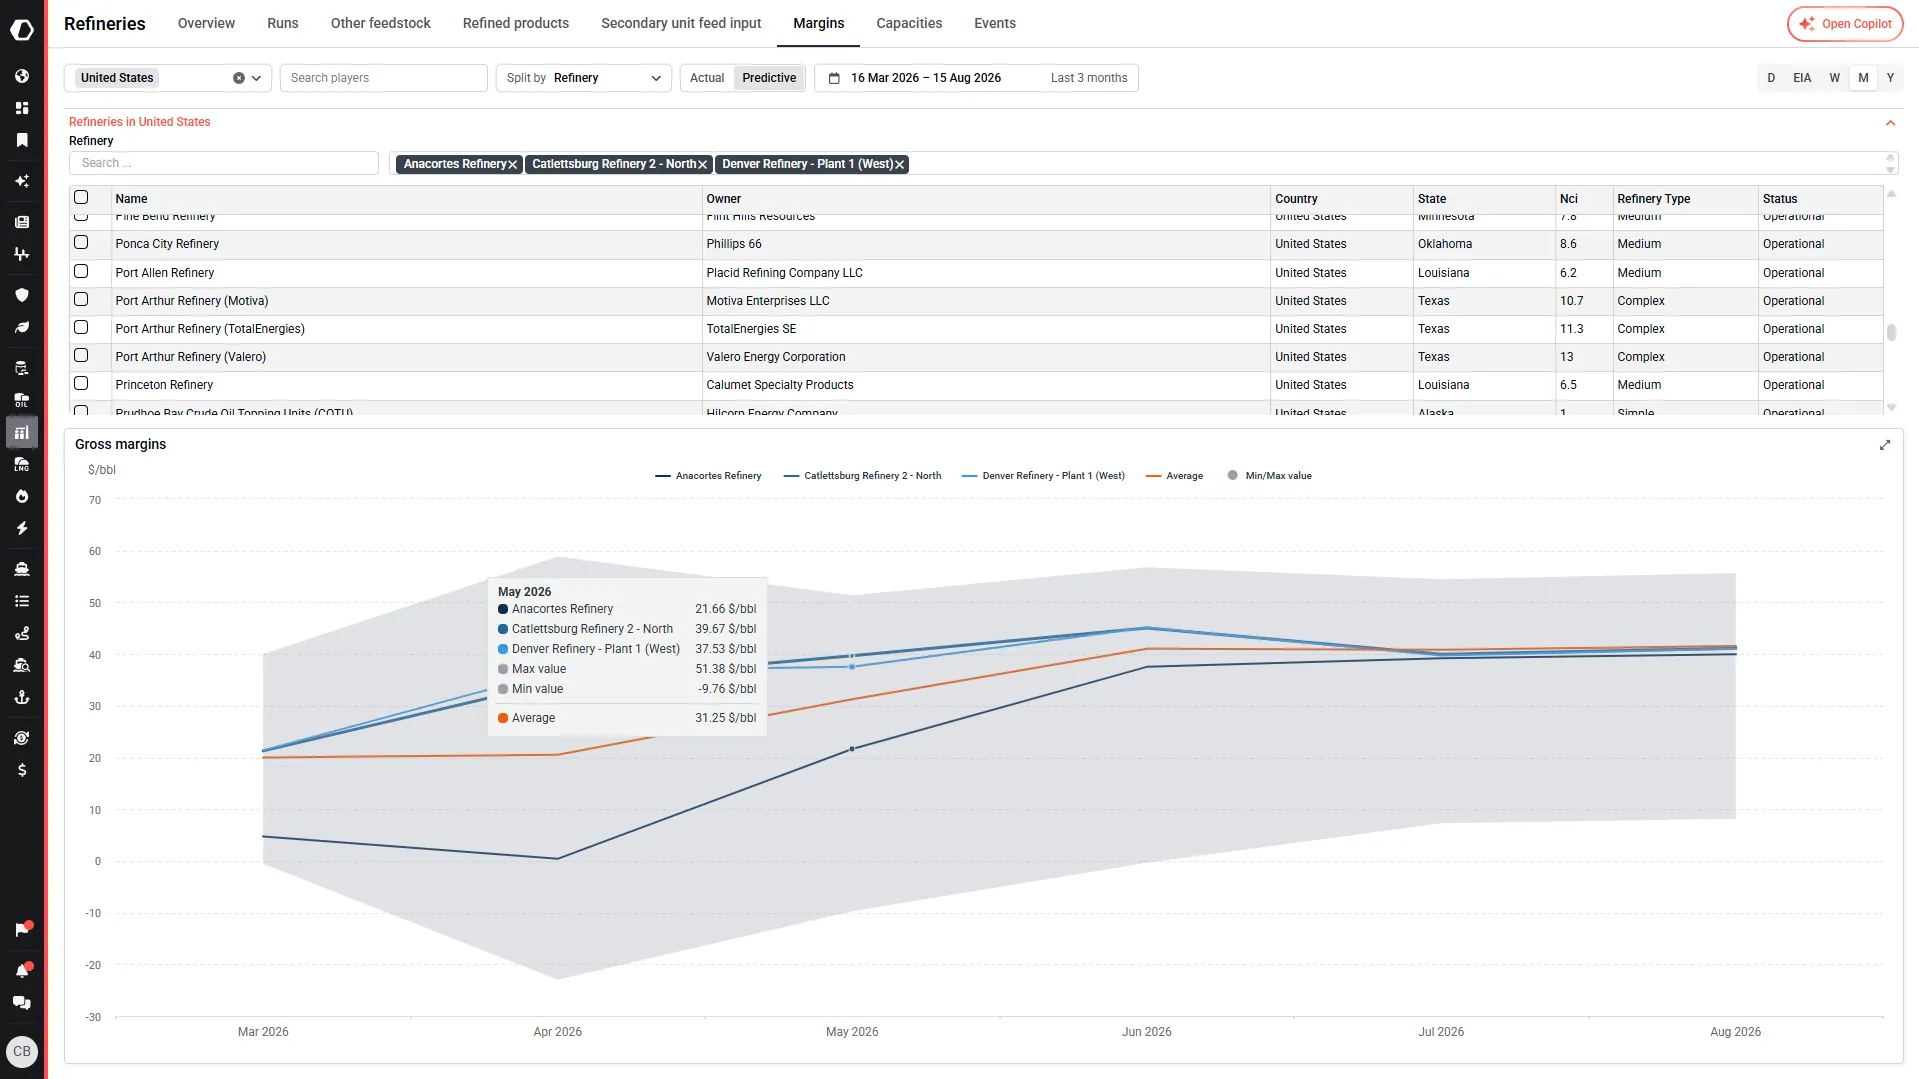
- Receive gross margin data per refinery in $/bbl to monitor your competition and compare players
- Gain crucial insight into this aspect of financial refinery performance and build seasonal analysis with a 7+ year history
- Utilise aggregate gross margin data to build forecasts for trading regions and price trends
Request demo

“Best part? Kpler dashboards. I set up my metrics once, and they update in real-time. I can access the latest insights instantly.”
Broadview Capital
Director of Energy Research, Broadview Capital

.jpg)
FAQ
Get started
How many refineries does Kpler cover worldwide?
Kpler covers more than 900 refineries worldwide, tracking over 100 million barrels per day of primary distillation capacity and more than 500 crude grades.