

End-year push to give way to seasonal softness
Capesize earnings will benefit from a short-term demand surge ahead of year-end, but coal trade constraints and lower ton miles on grain and oilseed trades weigh on the sub-Capesize market.
Market & Trading Calls
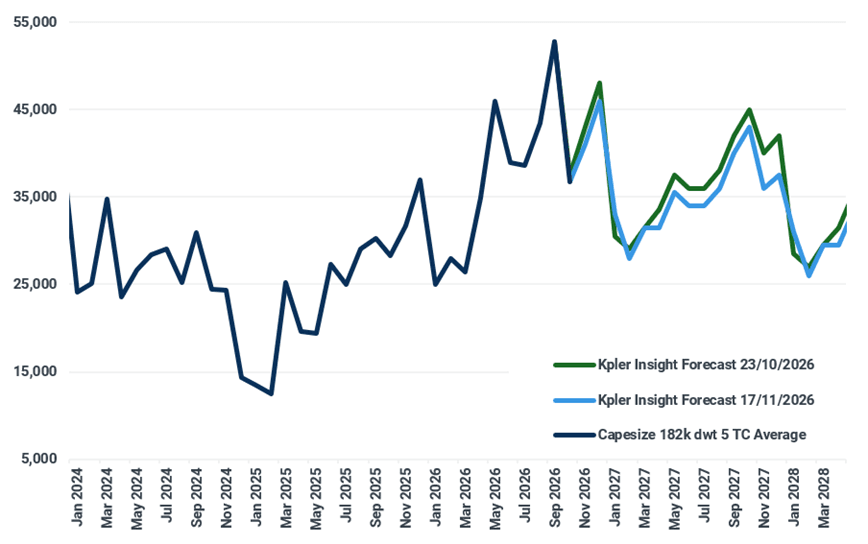
- Capesize: short-term higher, medium-term lower - A tighter Atlantic market and year-end push by Australian iron ore producers will mean a robust end to 2026 before seasonal demand weakness and a surge in newbuilding deliveries pull earnings lower at the start of 2027.
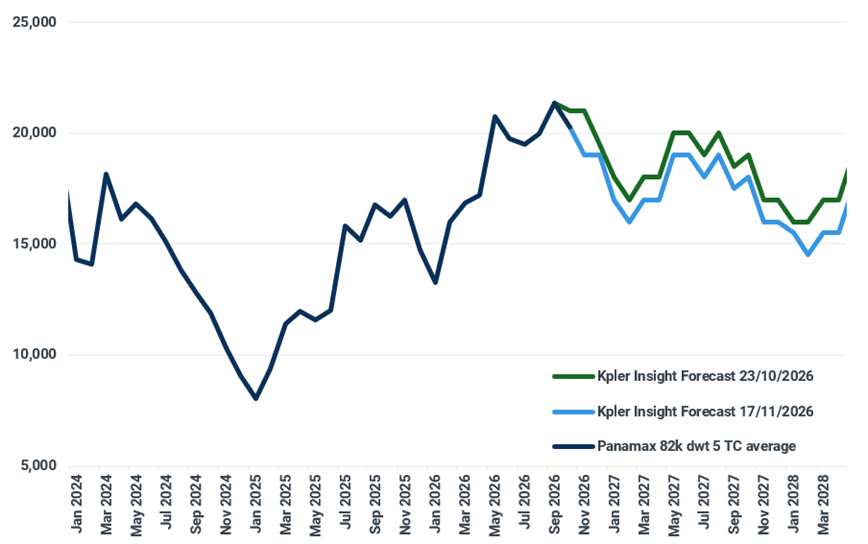
- Panamax: medium-term lower - Competition for coal cargoes in the Pacific weighs on the outlook, but a higher Capesize market would lift the floor for earnings
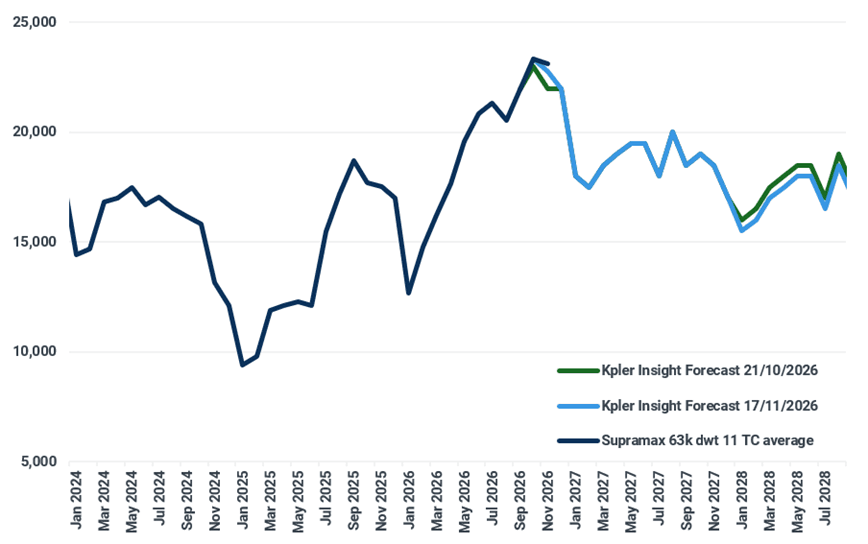
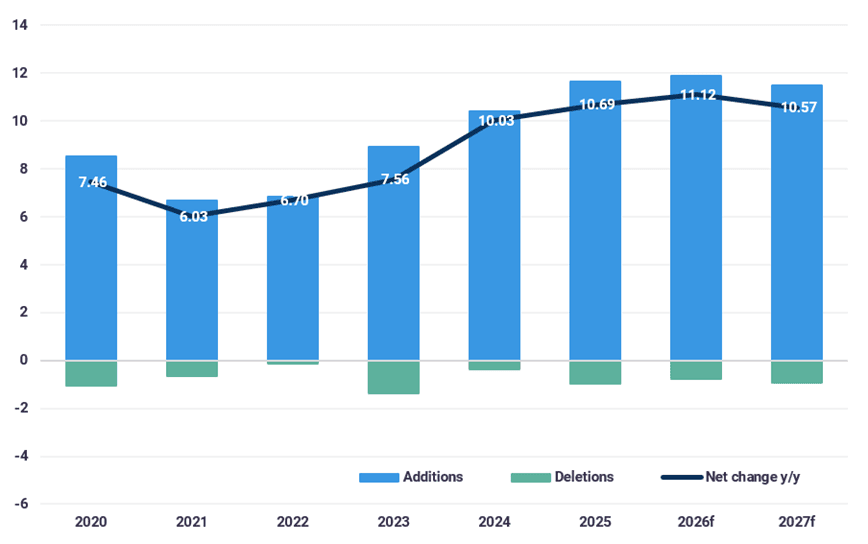
- Supramax: medium-term lower - Increased vessel supply in the Atlantic plus seasonal and structural demand weakness in Pacific mean earnings are expected to ease lower into 2027.
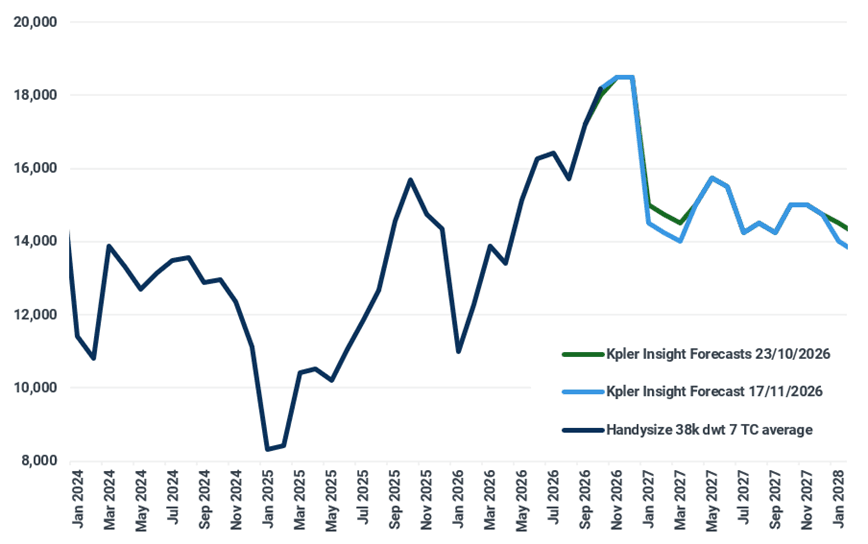
- Handysize: medium-term lower - Seasonal demand weakness will mean earnings fall at the start of 2027, but low supply growth supports the long-term earnings outlook.

Capesizes: Atlantic and Pacific earnings to diverge
A sharp divergence in the short-term demand and supply outlooks for the Atlantic and Pacific basins means we expect to see a widening of the earnings spread between the two basins. An Atlantic earnings surge drove the Capesize market higher in September. The Atlantic:Pacific round-voyage rate ratio is running ahead of typical levels for the period pre-2026 due to increased demand for loadings out of West Africa and higher bunker prices increasing the cost of ballasting.
A dip in Australian iron ore exports and more competition for coal loadings has seen the number of laden Capesizes (100k+ dwt) in the Pacific fall sharply in November, while the ballaster count has climbed. By contrast, in the Atlantic, the reverse has been the case, and vessel availability has tightened. At the same time, the number of ballasting Capesizes making their way across the Indian Ocean to the Atlantic has fallen. With bauxite and iron ore loadings in the Atlantic ramping up, and Colombian and US coal exports remaining above typical levels, tonnage in the basin can tighten, and earnings climb. This forms the basis for our expectation of a strong end to the year for earnings. A seasonal ramp-up in Australian iron ore exports in December may do just enough to keep tonnage in the Pacific and prolong the Atlantic premium.
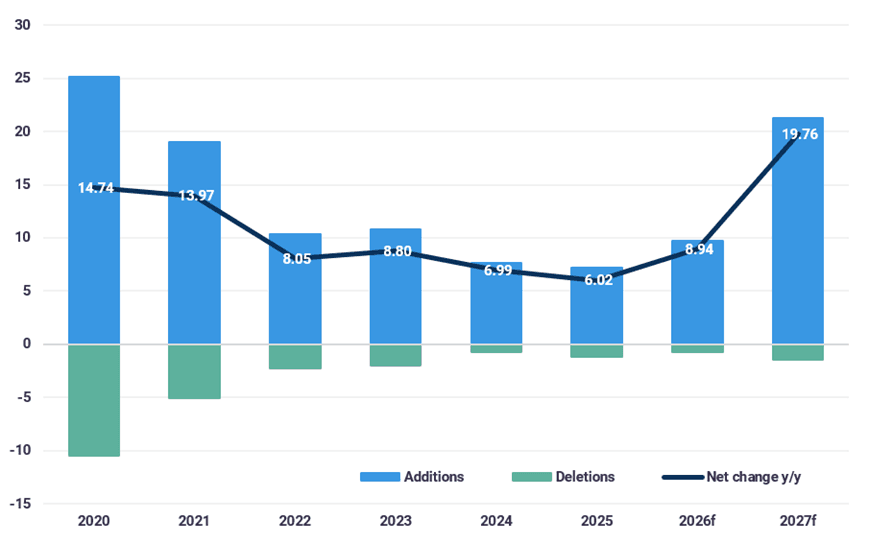
The seasonal drop in Australian iron ore loadings in January, combined with the expected surge in newbuilding deliveries, will put further downward pressure on the Pacific market and drive more ships to ballast to the Atlantic. This will eventually lower the Atlantic premium and bring the overall market lower at the start of the new calendar year, in line with the typical seasonal pattern.
Average Capesize earnings, actual and Kpler Insight forecast ($/day)
Source: Baltic Exchange, Kpler Insight
Capesize (100k+ dwt) newbuilding deliveries and deletions outlook (Mdwt)
Source: Kpler Insight
Download our full earnings and fleet supply outlook
Panamaxes: Pacific weakness as ships compete for coal cargoes
The fundamental outlook for Panamax (68,000-99,999 dwt) earnings is little changed from last month. One notable change is a pushing back of our expectations for the restart of trade from Black Sea ports to the 1q27. Pacific coal trade remains key to the short-term outlook, particularly loadings out of Indonesia, and the ballaster count in both basins is high and will put downward pressure on earnings.
After being driven lower by the plunge in the Capesize market in October, Panamaxes should now benefit from an anticipated year-end push in Capesize chartering activity, which lifts the ceiling for Panamax earnings. With Indonesian coal exports struggling, more ships are heading to Australia looking to load coal. While this will mean Panamaxes reinforce their increased share of this trade, it will prevent any sustained upturn in the Pacific market. Supramaxes are also pricing competitively relative to Panamaxes on Indonesian coal trades, which will cap upside for the larger vessels. The Panamax P5 (South China-Indonesia round-voyage) is priced at $18,906/day vs the Supramax equivalent (S10) at $16,571/day.
We will see more ships heading to US West Coast ports to load soybeans compared with 2026. The switch to West Coast loadings is a ton mile negative for seaborne trade as it is taking volume away from the US Gulf and removes delays queuing if using the Panama Canal.
Average Panamax earnings, actual and Kpler Insight forecast ($/day)
Source: Baltic Exchange, Kpler Insight
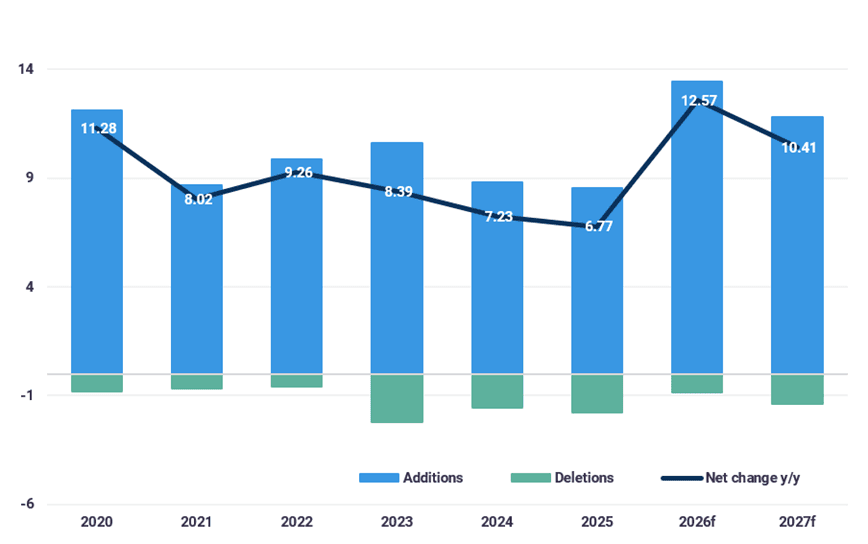
Panamax (68,000-99,999 dwt) newbuilding deliveries and deletions outlook (Mdwt)
Source: Kpler Insight
Supramaxes: Atlantic earnings to soften on more vessel supply and Panamax competition
The Atlantic Supramax (44,000-67,999 dwt) market has swung to a premium vs the Pacific thanks to a surge in US Gulf rates which have spiked higher since the start of November. This trend is a consequence of vessel supply tightness, as opposed to an upturn in demand and is therefore vulnerable to the arrival of more ships in the basin. US soybean loadings from Gulf ports are outperforming the low 2025 base but remain well below 2024. A switch to load a greater proportion of cargoes from US West Coast ports compared to 2025 has also hit demand for ships in the Gulf.
The number of ballasting Supramaxes in the Indian Ocean remains high, and a growing number are heading west to the Atlantic. As a result, we do not expect the Atlantic earnings premium to be sustained beyond the short term. Competition from keenly priced Panamaxes will also put pressure on the Supramax market. The Panamax Atlantic round-voyage rate is priced at $18,550/day compared with an implied Supramax equivalent of $26,799/day (average of S4A and S4B).
At the same time, Supramaxes in the Indian Ocean are competing for Indonesian coal cargoes, Chinese steel exports, and other minor bulks. This strong supply outlook is occurring alongside a seasonal weakening in Philippines nickel ore exports that is taking demand out of the basin. Consequently, we see earnings easing lower through to the end of the year.
Average Supramax earnings, actual and Kpler Insight forecast ($/day)
Source: Baltic Exchange, Kpler Insight
Supramax (44,000-67,999 dwt) newbuilding deliveries and deletions outlook (Mdwt)
Source: Kpler Insight
Handysize: No return to the Black Sea cuts Handysize demand, but low fleet growth supports medium-term earnings outlook
An upturn in French wheat loadings to replace disrupted Black Sea cargoes has bolstered demand for Handysizes (10,000-43,999 dwt), and to a lesser extent Supramaxes, in Northwest Europe. This trade is expected to remain steady through the remainder of 2026 and into the 1q27. Handysizes are also being utilised to load the redirected Russian grain cargoes being shipped out of the country’s northern ports. Nevertheless, it remains the case that the loss in demand from the Black Sea is a net negative for seaborne grain markets. The pushing back of our base case for the return of Black Sea trade to the 1q27 means a lower demand outlook for Handysizes and a softer start to 2027 for earnings.
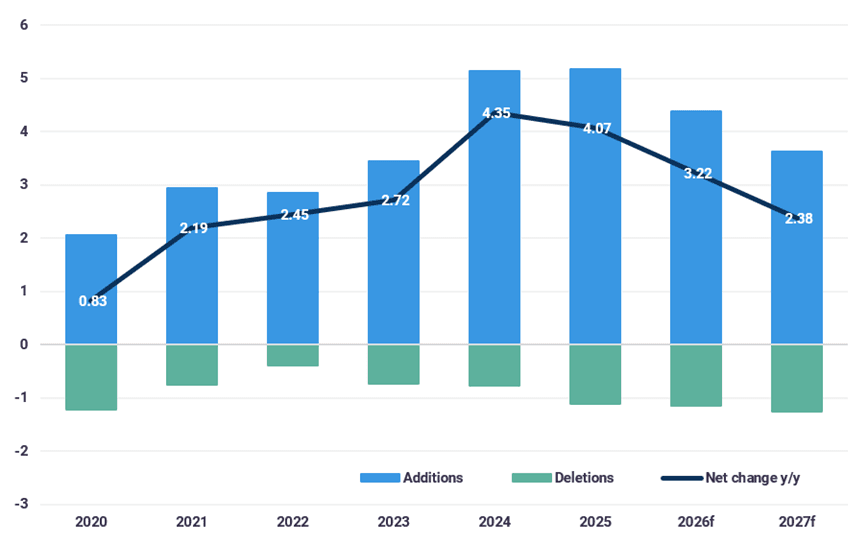
Providing support to earnings is the smallest orderbook (7.99Mdwt) of the four main vessel classes in both absolute terms and as a percentage of the trading fleet, just 8%. This reflects both a lack of ordering and a general trend of increasing vessel sizes. Handysize newbuilding deliveries are expected to dip to a three-year low of 3.63Mdwt in 2027 and fall further in 2028. At the same time, scrapping is running ahead of recent years and, topped up by losses due to ongoing conflicts in the Middle East and Black Sea, removals are set to hit a multi-year high in 2026. We expect removals to be similarly strong in 2027.
Average Handysize earnings, actual and Kpler Insight forecast ($/day)
Source: Baltic Exchange, Kpler Insight
Handysize (10,000-43,999 dwt) newbuilding deliveries and deletions outlook (Mdwt)
Source: Kpler Insight
Demand & Supply Drivers
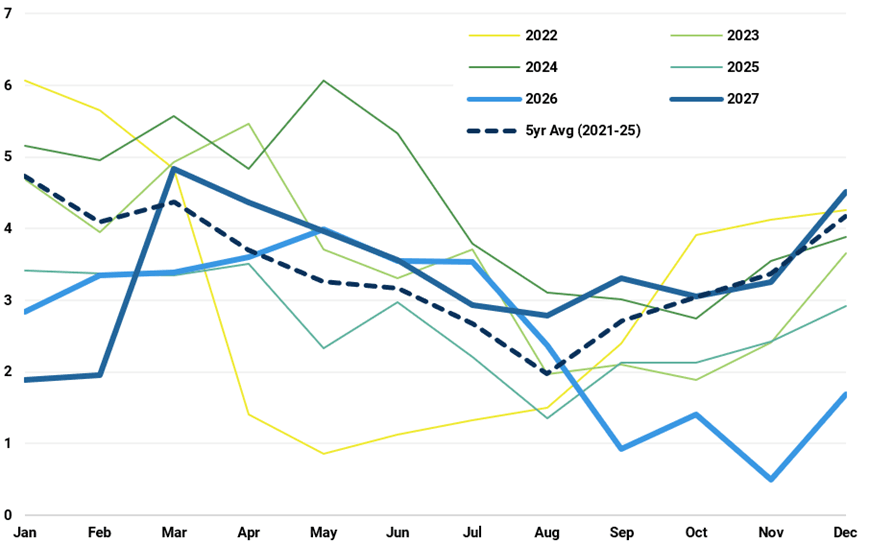
- Grain carrying bulker demand will continue to be curtailed by the close-to-complete shutdown of trade out of the Black Sea. We are not seeing a repeat of the Russian wheat shipments of 2025. Drone attacks on ships in Romanian waters and attempts to destroy the Kerch Bridge signal a continuation of the stalemate. Ukraine is able to move some cargoes via the Danube, and Russia has diverted shipments to its northern ports; overall volumes and ton miles are down y/y. We do not expect volumes to pick up until the end of the 1q27. An upturn in French grain exports, compensating for Black Sea constraints, has mitigated some of the lost Handysize and Supramax demand. However, at the same time, Atlantic demand is being cut by a slowing in the pace of US soybean loadings and a greater share of cargoes coming out of ports in the Pacific Northwest. This may be a response to transit restrictions at the Panama Canal earlier in the year. Grains remain key to the Supramax outlook after a loss of share on coal trades. The high outlook for South American seaborne exports in 2027 supports our robust earnings forecasts.
Ukrainian grain exports not expected to pick up until the end of the 1q27 (Mt)
Source: Kpler Insight
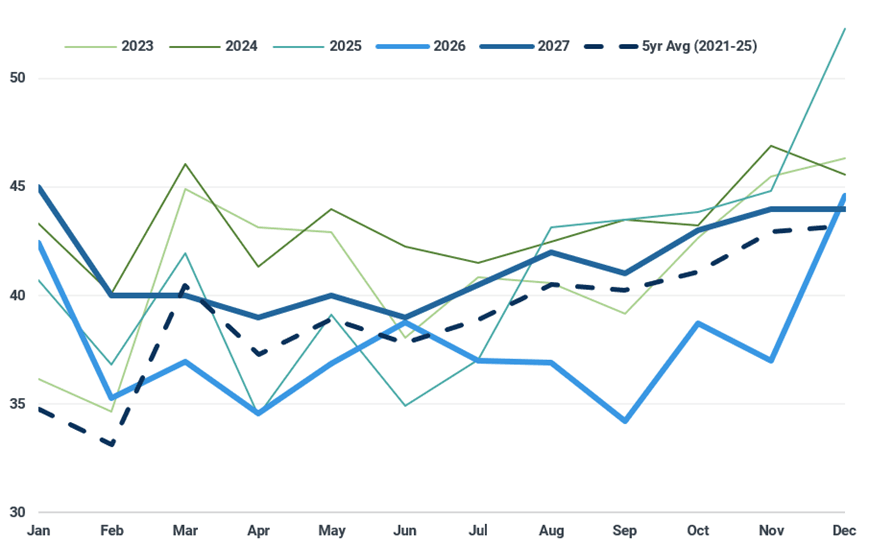
- Indonesian thermal coal remains key to the demand outlook for dry bulk carrier demand in the Pacific. At 40.11Mt, October exports were down by 5.86Mt y/y. Although rains have improved water levels on routes for barging coal to export loading zones, government policy and permitting could still curb supply. Our 2027 export outlook for Indonesia and most other major coal export trades is unchanged from last month. Exports from Western Russia remain constrained by war in the Black Sea and competition from grains on rail routes to Northern ports. Consequently, we expect continued demand for Colombian, South African, and US cargoes to substitute for this disruption. The fall in timecharter rates and bunker prices from September/October highs has improved the competitiveness of Atlantic coal in Pacific markets. Robust global thermal coal prices mean Chinese domestic coal is competitive in markets in the south of the country. This is weighing on import demand and boosting the demand for Chinese-flagged geared bulkers on coastal coal trades.
Indonesian thermal coal exports projected higher y/y through 2027 (Mt)
Source: Kpler Insight
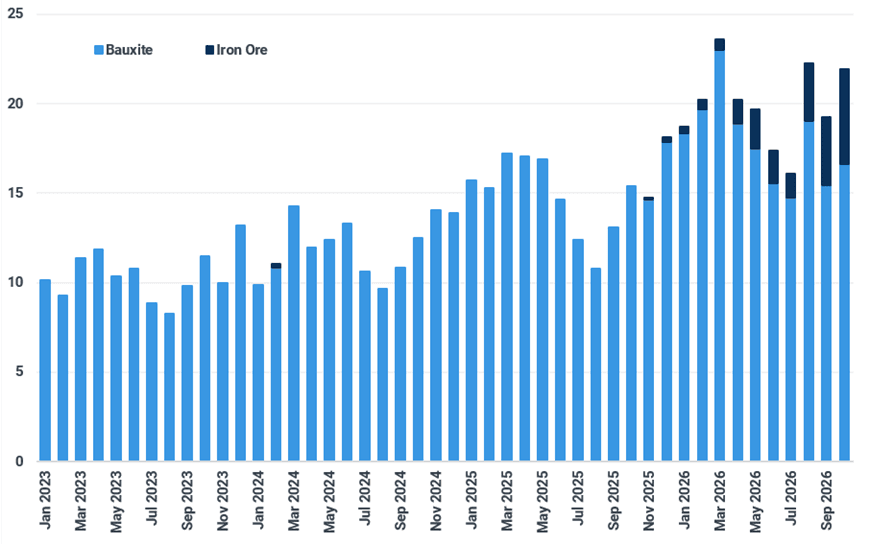
- Guinean bauxite exports should climb m/m in November, with a strong lineup of ships heading to West Africa to load. At 17.16Mt, October exports were 1.77Mt higher y/y. Exports will comfortably outpace 2025 through November and December before flattening in the 1q27. As anticipated, precipitation in Guinea has returned to the seasonal pattern and reduced sharply since mid-October, easing the movement of bauxite (and iron ore). It remains our base case that there will not be any significant restrictions on bauxite exports in Guinea in the short or medium term. Although low bauxite prices continue to frustrate the government, we believe administrators will prioritise jobs and foreign exchange over curbing volumes.
- Our seaborne iron ore outlook is almost unchanged from last month. Demand for Capesize loadings should be almost unchanged y/y through November and December however, higher West African shipments and lower volumes from Australia will mean a ton mile increase. Demand for Capesize loadings will then accelerate in the 1q27 with around 25Mt y/y of growth, and more ton miles. However, there are a number of pressure points on the market. Higher freight costs (even after recent declines) have squeezed margins for Canadian and smaller Brazilian exports. The latter do not benefit from the economies of scale and hedging provided by a large, chartered fleet such as the one Vale operates. This is at a time when miners face higher costs of supplies such as diesel. There is also downside risk to FMG exports due to the lack of a deal with CMRG on access to the Chinese market.
Guinean bauxite and iron ore exports build in October (Mt)
Source: Kpler
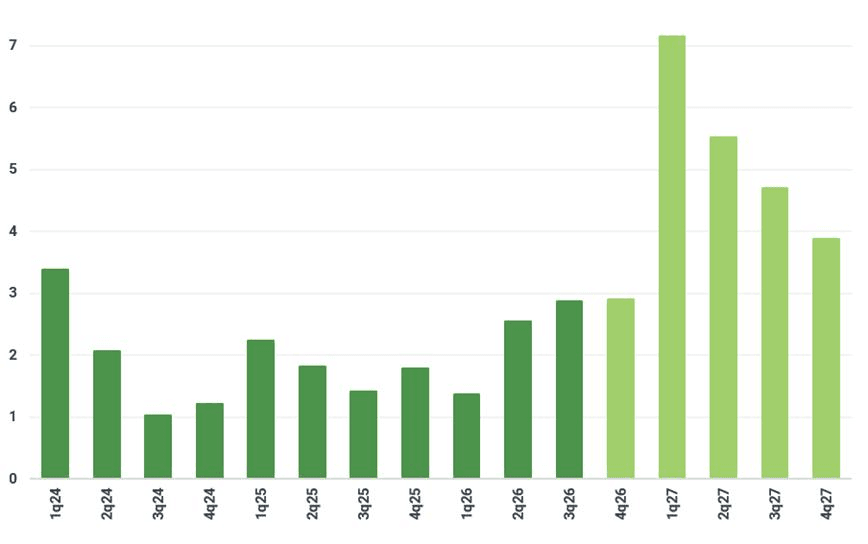
- We expect a surge in Capesize (100k+ dwt) newbuilding deliveries at the start of 2027 that will boost supply in the Pacific basin and put downward pressure on earnings. Capesize deliveries are projected to exceed 7Mdwt in the 1q27, a multi-year high, if historical delivery patterns are repeated. Annual deliveries in 2026 are projected at 9.68Mdwt. After an upward revision to September deliveries and updates to the construction status of some of the Capesize orderbook, we have reduced our slippage rate for Capesize in 2026. However, it remains high by historical standards. In sharp contrast, projected 1q27 Handysize (10,000-43,999 dwt), Supramax (44,000-67,999 dwt), and Panamax (68,000-99,999 dwt) deliveries are expected to be in line with the 1q26. With trade growth expected in coal, grains, and minor bulks in 2027, this supports our robust earnings outlook for the sub-Capesize market.
Capesize (100k+ dwt) newbuilding deliveries set to surge in 2027 (Mdwt)
Source: Kpler Insight
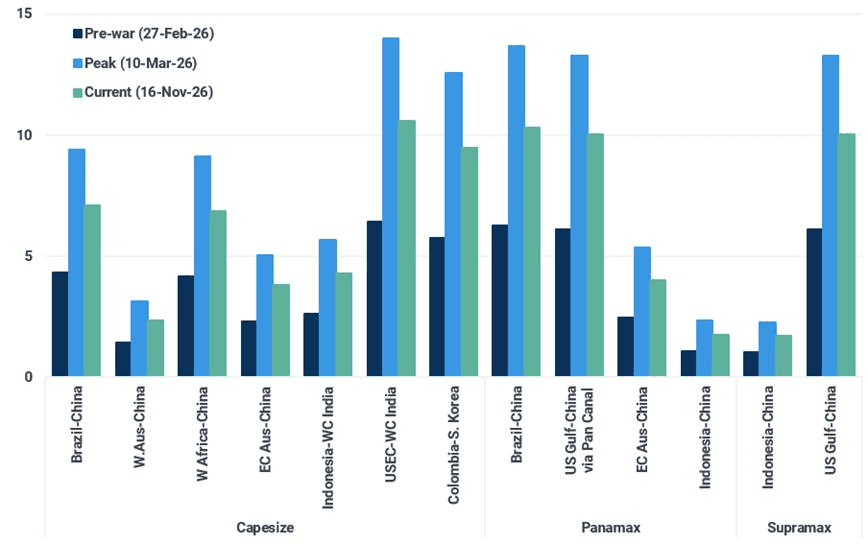
- Further falls in oil prices over the coming months will bring down bunker prices and put downward pressure on dry bulk spot voyage rates. The highest OPEC+ crude oil production since the start of the war in the Middle East and optimism that Democrat victories in the US midterm elections constrain the Trump regime’s ability to escalate fighting in the Middle East have pulled down prices. This has meant a drop of $0.82/t in the bunker cost of a Brazil-China Capesize iron ore spot voyage rate for a 170kt stem since our last report on 23 October. The equivalent voyage for a 66kt Santos-China grain stem has seen a drop of $1.19/t over the same period.
The bunker price effect on dry bulk spot voyage rate: bunker cost for major voyages ($/t)
Sources: Baltic Exchange, Kpler Insight
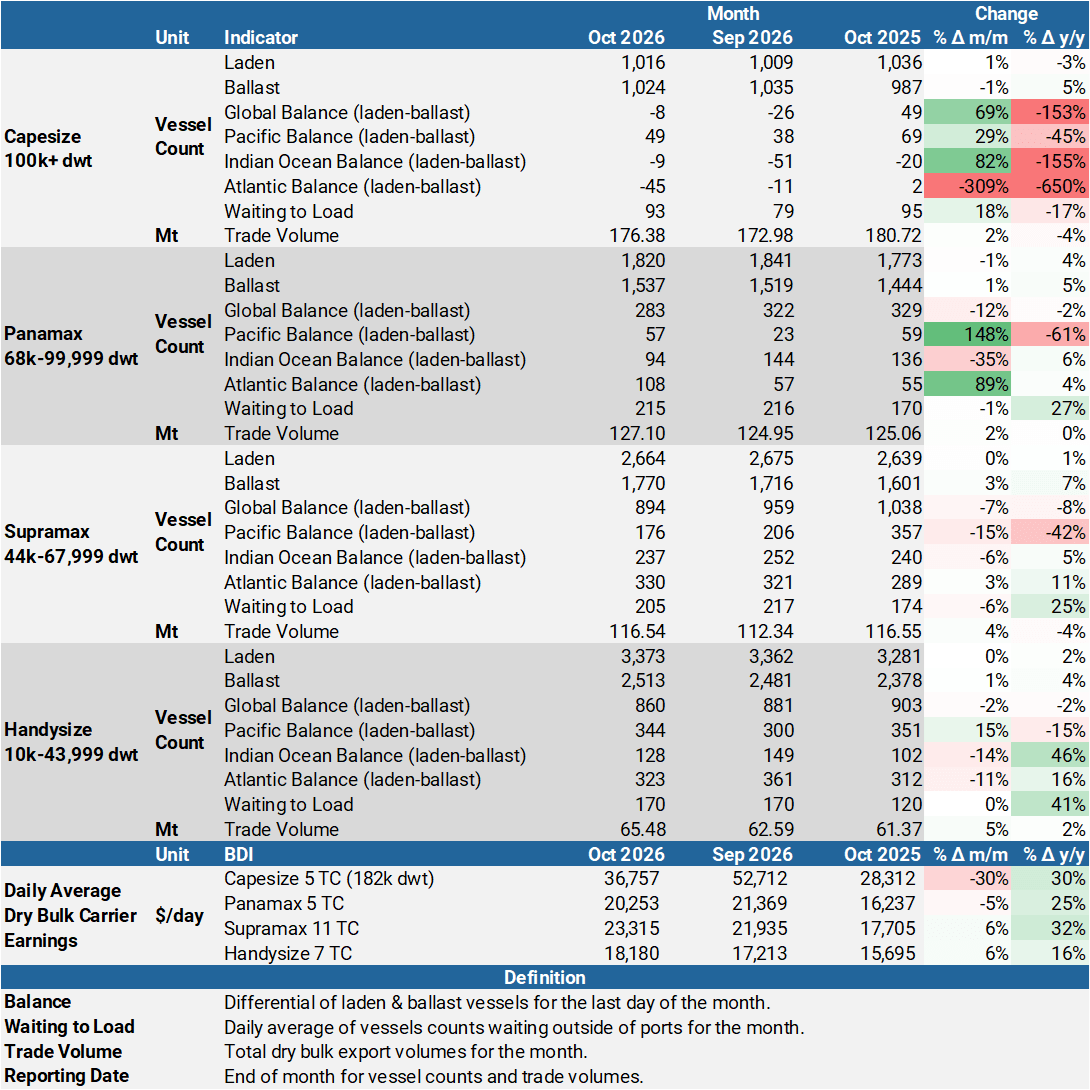
Dry Bulk Freight Metrics
Source: Kpler Insight, Baltic Exchange
Dry Bulk Demand Charts
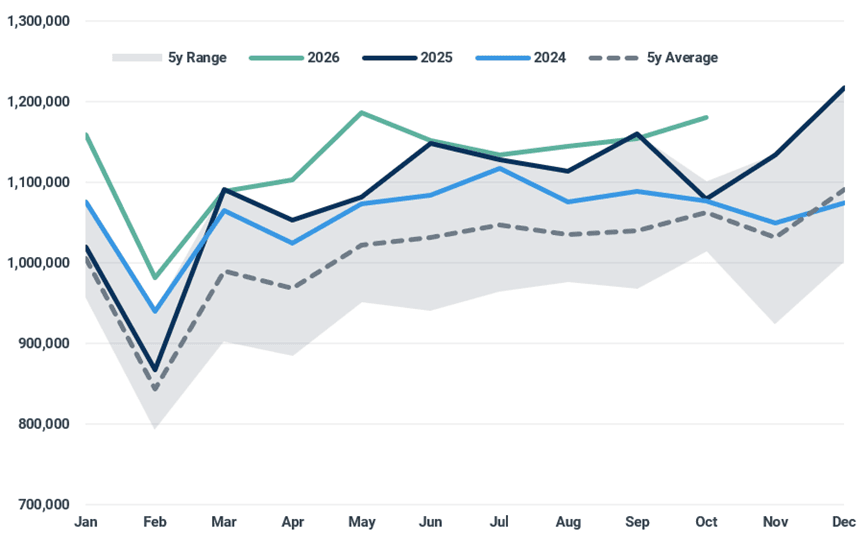
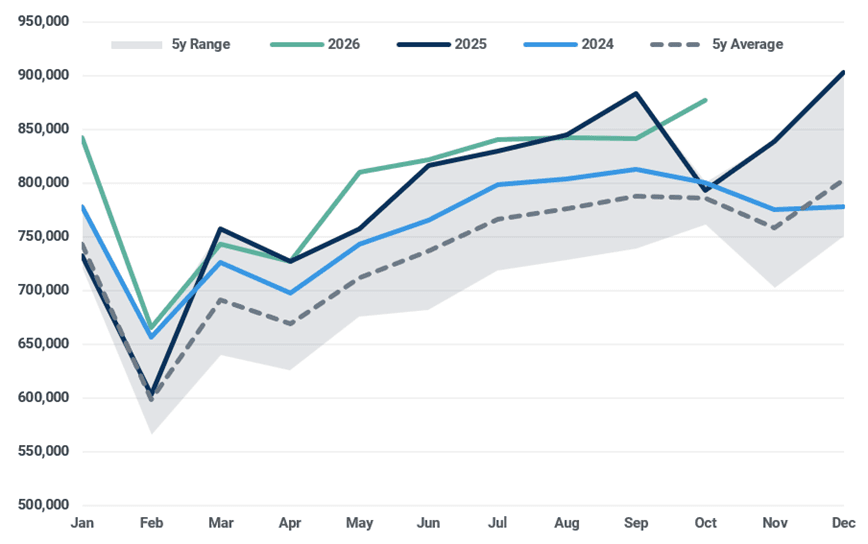
All October 2026 data is preliminary.
Capesize (100,000+ dwt) ton mile demand: all dry bulk (million ton miles)
Source: Kpler Insight
Capesize (100,000+ dwt) ton mile demand: iron ore (million ton miles)
Source: Kpler Insight
Capesize (100,000+ dwt) ton mile demand: coal (million ton miles)
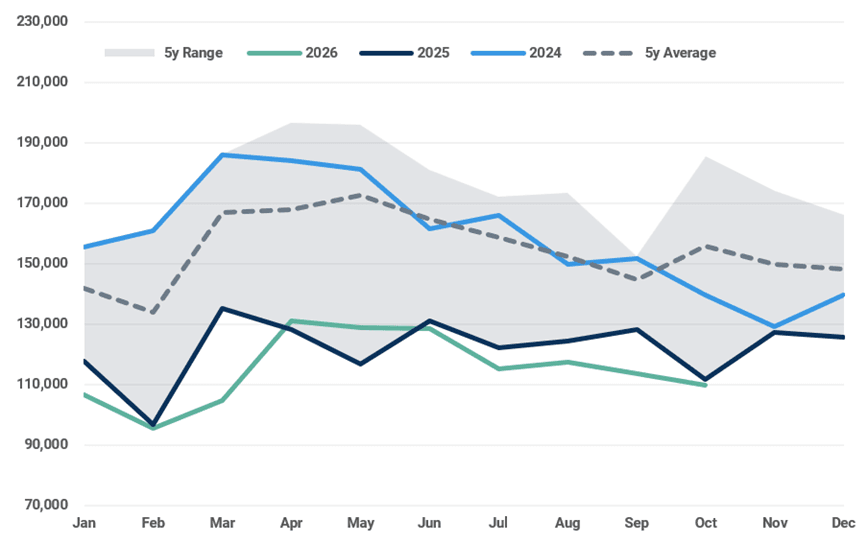
Source: Kpler Insight
Capesize (100,000+ dwt) ton mile demand: bauxite (million ton miles)
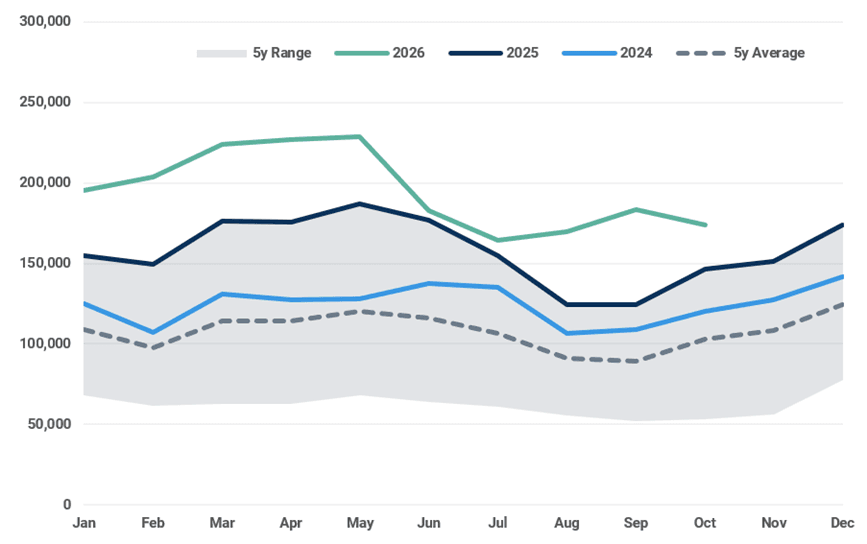
Source: Kpler Insight
Panamax (68,000-99,999 dwt) ton mile demand: all dry bulk (million ton miles)
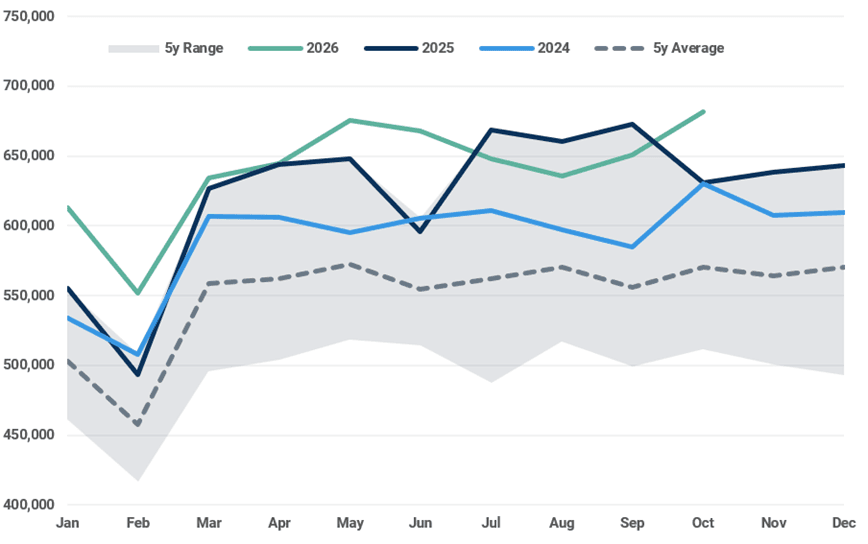
Source: Kpler Insight
Panamax (68,000-99,999 dwt) ton mile demand: coal (million ton miles)
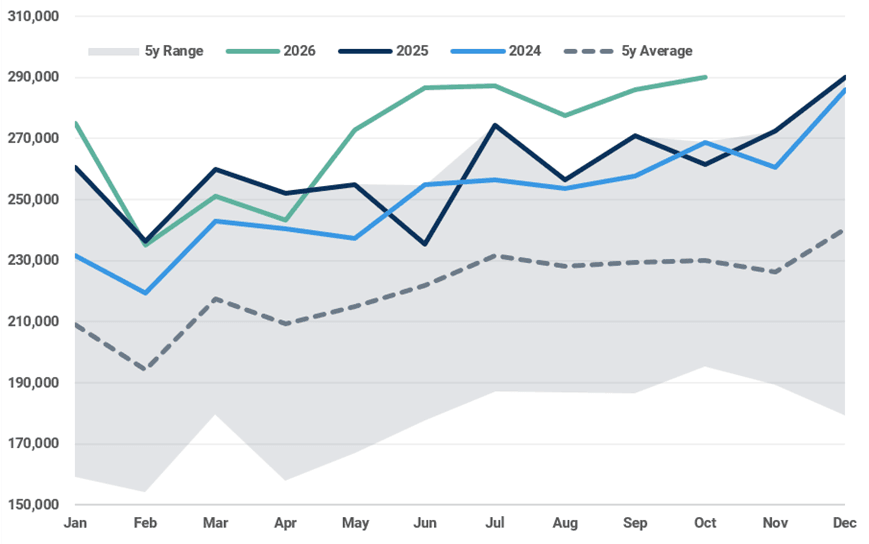
Source: Kpler Insight
Panamax (68,000-99,999 dwt) ton mile demand: grains & oilseeds (million ton miles)
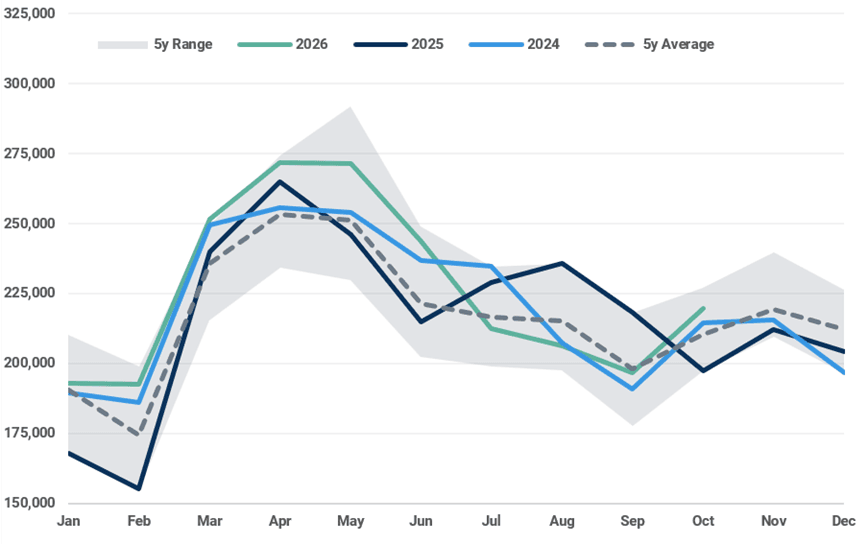
Source: Kpler Insight
Panamax (68,000-99,999 dwt) ton mile demand: minor bulks (million ton miles)
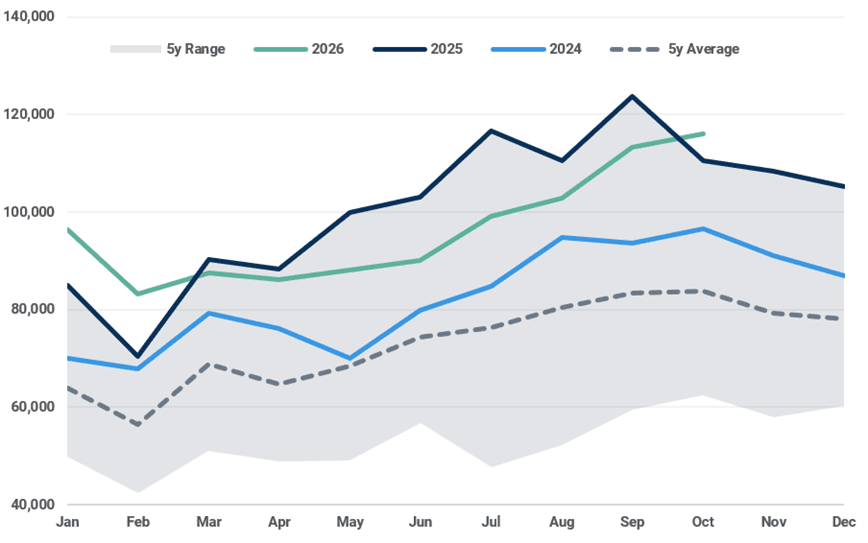
Source: Kpler Insight
Supramax (44,000-67,999 dwt) ton mile demand: all dry bulk (million ton miles)
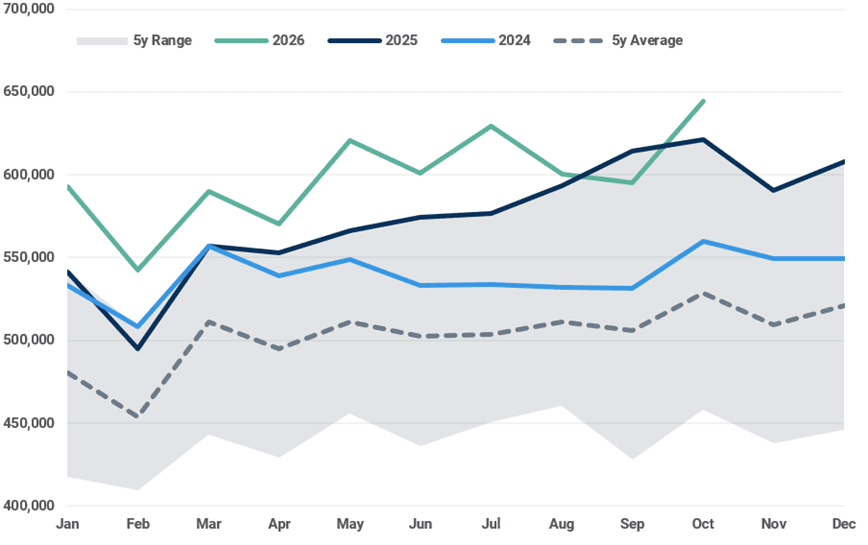
Source: Kpler Insight
Supramax (44,000-67,999 dwt) ton mile demand: coal (million ton miles)
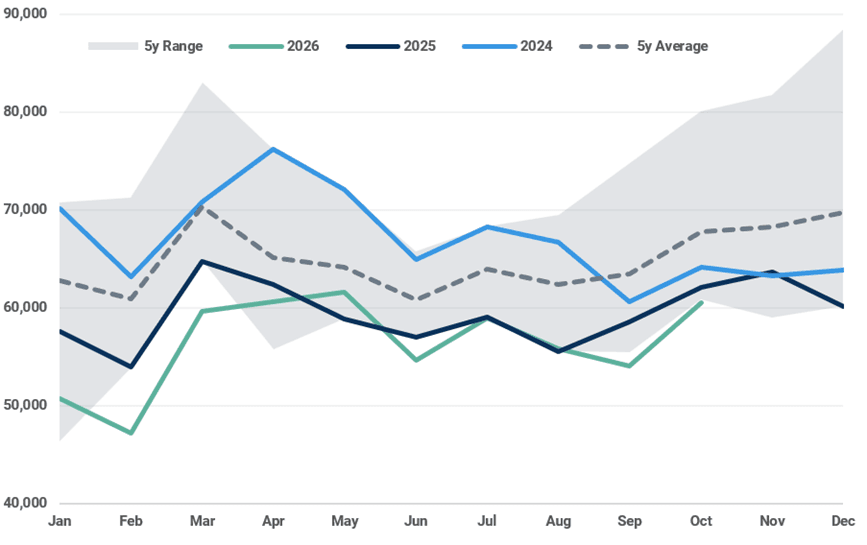
Source: Kpler Insight
Supramax (44,000-67,999 dwt) ton mile demand: grains & oilseeds (million ton miles)
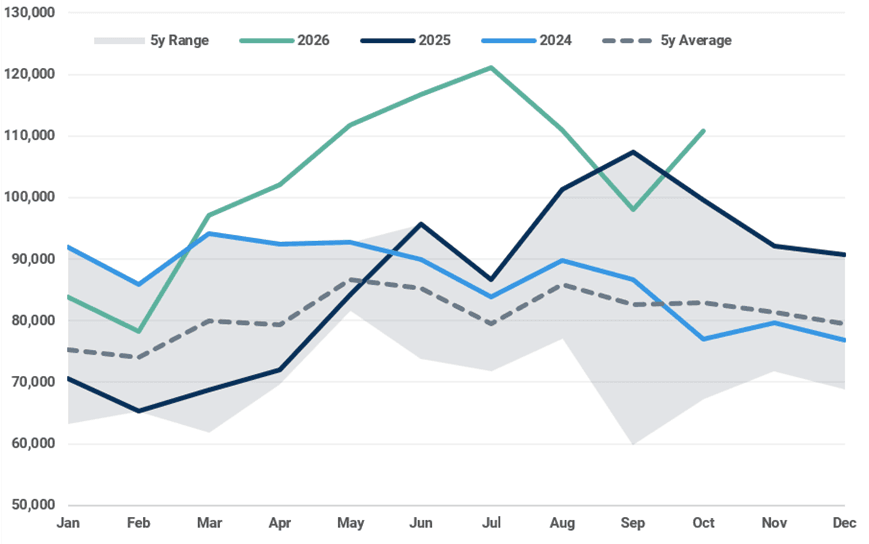
Source: Kpler Insight
Supramax (44,000-67,999 dwt) ton mile demand: minor bulks (million ton miles)
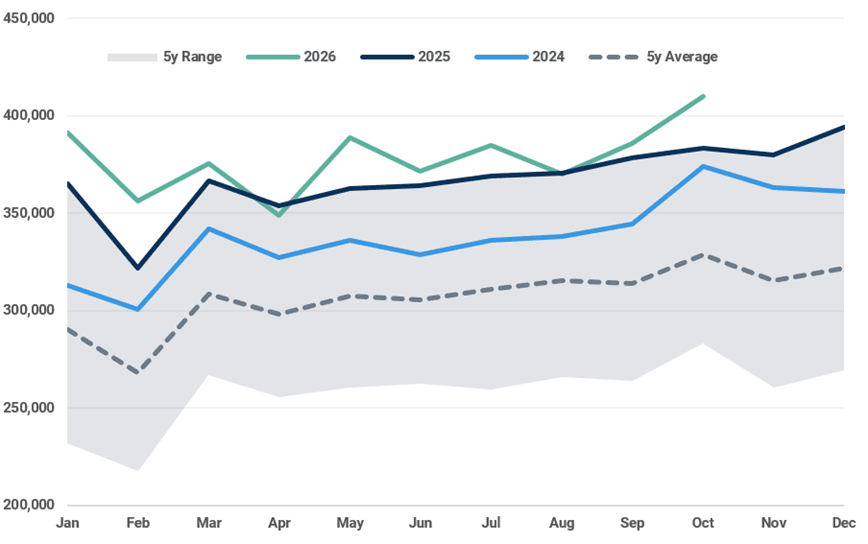
Source: Kpler Insight
Handysize (10,000-43,999 dwt) ton mile demand: all dry bulk (million ton miles)
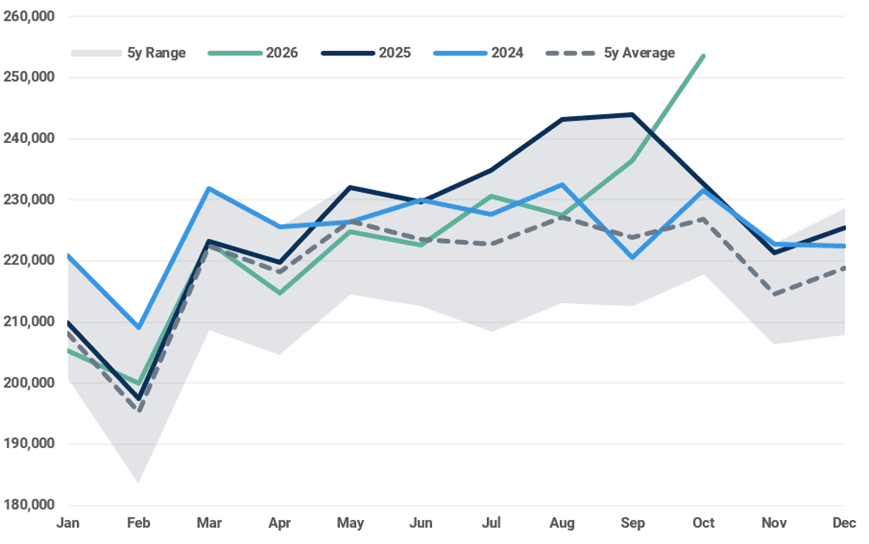
Source: Kpler Insight
Handysize (10,000-43,999 dwt) ton mile demand: coal (million ton miles)
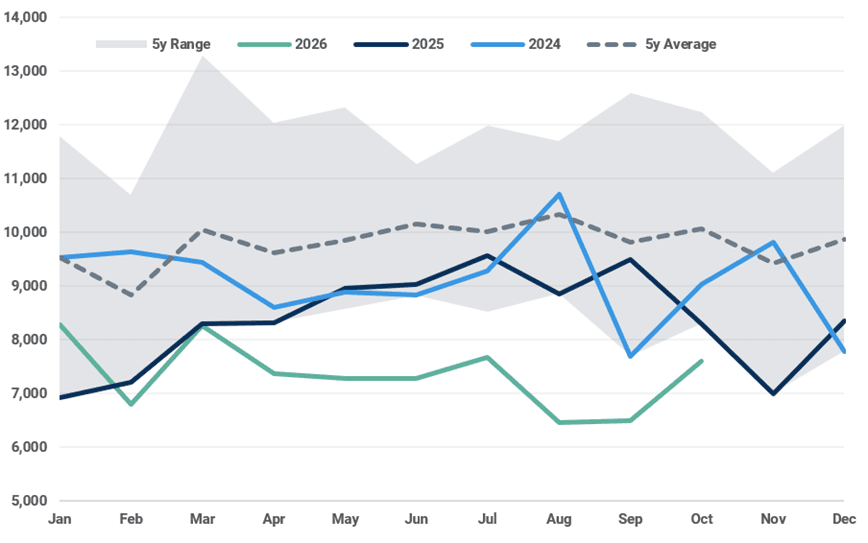
Source: Kpler Insight
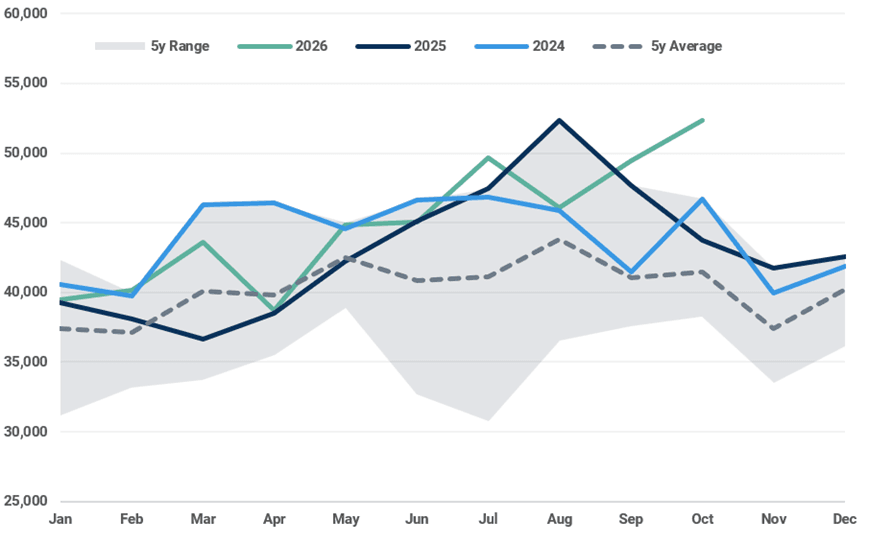
Handysize (10,000-43,999 dwt) ton mile demand: grains & oilseeds (million ton miles)
Source: Kpler Insight
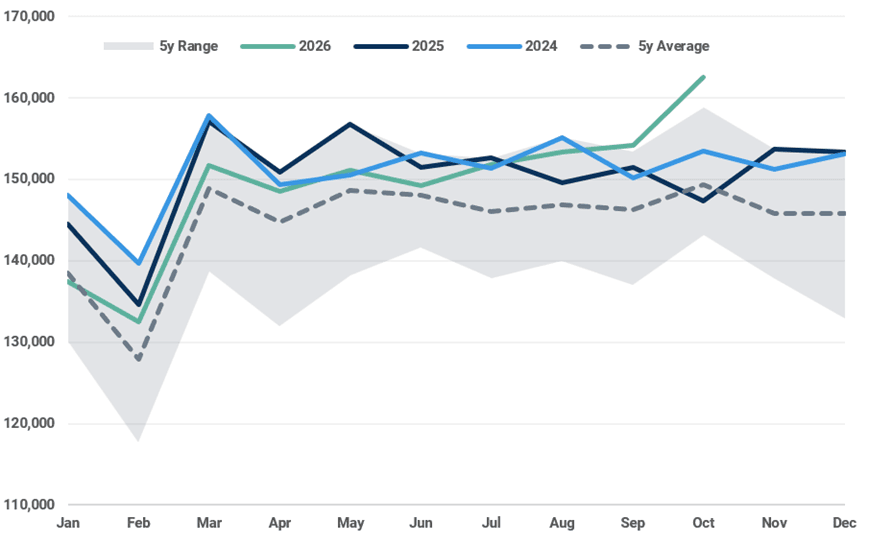
Handysize (10,000-43,999 dwt) ton mile demand: minor bulks (million ton miles)
Source: Kpler Insight

See why the most successful traders and shipping experts use Kpler