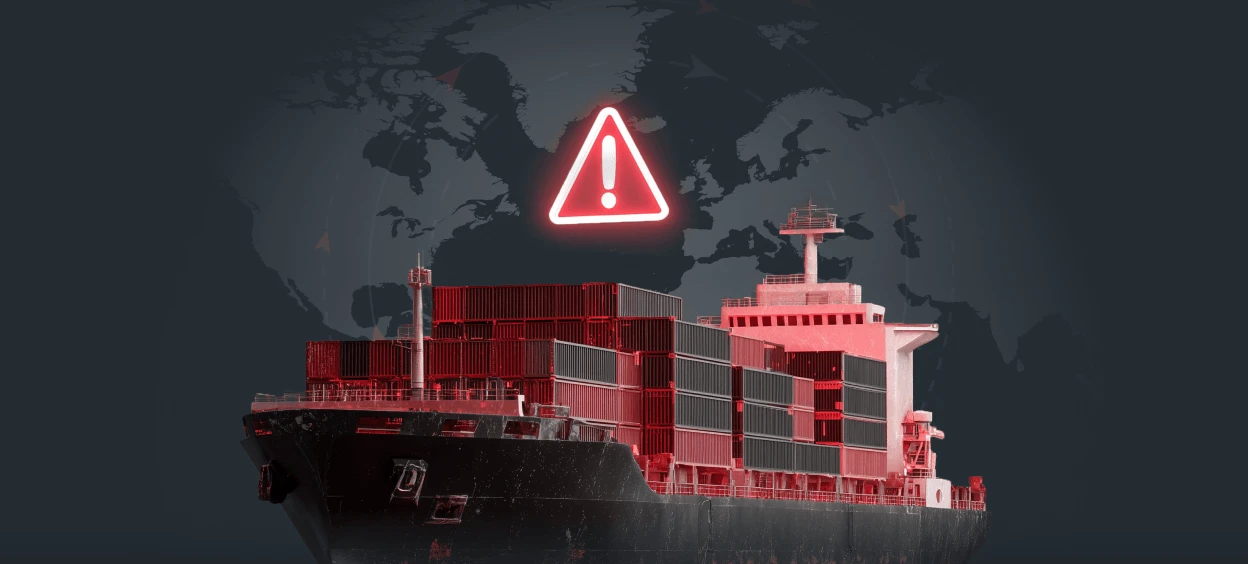
Independent performance benchmarks derived from vessel behaviour across terminals, not self-reported records.


.webp)



8,700+
1,200+
6+
770+
Challenges
- You walk into SLA and port rotation negotiations with only your own operational records.
- The terminal disputes every berth time and dwell time figure you present.
Solutions
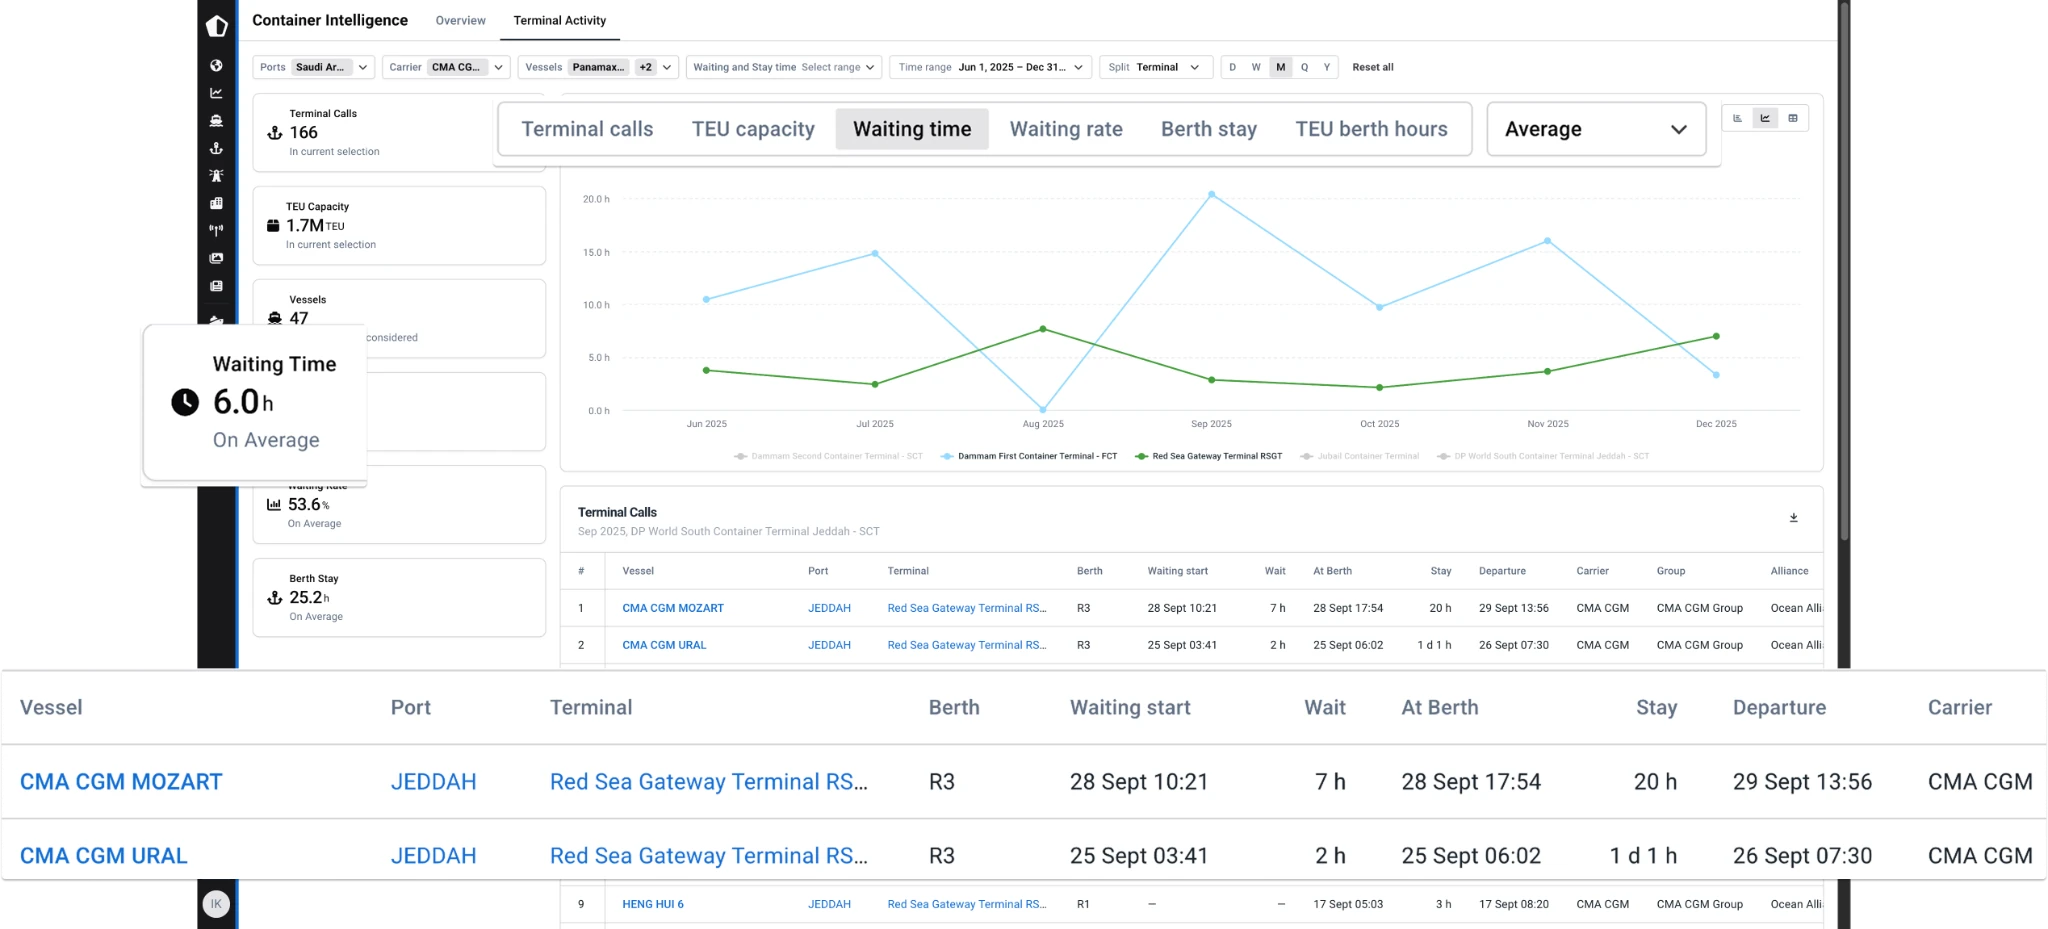
- Negotiate terminal SLAs and port rotations with independent benchmark data.
- Walk into berth window and rotation discussions with third-party waiting time figures your counterpart can verify.
Challenges
- Carriers challenge your pricing and capex investment case.
- You have no independent evidence of how your terminal's dwell time, anchorage time, and vessel turnaround compare to peer terminals regionally.
Solutions
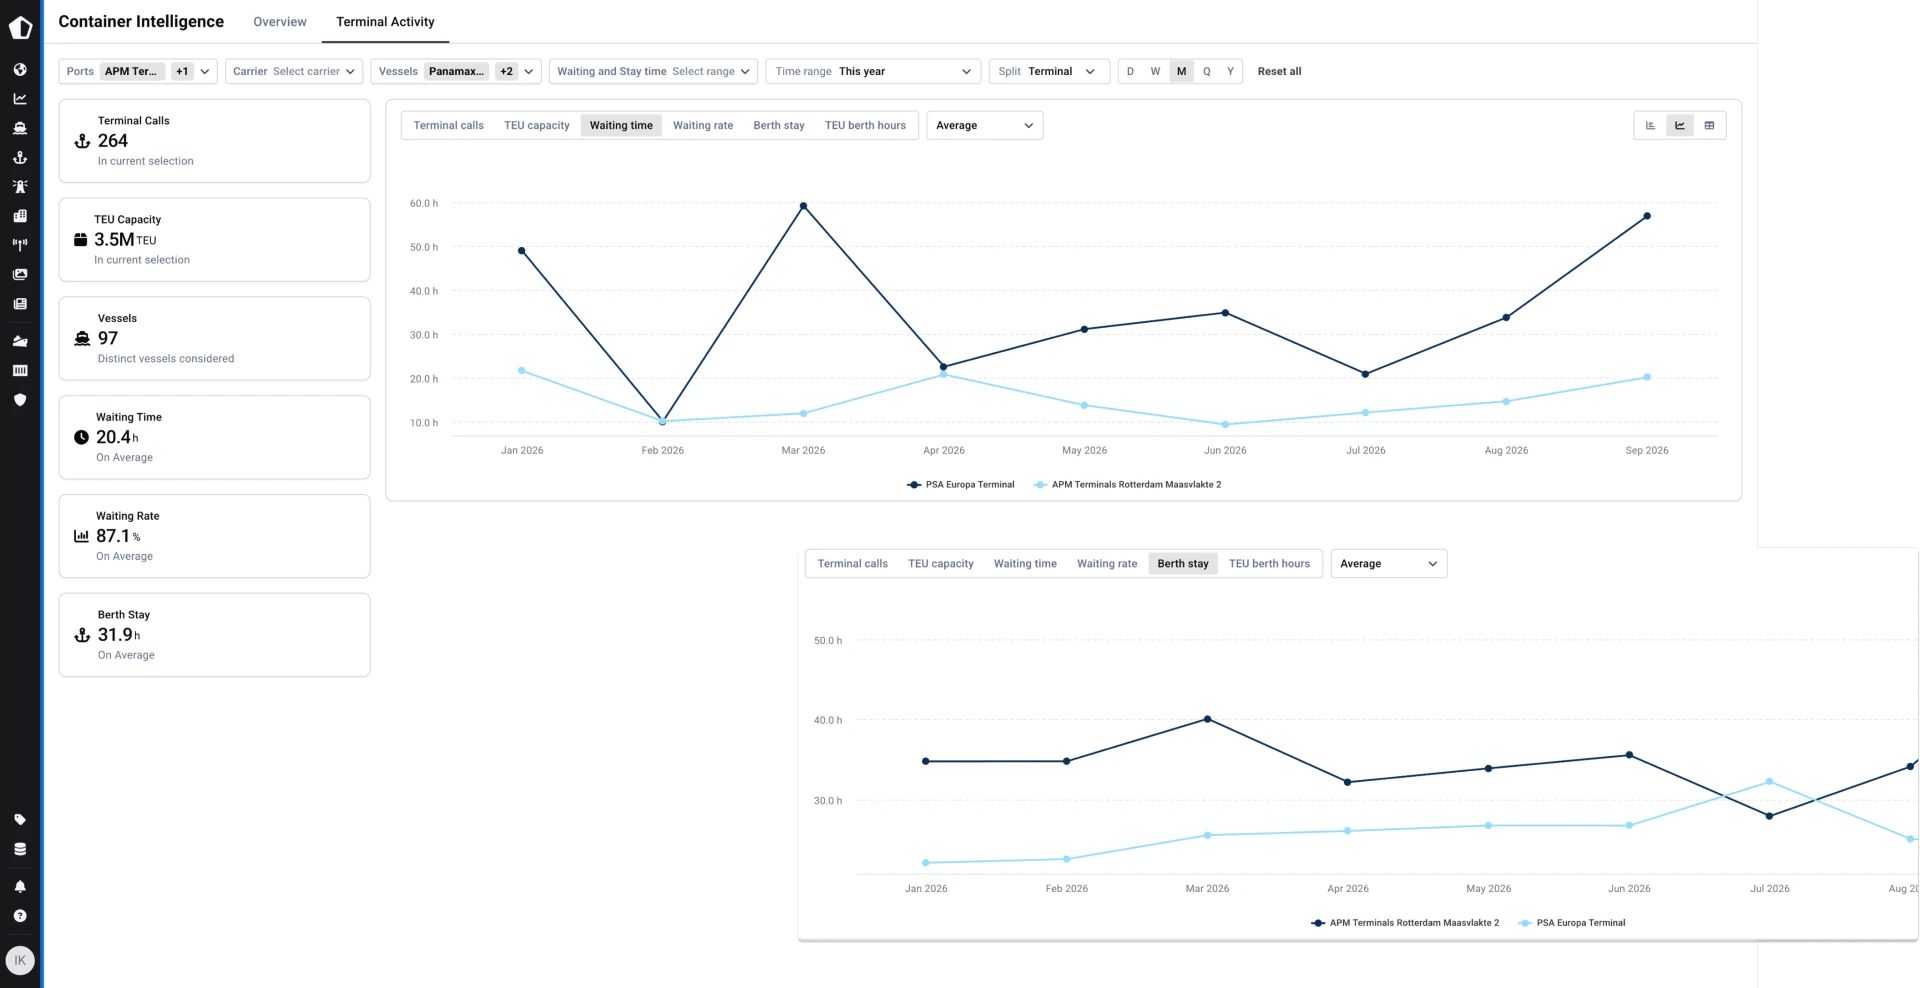
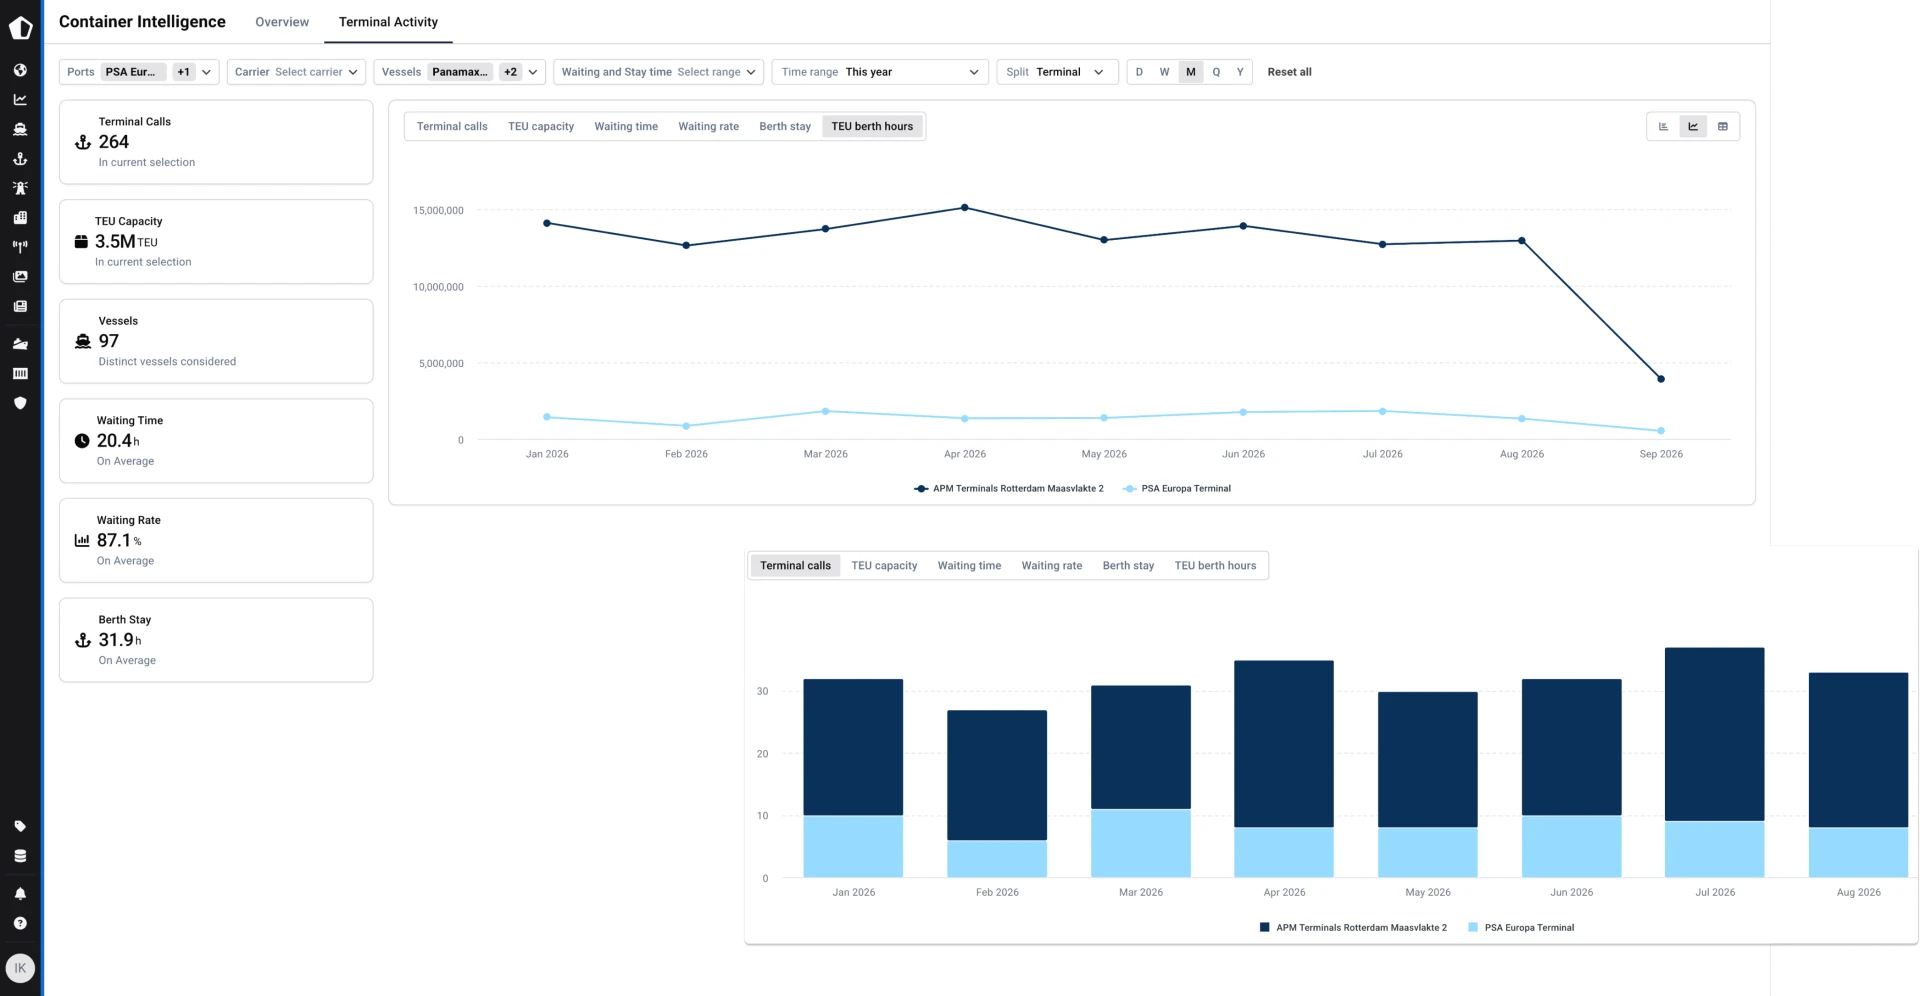
- Defend pricing and attract carrier volume with a neutral view of your competitive position against peer terminals by region and operator group.
- Underperformance becomes the strongest internal capex argument.
Challenges
- Capex proposals stall at board level without independent evidence that your terminal's throughput and turnaround times lag competing facilities.
- Internal performance data is compiled from your own operational records — the same records carriers and analysts will challenge the moment you present them.
Solutions
- Justify investment to the board with TEU×h load comparisons and waiting time trends versus competing terminals.
- Answer the question: "How do we compare to rivals?" with neutral data.
Challenges
- Carrier schedules obscure terminal-driven delay risk.
- Routing and carrier selection decisions carry hidden congestion exposure that only becomes visible after cargo is committed.
Solutions
- Factor terminal performance into carrier and routing decisions.
- Anticipate delays with port congestion data before cargo is committed
- Anticipate congestion-driven delays before they hit your inbound supply chain or trigger D&D charges.
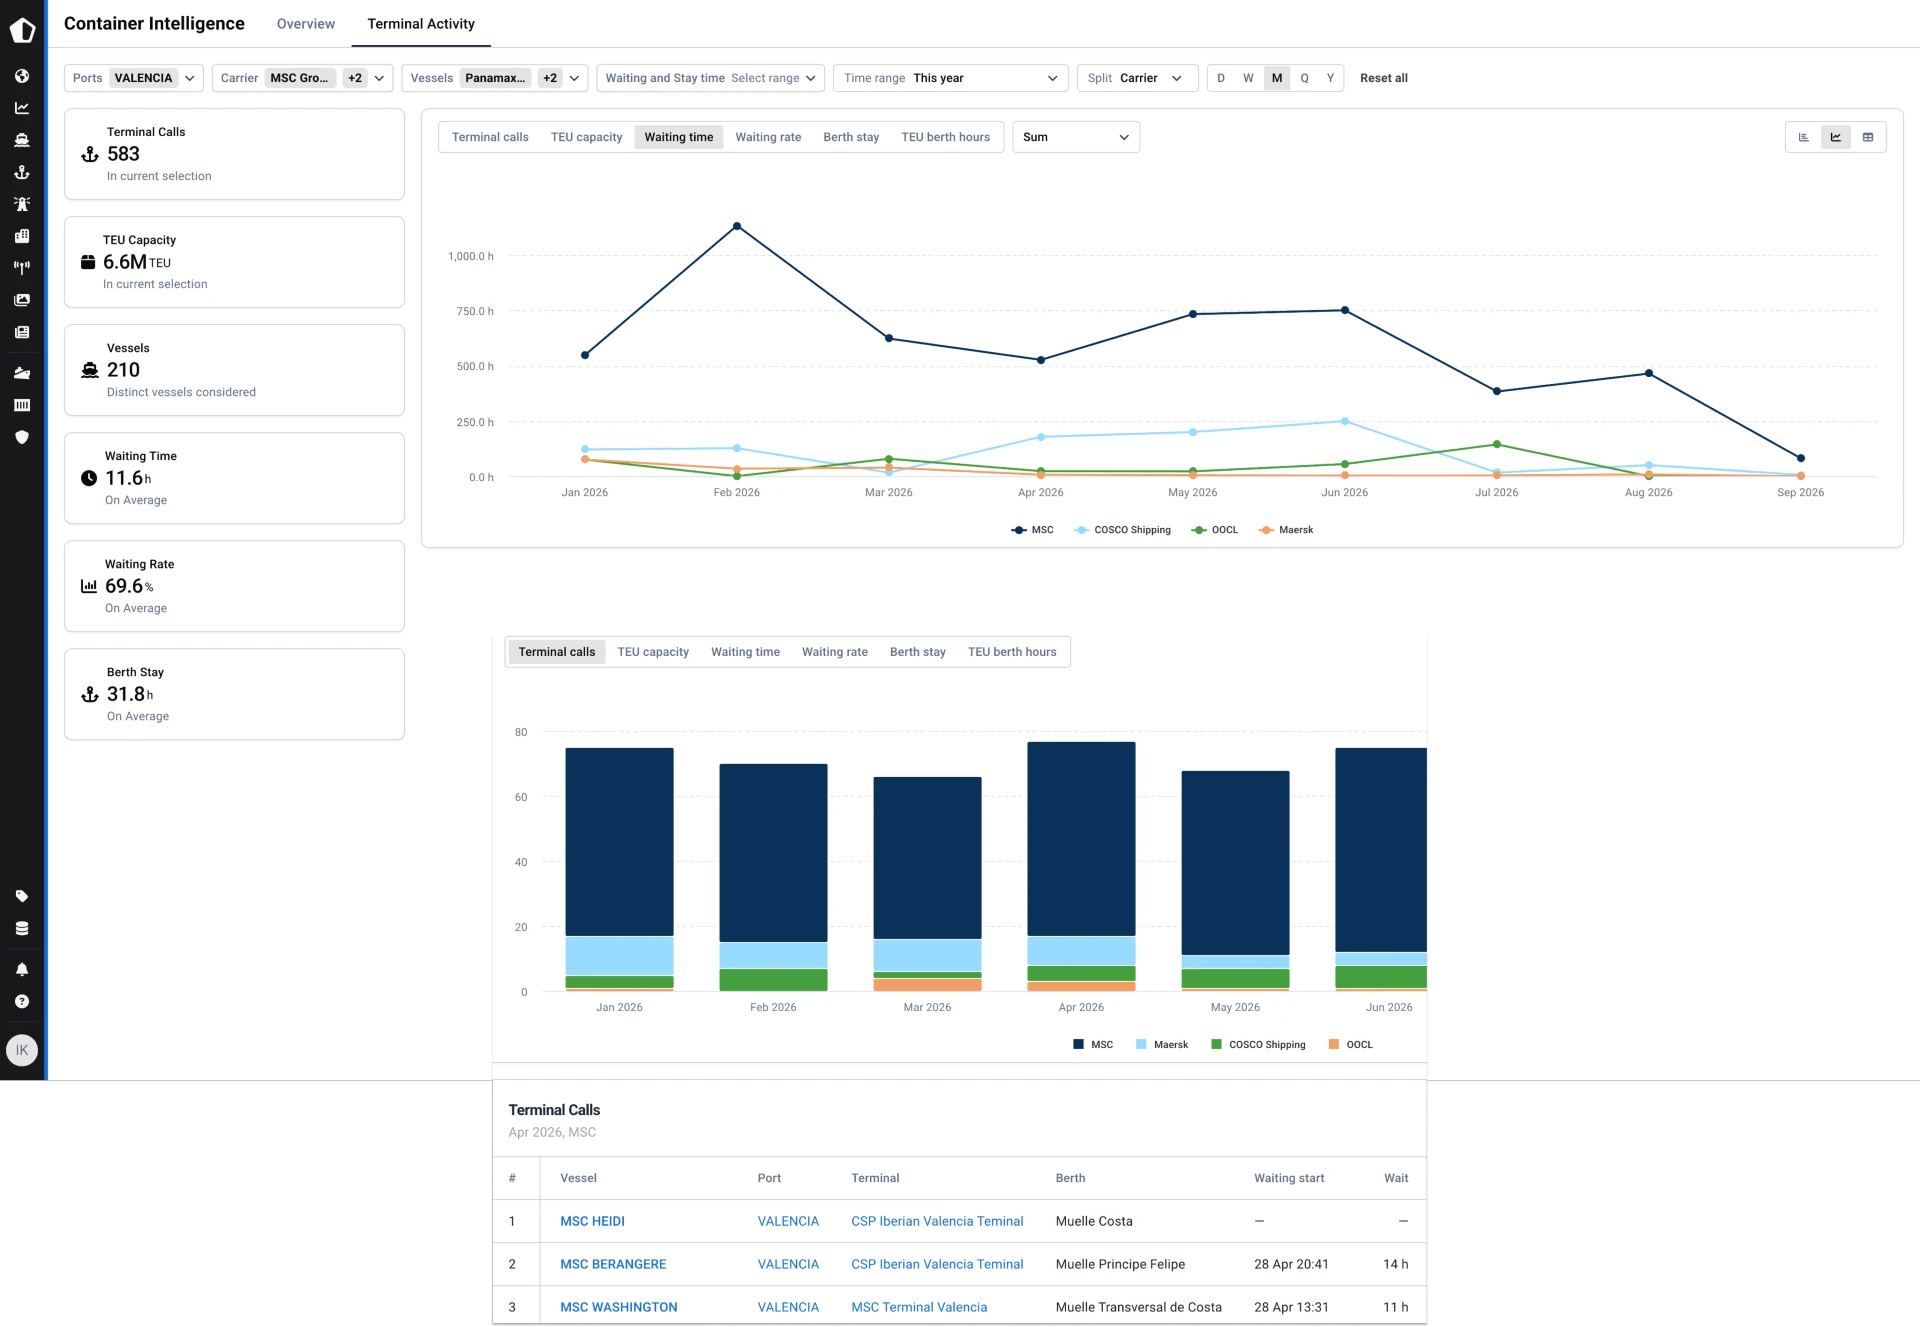
The full picture in one workspace, from sea to berth
Every terminal performance metric, live vessel call, and disruption signal in a single workspace, so procurement, operations, and commercial teams act on the same independent data.

“We had no real-time visibility on our container shipments. Now, we can proactively manage disruptions before they impact production.”

“Shipment insights are accurate and updated in just a few minutes.”

“Initially, our goal was to track around 175,000 containers a year. Since then, customers have grown and we’re tracking upwards of around 1 million containers a year.”

“The accurate, real-time tracking of our shipments ensures that we can provide our customers with precise delivery estimates, which is crucial for their cash flow planning.”
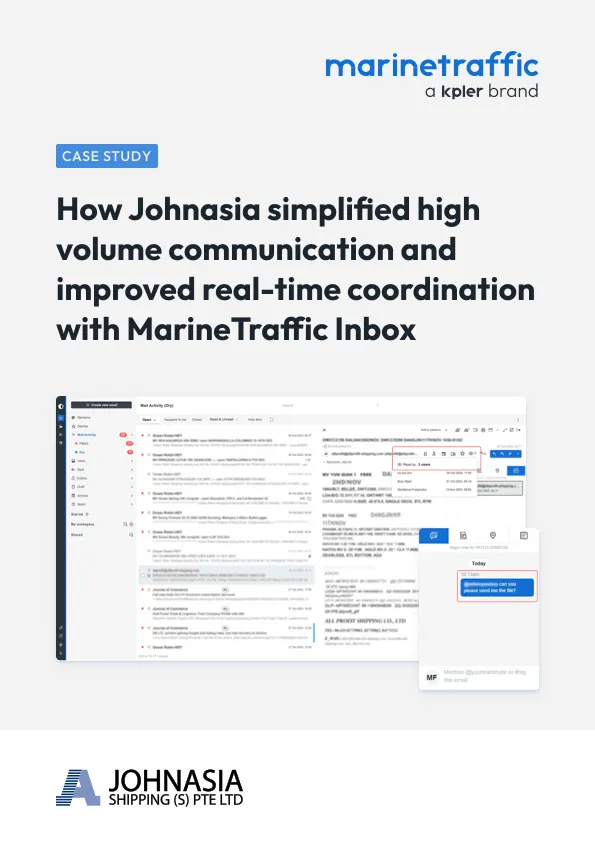
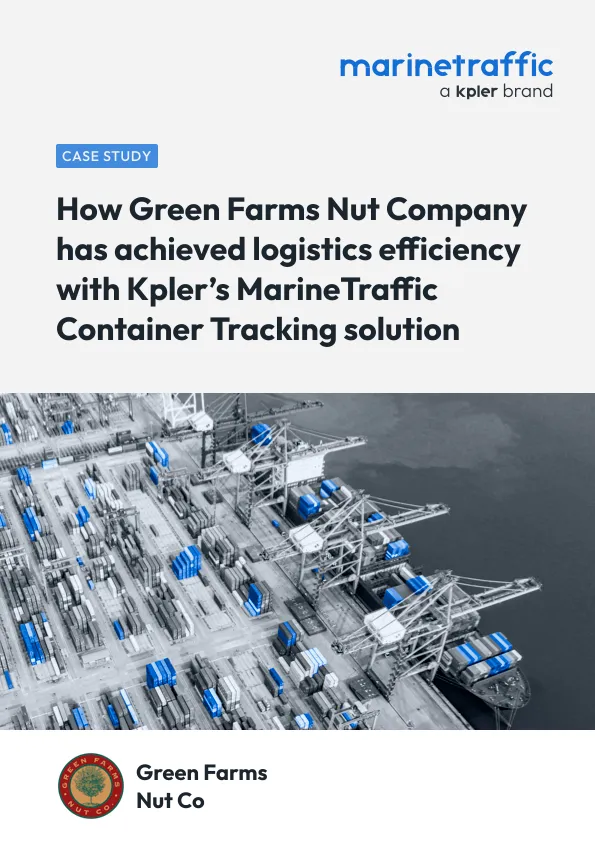
Explore our case studies for maritime markets
FAQ
Annual port rankings publish port-level averages once a year, with no carrier, alliance, or service granularity. Container Intelligence refreshes daily through live, at terminal and berth level, split by carrier, alliance, tradelane, and TEU size class — derived independently from AIS rather than survey or self-report.
At the terminal-call level, berth time is ATA (actual time of arrival at berth) to ATD (actual time of departure); waiting time is the observed pre-berth anchorage wait, which can be zero. In-progress calls are excluded until complete so figures are never distorted by open calls. Full definitions are on the published methodology page linked from the Container Intelligence UI.
Yes. Container Intelligence benchmarks each terminal against regional peers and operator groups, split by TEU size class and carrier. Terminals can identify where they underperform — and use that gap as internal justification for capex — or where they outperform, and lead with that evidence in carrier negotiations.
Carriers use independent terminal benchmarks — waiting time, berth time, and call volume by vessel size class — to challenge SLA terms and justify port rotation changes. Because the data is derived from AIS rather than either party's operational records, it can be presented as neutral evidence in berth window and rotation discussions.
Systematic processing began on 1 January 2026, so depth builds every month. For SLA negotiations and performance benchmarking, recent quarters carry the weight. Aggregation is available daily through yearly.
No, and that's to be expected, as every party measures from their own vantage point. Kpler figures are computed identically for every terminal and carrier worldwide, from observed vessel behaviour, with a published methodology and call count displayed on every view. It is the only figure both sides of a negotiation can independently verify.