

Why are tanker rates so high?
Proposals to ease tanker sanctions and increase fleet availability overlook the main driver of record freight rates. The current market is not simply short of ships. It is short of vessels willing and able to operate efficiently in the Middle East Gulf, where war risk has fundamentally altered freight pricing. VLCC rates in the Middle East reached $37/bbl, with earnings of $1.4m/day. Although the compliant fleet remains tight, conventional supply-and-demand indicators cannot explain the scale of the increase.
Key Takeaways
- War risk continues to drive record freight: MEG-China VLCC rates have held at $37/bbl reflecting the limited number of owners willing to operate in the Middle East Gulf.
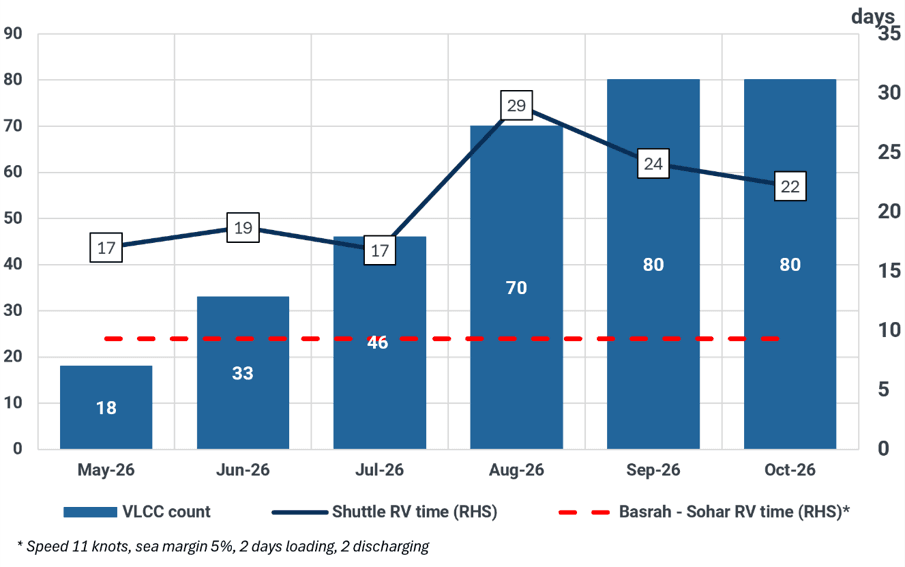
- More ships in shuttle network are delivering diminishing returns: The Gulf of Oman shuttle fleet has expanded to approximately 80 VLCCs, but average round-voyage times have reached 23 days, compared with an optimal 9–10 days.
- Operational constraints are tightening effective supply: Saturated ship-to-ship transfer capacity is pushing cargoes toward India and longer direct voyages, reducing vessel productivity.
- Atlantic freight is being priced against Middle East earnings: Charterers must offer increasingly competitive rates to attract vessels away from the region.
- Refining margins will determine the ceiling: Freight can remain exceptionally high while cargo economics support it, but negative margins are already limiting Atlantic rates.
- Is tanker demand driving rates higher?
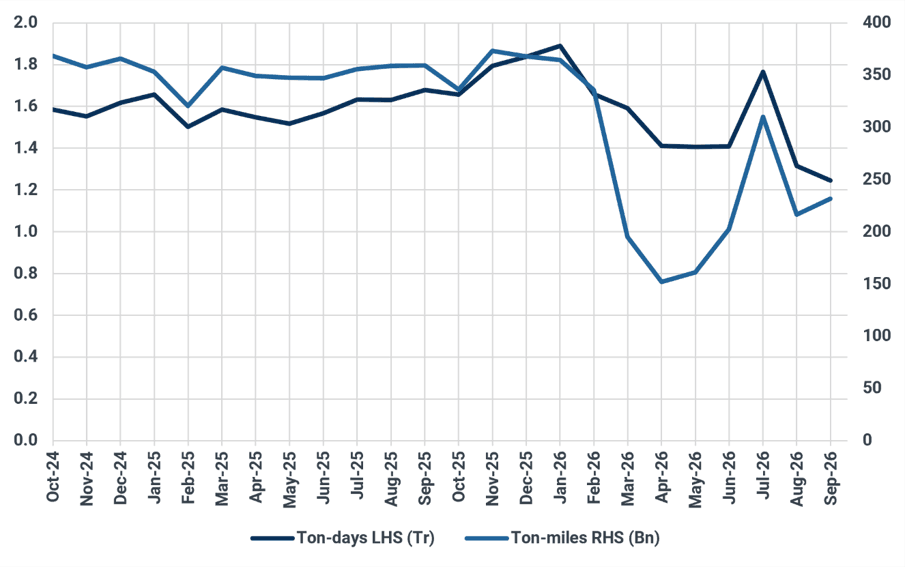
No. Middle East VLCC ton-miles have recovered into the five-year range but remain 34% below 2025 levels. Even ton-days, which better capture the operational burden of STS transfers, remain 24% below pre-war levels.
The disconnect between demand and freight reflects a sharp deterioration in effective vessel availability rather than a shortage of cargo-carrying capacity.
Middle East VLCC ton-miles and ton-days
Source: Kpler
2. Why has a larger shuttle fleet failed to relieve the market?
Ship-to-ship (STS) transfers have enabled Middle East exports to continue while limiting the number of vessels exposed to the Strait of Hormuz. However, the system is becoming increasingly inefficient.
the Gulf of Oman shuttle fleet has expanded to approximately 80 VLCCs. Yet average round-voyage times have reached 23 days, more than double the optimal 9–10 days for a Basrah-Sohar round trip.
Gulf of Oman “Shuttle” VLCC fleet growth
Source: Kpler
With Gulf of Oman STS capacity constrained by equipment and personnel availability, transfers are increasingly shifting toward western India and Malaysia. Western India adds approximately four days to a shuttle voyage, while direct voyages tie up vessels for considerably longer.
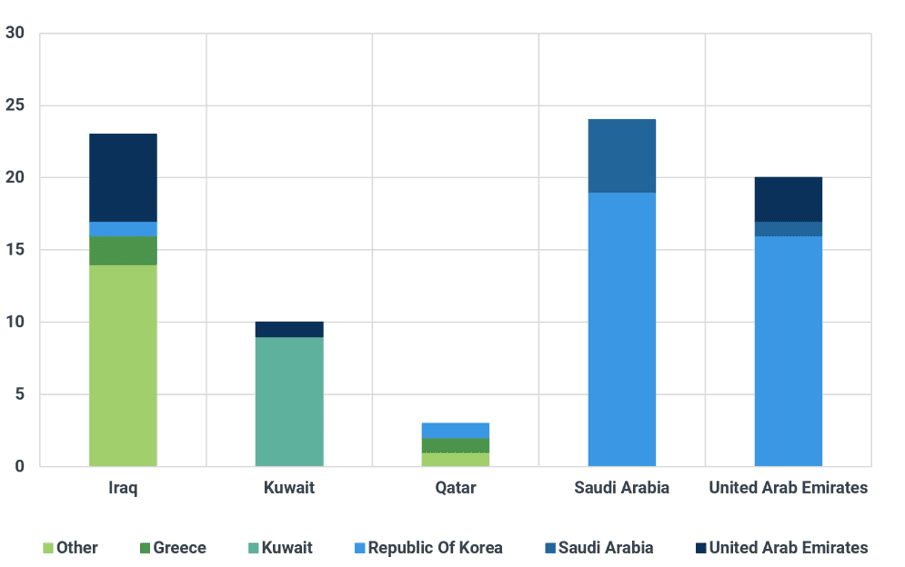
Ownership concentration is further strengthening freight rates. Approximately 50% of the Gulf of Oman shuttle VLCC fleet is controlled by South Korean operator Sinokor, with national oil companies accounting for much of the remaining tonnage. This concentration leaves a relatively small pool of owners willing to operate in the high-risk region, giving them considerable negotiating power over freight rates. With shuttle operations expanding and the threat of attacks increasing, charterers have limited alternatives. This reinforces the war-risk premium and helps explain why adding vessels to the shuttle fleet has failed to ease freight rates.
Consequently, each additional barrel of export capacity requires more ships, even as the fleet expands.
Gulf of Oman Shuttle VLCC fleet beneficial ownership by most frequent country of load
Source: Kpler
3. How much do operating costs explain higher freight?
Higher bunker prices and insurance premiums have increased voyage costs, but neither explains the freight spike.
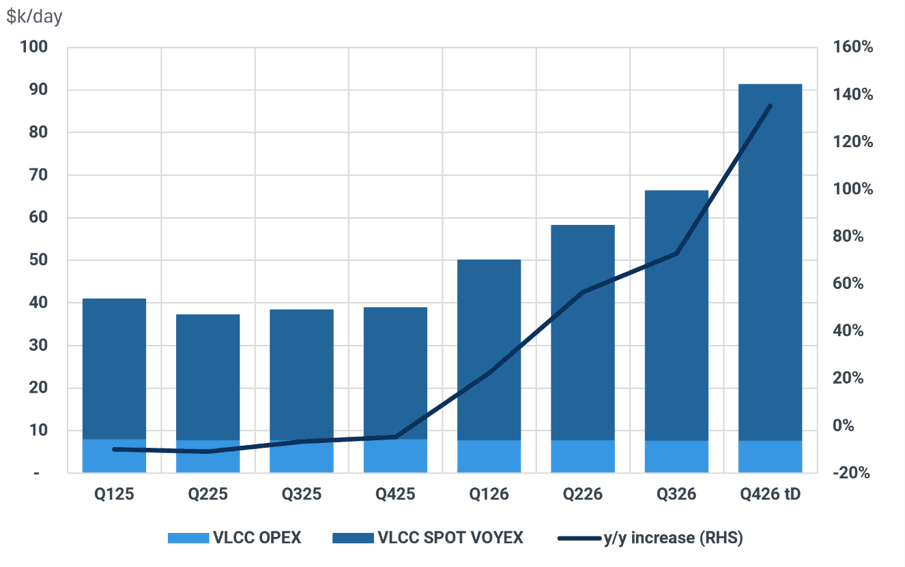
For VLCCs, operating and voyage costs have increased 140% y/y. While notable, this increase is small in the context of the 2,000% increase in freight rates. These figures are for the whole VLCC market, with insurance and crewing costs for the Strait of Hormuz significantly higher.
Bunkers is the largest component here. The war in the Middle East has pushed bunker prices higher. Singapore HSFO is 134% to 890/t and VLSFO up 105% to $911/t. The non-shadow VLCC fleet is less exposed to higher bunker as it predominantly uses HSFO, with 62% fitted with scrubbers.
VLCC operating and voyage costs (‘000/day)
Source: Baltic Exchange, Kpler Calculations
Cargo insurance for Hormuz transits has risen from $0.05/bbl to $3.50/bbl. This is substantial, but remains a relatively small component of freight exceeding $30/bbl.
4. Why are Atlantic rates also at record highs?
Exceptional Middle East earnings discourage VLCCs from repositioning toward the Atlantic. Middle East earnings are more than $500,000/day higher than in the Atlantic, so charterers elsewhere must therefore compete with Middle East employment, even where local demand fundamentals do not justify record freight.
This pushed US Gulf–Asia rates to $40/bbl in recent weeks and encouraged some West African cargoes to shift from VLCCs onto Suezmaxes. The resulting freight strength is a global consequence of a regional disruption.
5. How high can rates go?
Refining margins, not the physical number of available vessels, are the immediate ceiling.
Discounted Middle East crude has allowed Asian refining margins to remain positive despite exceptional freight. Atlantic-origin cargoes face a different reality. Higher transportation costs have pushed some Asian refining margins into negative territory, contributing to a correction in Atlantic VLCC rates.
The outlook therefore differs by region. Atlantic VLCC rates are more vulnerable to further declines, while Middle East freight should remain supported by war risk, constrained shuttle capacity, and favorable cargo economics.
A recovery in Middle East exports alone will not normalize freight. Until the threat to shipping diminishes and vessel efficiency improves, the Middle East will continue to dictate global VLCC pricing.

See why the most successful traders and shipping experts use Kpler