Algorithmic trading behavior insights
Get actionable insights into algorithmic trading behaviour across global futures markets


.webp)


Best part? Kpler dashboards. I set up my metrics once, and they update in real-time. I can access the latest insights instantly. It’s user-friendly and saves me a lot of time.
Ron Oster, Broadview Capital


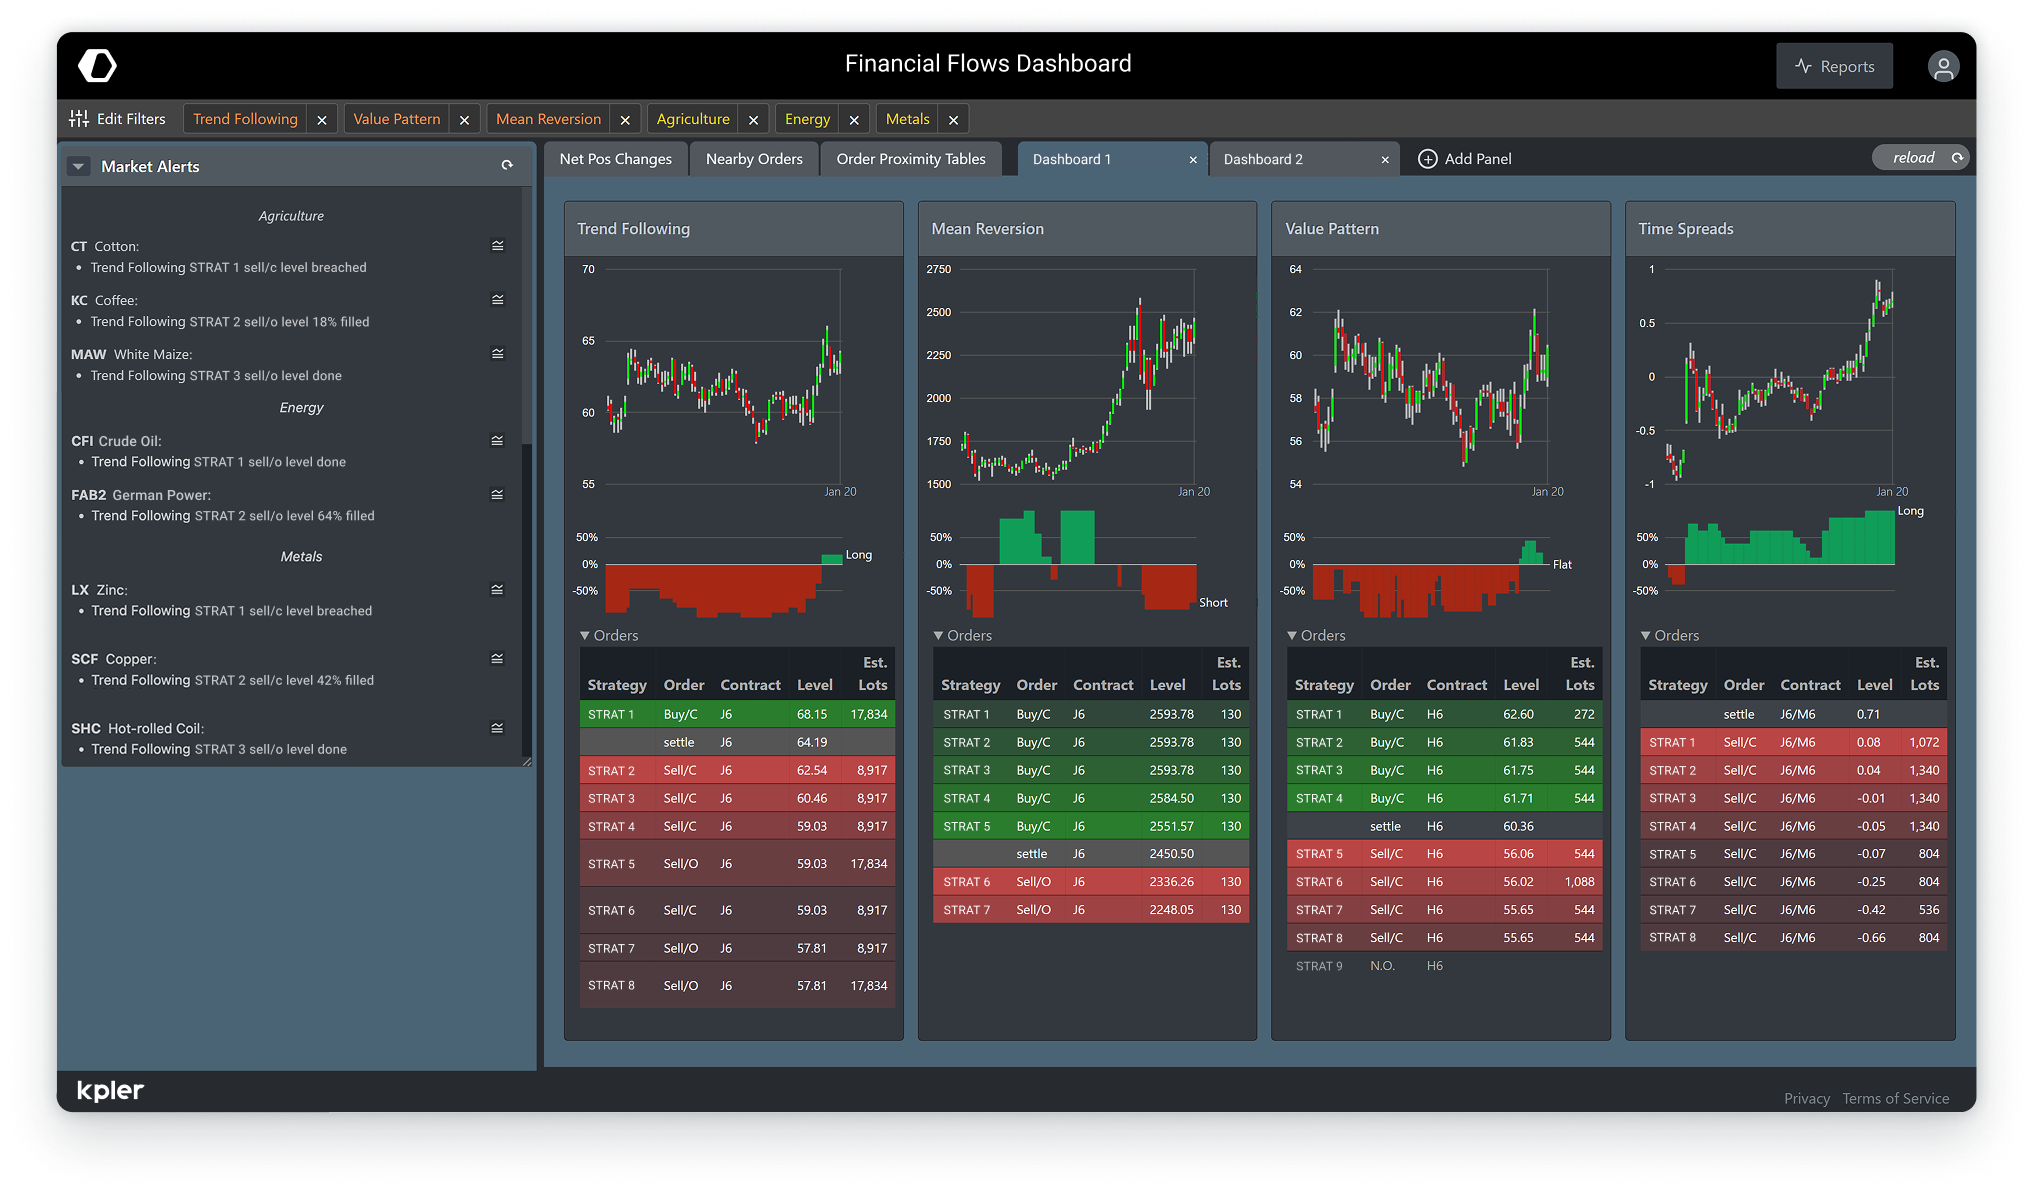
Financial Flows delivers real-time insight into systematic CTA positioning and flows across global, liquid markets. Kpler’s proprietary algorithmic research and deployment platform rigorously tests and validates quantitative strategies, enabling high-fidelity replication of systematic CTA behaviour.
This gives traders actionable visibility into flow-driven dynamics, helping them anticipate price dislocations, manage risk proactively, and time trade decisions with greater confidence.
Identify systematic flow inflection
- Access daily systematic CTA flow estimates with explicit trade direction, order size, and positioning updates
- Anticipate when systematic flows are likely to enter the market
- Time entries and exits with clearer visibility into flow-driven market pressure
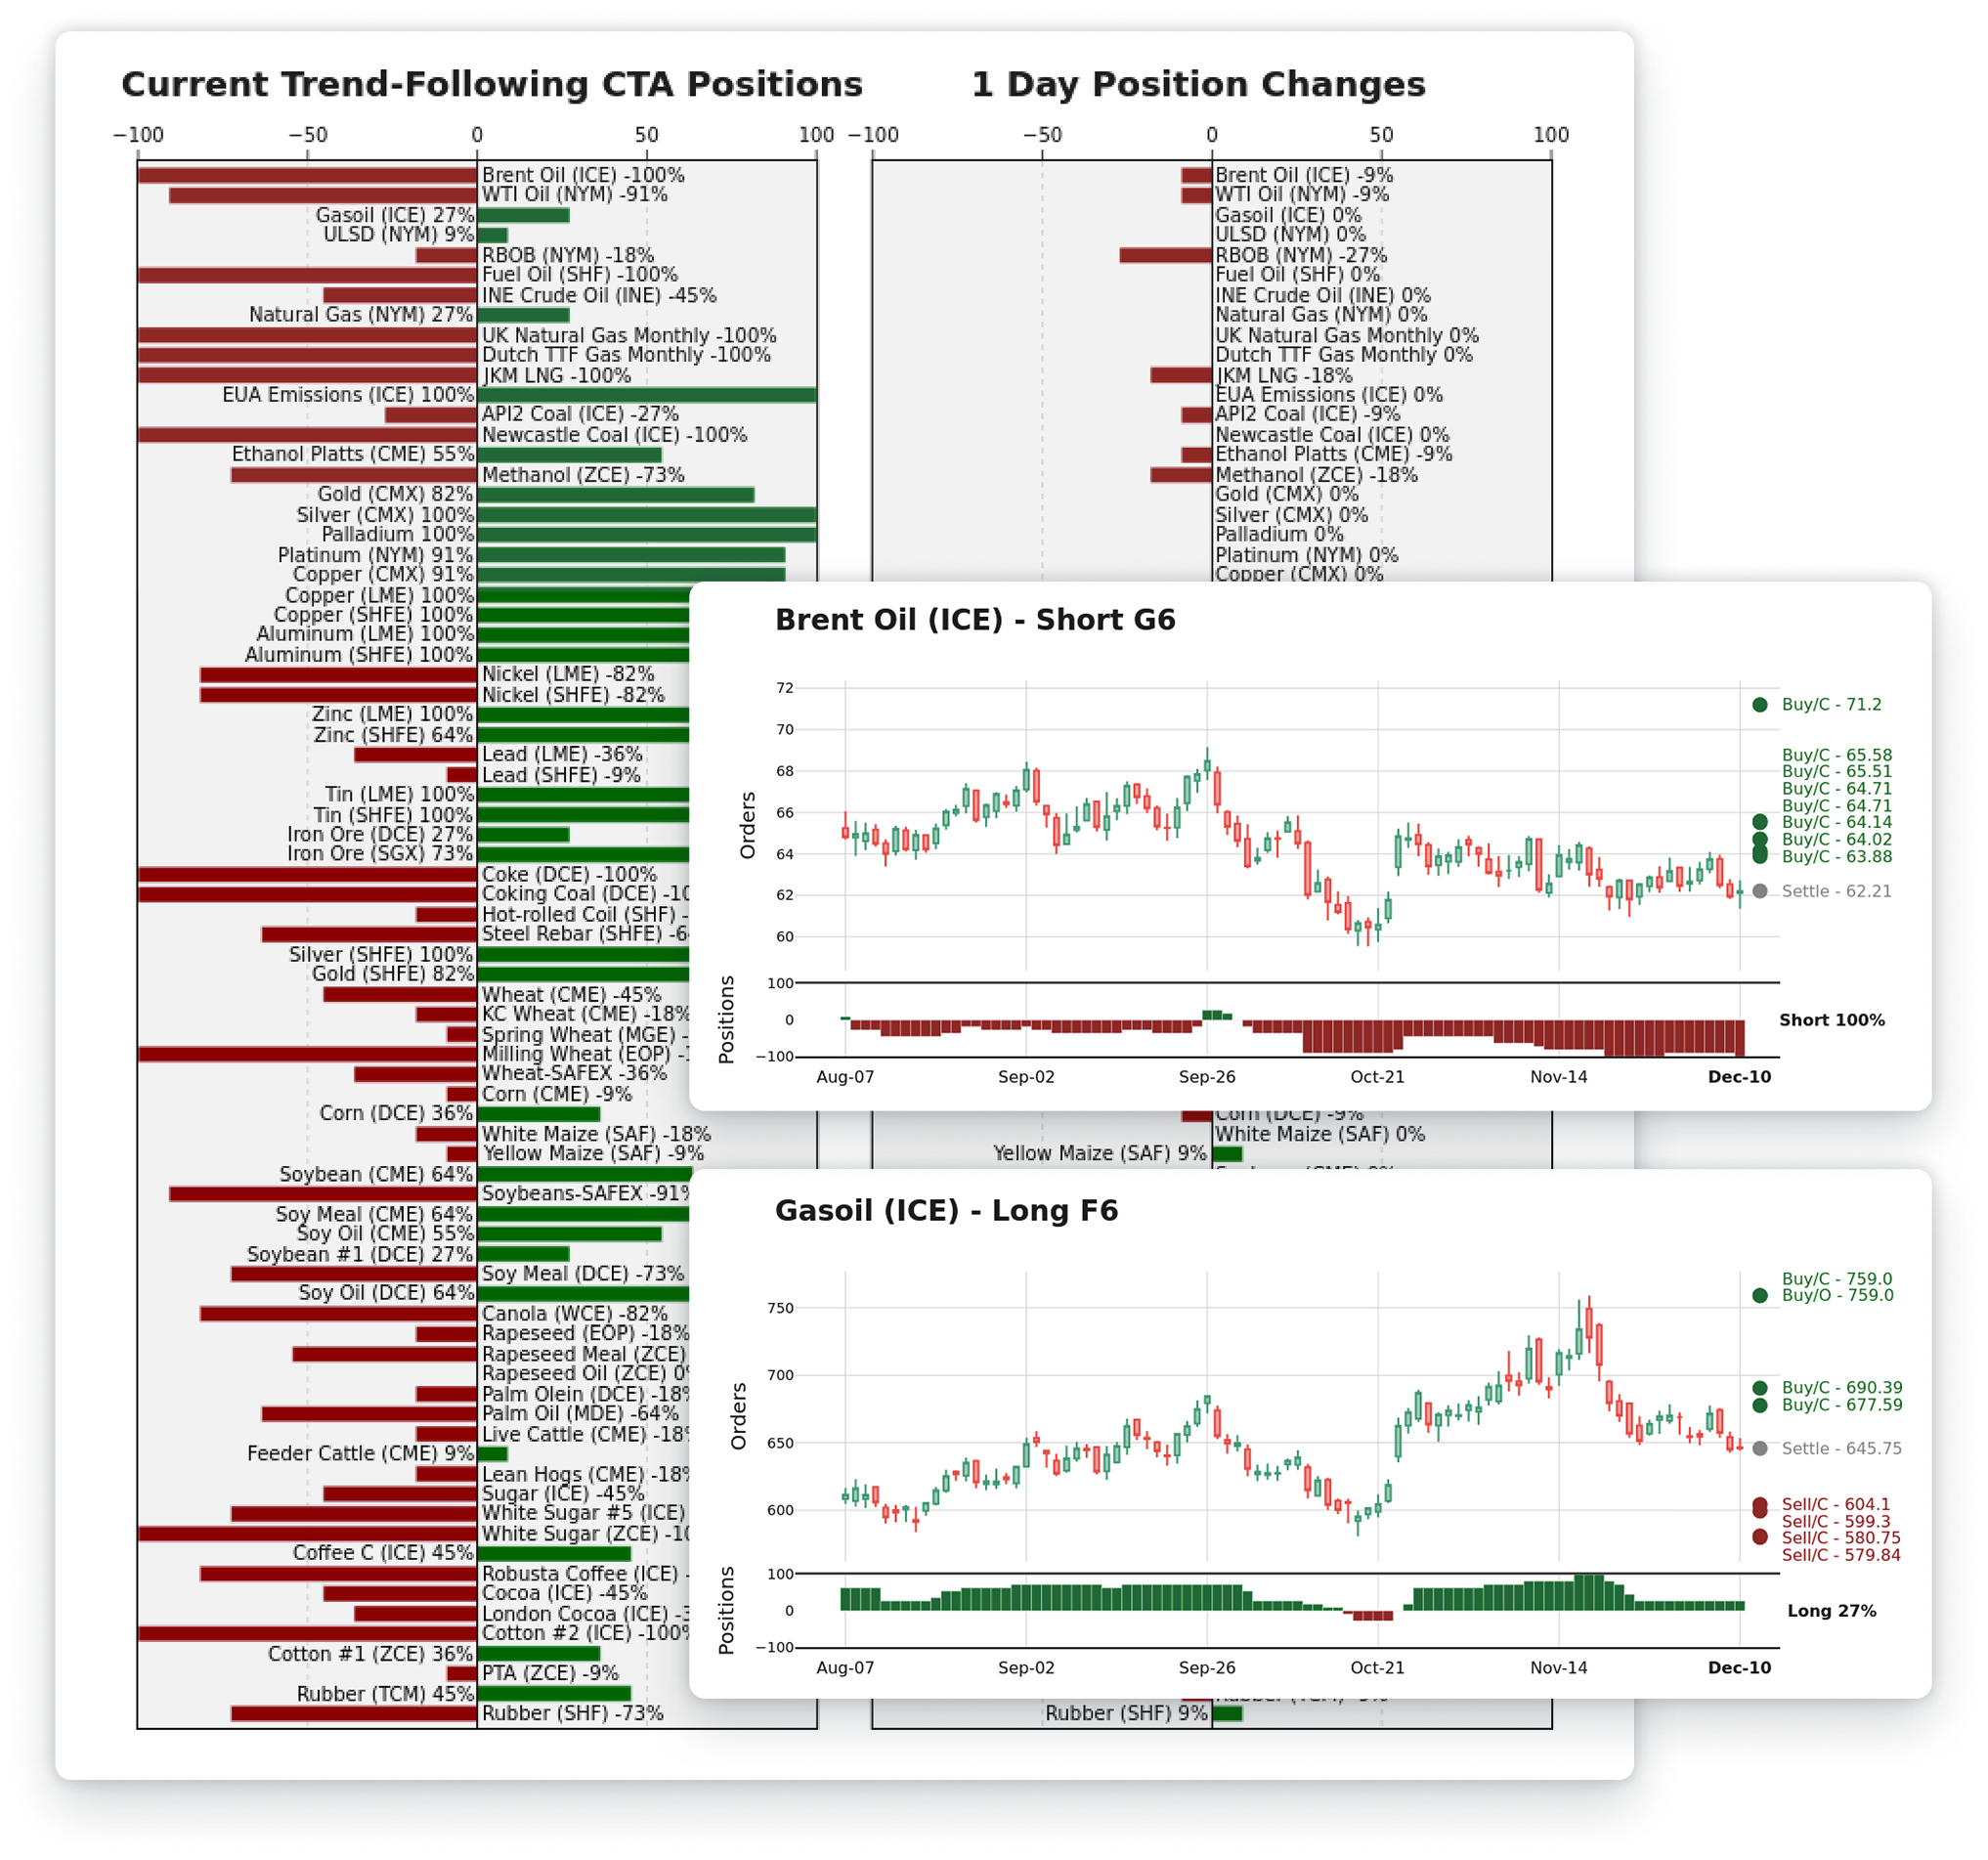
Track systematic financial positioning and consensus
- View daily systematic CTA positioning across various strategy types
- Track aggregate financial flow exposure and consensus across assets and factors
- Align with prevailing systematic positioning — or lean against it — with confidence and transparency.
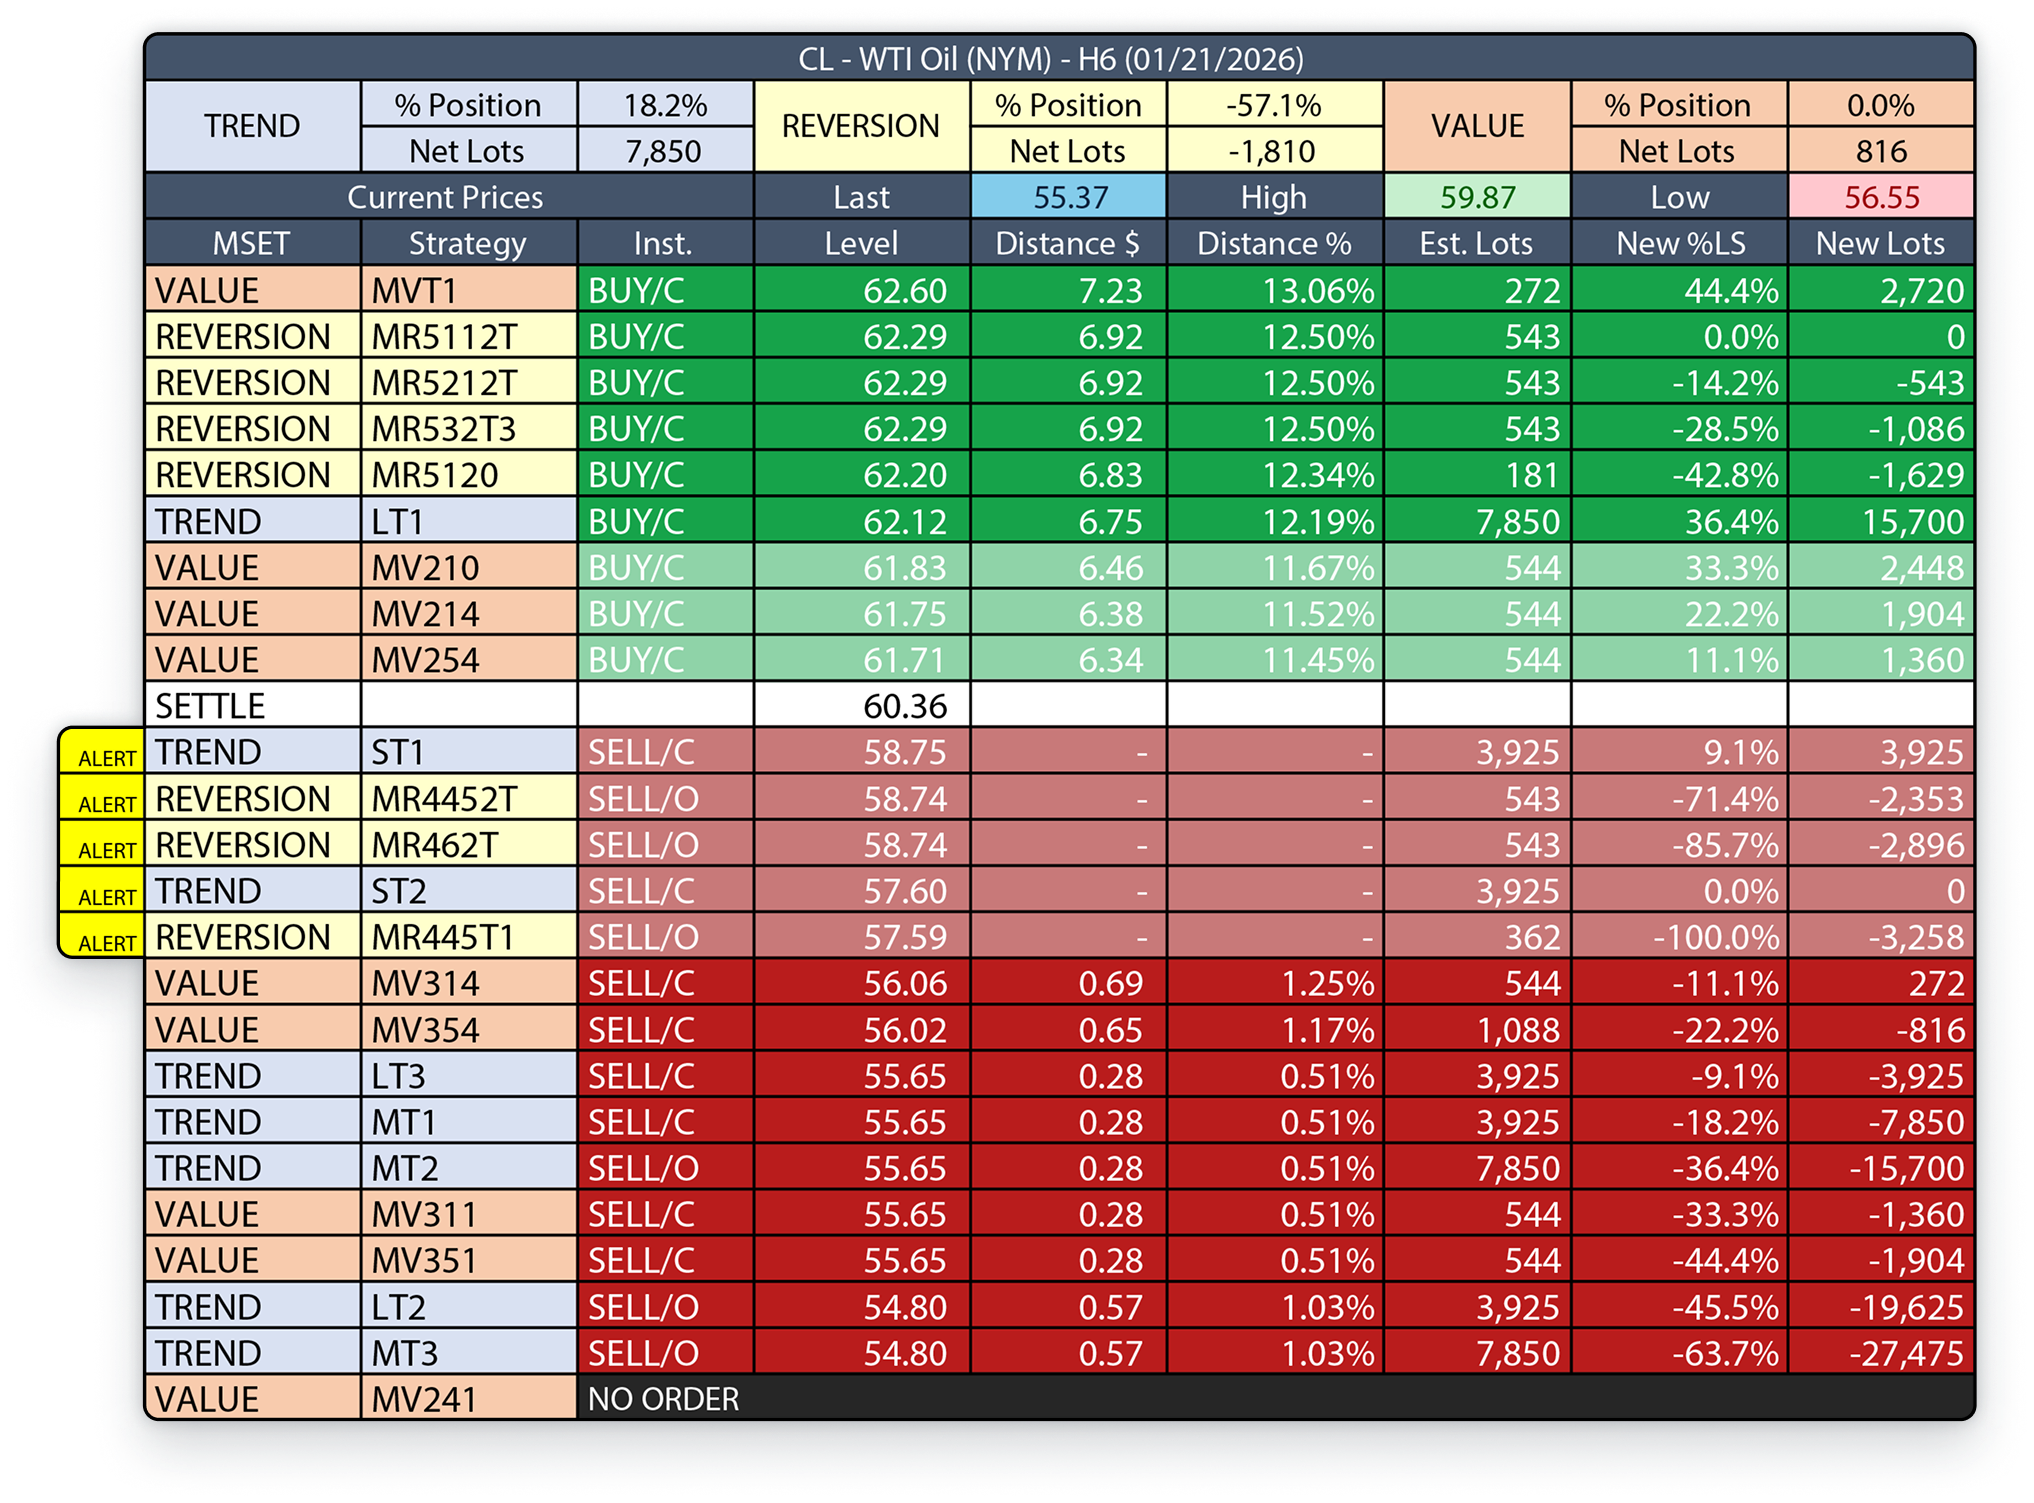
Detect systematic crowding and liquidity risk
- Monitor systematic flows across multiple strategy types to identify congestion points before liquidity becomes constrained
- Track positioning and flow dispersion across the curve, revealing where systematic exposure is concentrated and where risk is building
- Enhance risk management by contextualising systematic exposure across evolving market regimes
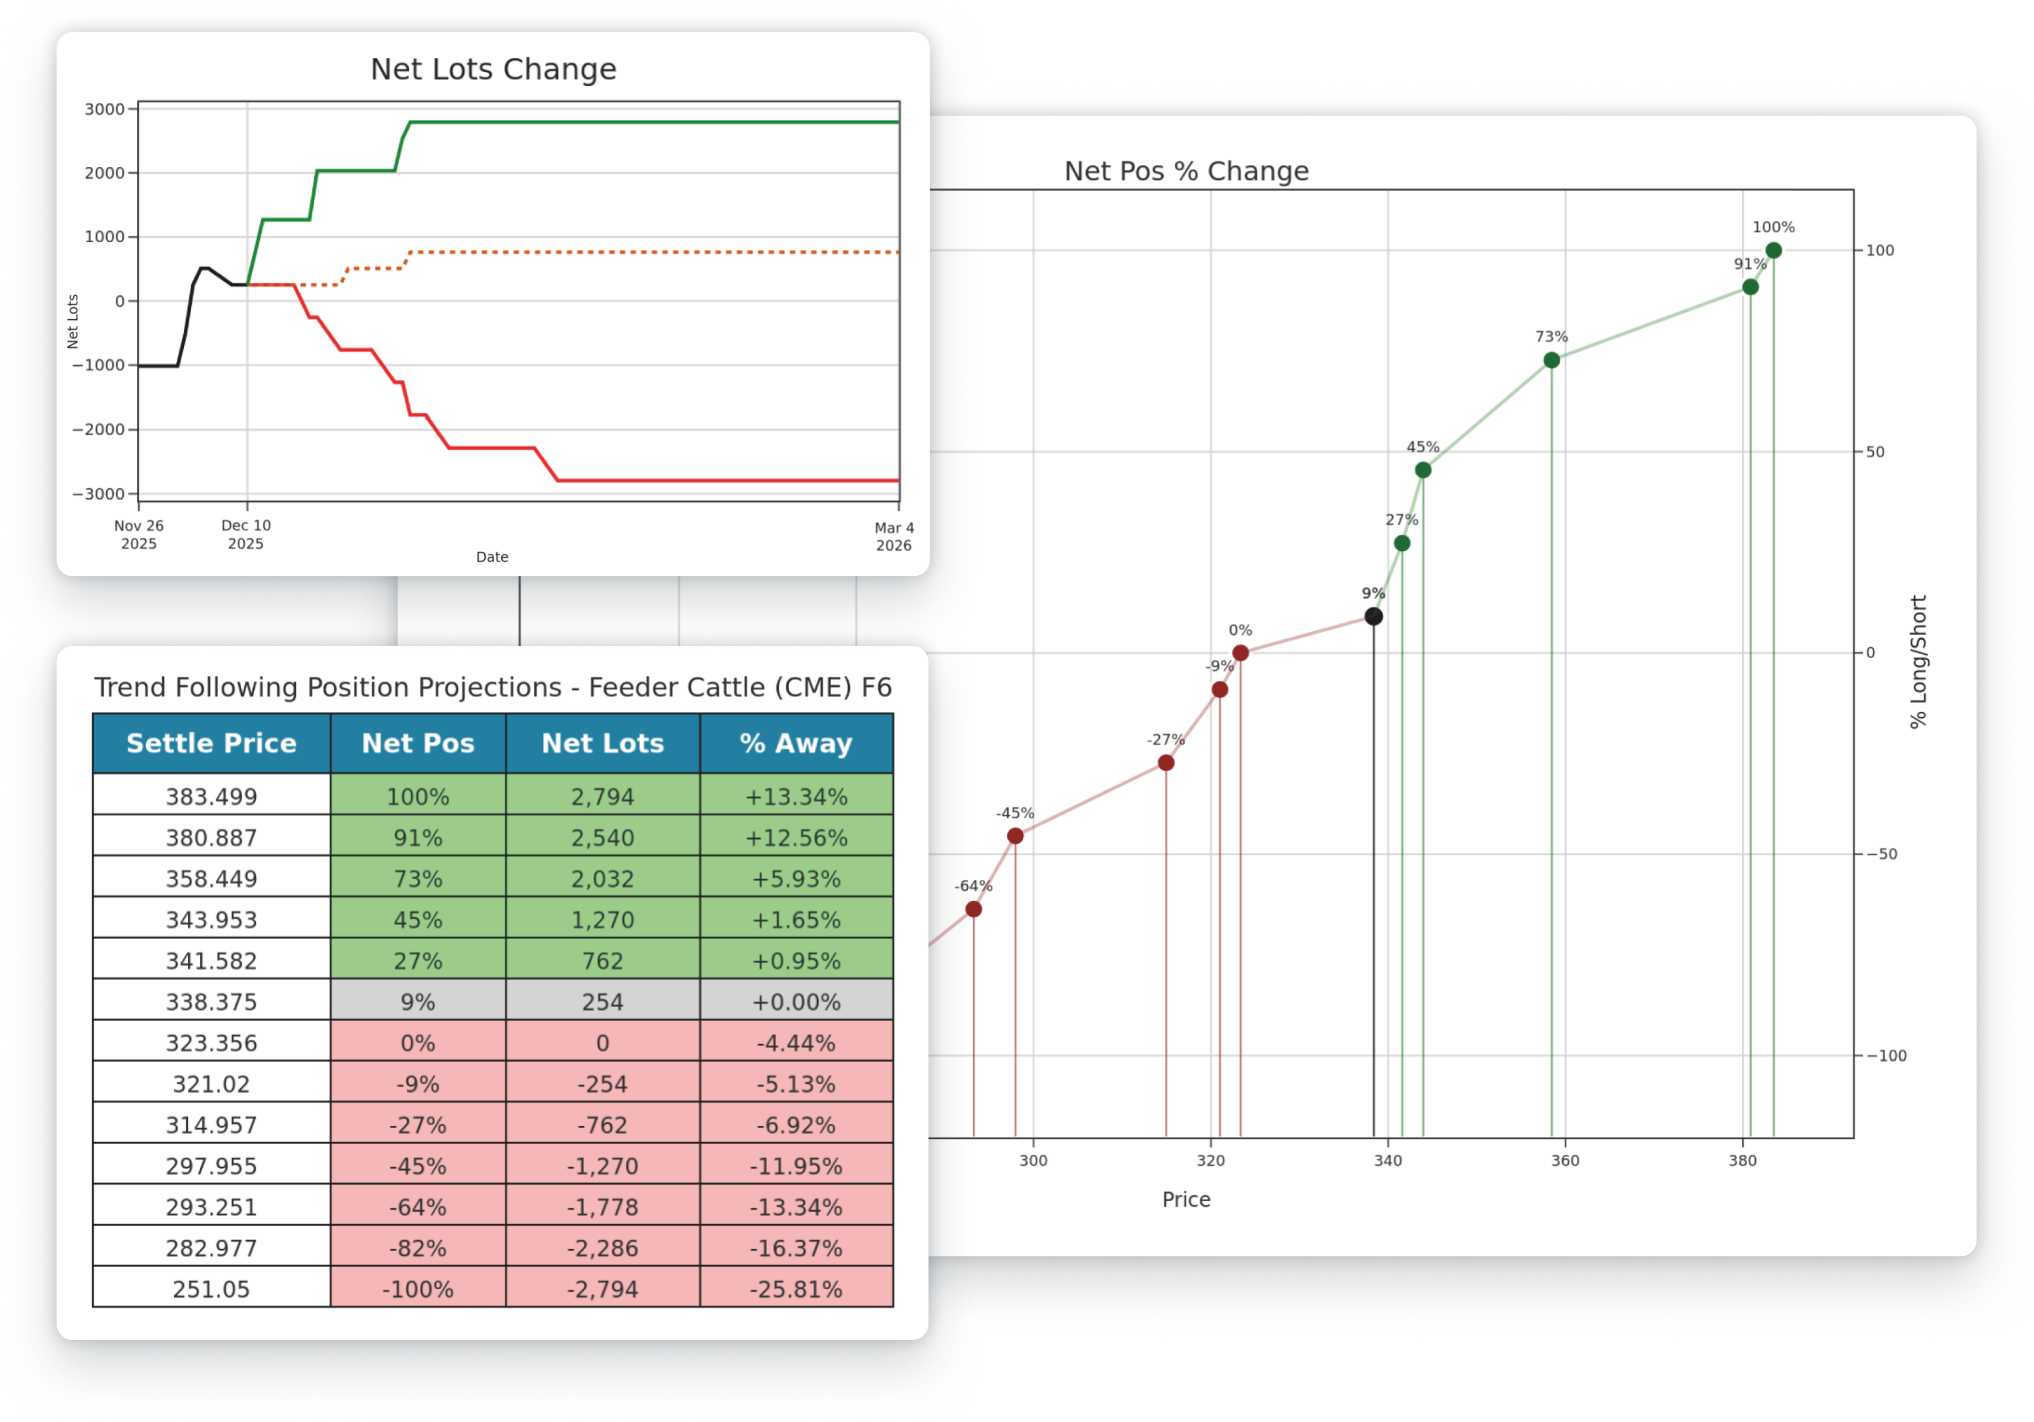
Explore systematic flows across scenarios
- Quantify how flow magnitude, order size, and execution intensity evolve across scenarios
- Identify inflection points where financial flows are likely to accelerate or unwind
- Manage exposure through structural shifts in systematic behaviour
Benchmark and validate systematic CTA flows
- Track how replicated CTA strategies are performing in real time, linking positioning, execution, and realised market impact
- Validate flow signals by comparing model outputs to observed performance and historical CTA behaviour
- Cross-check systematic, discretionary, and commercial participation using disaggregated Commitment of Traders data.
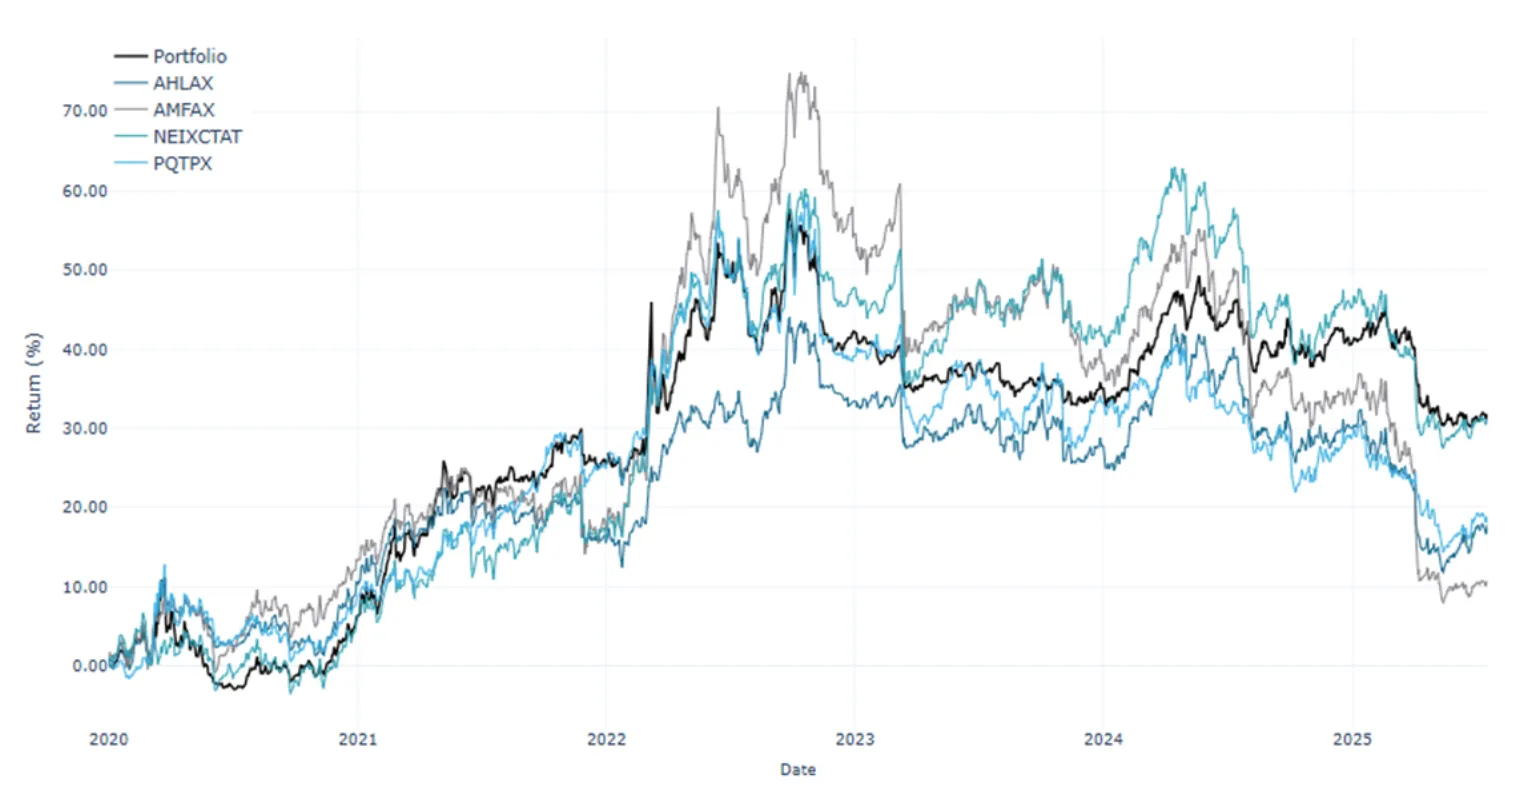
Benchmark-correlated analysis for financial flows accuracy
Kpler evaluates the accuracy of its Financial Flows product by correlating derived flow signals against leading CTA benchmarks, providing a quantitative framework to assess how closely modelled financial activity reflects the performance and structure of systematic managed futures strategies.
Featured podcasts
Algorithmic trading and Commodities with Stephen Roseme
Volatility with Stephen Roseme
Frequently asked questions
Financial Flows provides systematic, execution-aware estimates of algorithmic trading activity, focused on how rule-based strategies position, size, and execute trades across global futures markets.
Key data components include:
- Estimated systematic positioning (net positions and net lots) across trend, mean reversion, value, and spread strategies.
- Price-level order stacks, showing where algorithmic strategies are likely to add, reduce, or reverse exposure.
- Liquidity-adjusted flow estimates, translating signals into realistic order sizes based on observed market capacity.
- Intraday execution validation, using excess volume analysis to confirm whether trades are realistically executable.
- Scenario-based positioning projections, showing how positions may evolve under different price paths rather than predicting prices.
- Historical datasets and APIs, enabling backtesting, convergence analysis, and integration into in-house models.
Together, this data moves beyond abstract signals to quantify who is likely trading, how much, and under what market conditions.
Algorithmic trading flows are rule-driven, capacity-constrained, and liquidity-sensitive. Generic indicators often miss these mechanics.
Specialised flow data is essential because:
- Algorithmic strategies respond to price levels and volatility, not narratives or sentiment.
- Position changes depend on risk budgets and market liquidity, not just directional conviction.
- Flows often emerge during transitions (breakouts, regime shifts), not at static extremes.
- Without execution context, estimated positioning can materially overstate real market impact.
Financial Flows incorporates these constraints by grounding signals in observed volume behaviour and execution windows, ensuring that inferred flows reflect how systematic strategies actually trade.
Traders and analysts use Financial Flows as a contextual layer, not a standalone trading signal.
Common use cases include:
- Pre-trade planning: Identifying crowded levels, potential acceleration zones, and liquidity risks.
- Risk management: Understanding when positioning is extended or vulnerable to forced unwinds.
- Execution timing: Aligning discretionary trades with or away from systematic flow pressure.
- Market diagnostics: Interpreting whether price moves are supported by real systematic participation.
- Post-event analysis: Explaining volatility or breakouts through observed algorithmic execution behaviour.
The data is designed to support trade ideas, decision quality and defensibility, particularly in institutional risk and execution discussions.
Execution and liquidity analysis are core to Financial Flows, not an overlay.
They are embedded through:
- Liquidity units, which convert strategy risk into realistic order sizes based on observed excess volume.
- Intraday volume validation, confirming whether sufficient trading activity exists to support modeled orders.
- Fill-time analysis, measuring how quickly systematic orders are absorbed by the market after key level breaches.
- Order disqualification rules, preventing signals from contributing to positioning when liquidity conditions are insufficient.
This ensures Financial Flows reflects tradable behaviour, not theoretical exposure.
Generic CTA indicators typically provide directional summaries without explaining why or how flows occur.
Financial Flows differs by:
- Disaggregating strategies (trend, reversion, value) instead of presenting a single aggregated signal.
- Separating conviction from capacity using Net Position (directional bias) and Net Lots (risk and size).
- Anchoring estimates in execution data, not just price signals.
- Providing level-based transparency, showing where flows are triggered and how they evolve.
- Validating outputs empirically, through COT reconciliation and intraday volume analysis.
This makes Financial Flows an analytical framework, not a sentiment proxy.
- Historical outputs describe what has already occurred: realised positioning, validated execution, and confirmed alignment with observed institutional flows (e.g., COT reconciliation).
- Forward-looking outputs explore conditional outcomes: how positioning may change if price moves through specific levels or follows certain paths.
Importantly, forward-looking analysis:
- Does not forecast prices.
- Focuses on flow sensitivity and transition risk.
- Helps users anticipate where pressure may accelerate or dissipate as conditions change.
This distinction preserves analytical integrity while supporting proactive risk assessment.
When evaluating an algorithmic flow analytics provider, the key question is not whether the data looks intuitive, but whether it is measurable, explainable, and grounded in real trading behaviour. The most important criteria are outlined below.
Validation
A credible provider must demonstrate that its outputs align with observable market behaviour, not just internal model logic.
Look for:
- Empirical validation against independent datasets, such as public positioning (e.g., COT), execution volume, or historical fill behaviour.
- Evidence that modeled position changes correspond to actual week-over-week or intraday market flows.
- Clear rules for when signals are considered invalid due to insufficient liquidity or participation.
Why it matters:
Without validation, flow analytics risk becoming speculative. Algorithmic strategies are capacity-constrained and execution-sensitive—models that ignore this often overstate positioning and misrepresent market pressure.
Depth and structure of positioning
Flow analytics should reflect that algorithmic trading is not monolithic.
Look for:
- Separation between strategy types (e.g., trend following, mean reversion, value).
- Distinction between directional conviction and risk-adjusted size rather than a single aggregated indicator.
- Visibility into how different time horizons interact or conflict.
Why it matters:
Short-term and long-term systematic strategies can exert opposing pressures at the same time. Aggregated signals mask these dynamics and reduce analytical usefulness, particularly during regime shifts.
Scenario-based context
Strong flow analytics should be conditional, not static.
Look for:
- Tools that show how positioning could change if prices move, rather than only reporting current levels.
- Scenario frameworks that map flow acceleration or decay across price paths.
- Emphasis on transition risk rather than endpoint predictions.
Why it matters:
The largest flow-driven moves tend to occur during transitions, not when positioning is already extreme. Scenario analysis allows users to anticipate where pressure may emerge before it becomes visible in realised data.
Auditability and explainability (reinforced validation)
The provider should allow users to trace outputs back to inputs.
Look for:
- Transparent methodology explaining how signals are constructed, sized, and filtered.
- The ability to explain why positioning looks the way it does at a given price or volatility regime.
- Clear links between model outputs, execution assumptions, and validation results.
Why it matters:
Flow analytics are frequently used in risk discussions, execution planning, and internal reviews. If users cannot explain the logic behind the numbers, the data cannot be relied upon when it matters most.
Bottom line
A high-quality algorithmic flow analytics provider does not just estimate positioning—it demonstrates:
- Where flows come from
- Whether they can realistically execute
- How they change as markets move
- And how those conclusions are validated
Without these elements, flow data becomes a narrative tool rather than a decision-support framework.
Discover the leading solution for global commodity tracking
A solution for every market
With thousands of users across the globe, Kpler enables customers to find signal in the noise and position themselves for success.


