
A complete guide to container tracking
The operational question around container tracking has shifted from "where is it now?" to "when will it arrive, and what will it cost if it doesn't?"
For beneficial cargo owners (BCOs), freight forwarders, and terminal operators, schedule reliability is volatile – chokepoints can close in days and congestion at a single terminal can ripple across an entire trade lane.
This guide covers:
- How container tracking works
- Where traditional methods break down
- Which data sources matter
- How automation and predictive analytics change the workflow
- What good practice looks like
Container tracking fundamentals
What is container tracking?
Container tracking is the monitoring of a container's status and location as it moves across ships, terminals and inland transport, from booking at origin to gate-out at destination.
Businesses do it to protect delivery commitments, manage inventory, plan inland haulage and warehouse capacity, and avoid costs such as demurrage and detention.
Three terms are often used interchangeably but describe different things:
- Vessel tracking monitors the ship, e.g. position, speed, course and port calls.
- Container tracking follows a specific unit through the milestones recorded against it.
- Shipment tracking is the wider view of an order or consignment, which may span several containers, modes and legs.
Good container visibility links all three. A container's status is only as reliable as your understanding of the vessel carrying it and the terminal handling it.
The container lifecycle
Tracking systems record events at each stage, most commonly Gate In, Loaded on Vessel, Vessel Departure, Transshipment, Discharged and Gate Out.
Key identifiers
- Container number, structured under ISO 6346, identifies the individual unit.
- Bill of lading number ties containers to the contract of carriage.
- Booking number references the original reservation with the carrier.
- Vessel name and voyage number link the container to a specific sailing.
Mismatches between these identifiers are a frequent source of friction when data moves between carriers, forwarders and internal systems.
The B2B challenges in container tracking
For a handful of shipments, a carrier portal is usually adequate. At scale, the weaknesses compound.
Fragmentation across carriers
Each major line, including MSC, Maersk, CMA CGM, Hapag-Lloyd and Evergreen, runs its own portal with its own data format, event naming and update cadence. A team managing five carriers is effectively running five parallel tracking workflows that do not talk to each other.
Limited visibility during ocean transit
Carrier updates are largely event-driven, so there may be few between departure and arrival. Teams know a container is on the water but not whether the voyage is going to plan.
Unreliable ETAs
The ETA published at booking is a starting assumption, not a forecast. Schedule changes, port congestion and weather all move it.
Delayed carrier updates
A vessel can sit at anchor outside a congested port for 36 hours before the tracking system reflects any change. By then, warehouse scheduling, customs pre-clearance and inland haulage have been booked on outdated assumptions. If a carrier's system is delayed or offline, the shipper's visibility disappears with it, and teams fall back to manual checks.
The operational consequences
When teams lack timely, accurate visibility, the impact shows up quickly in cost and service:
- Demurrage and detention when containers or equipment are held beyond free time.
- Missed transshipment connections, which can add days or weeks to a transit.
- Inventory shortages when stock arrives later than planned.
- Wider supply chain disruption as one late vessel affects production schedules and customer commitments.
The scale is significant. Industry estimates put the cost of demurrage and detention, together with time lost at congested ports, in the billions of dollars each year. One study found shippers incurred nearly US$321 million in additional interest expenses in 2021 alone as cargo sat idle. With over 90% of world trade moving by sea, these inefficiencies weigh on trade performance as a whole.
The data sources behind container tracking
No single source tells the whole story. Container tracking draws on three main types of data: what the carrier reports, what the vessel is physically doing, and what is happening on the ground at the terminal. Each answers a different question, and each has its own strengths and blind spots. Understanding what each one can and cannot tell you is the starting point for building a tracking approach you can rely on.
Carrier tracking systems
Carrier systems provide booking information, container events and schedule updates, and are the authoritative record of what the carrier has processed. Their limitations are timing and scope, meaning updates can arrive hours or days after the physical event, and visibility is limited to what each carrier publishes.
AIS vessel tracking data
The Automatic Identification System (AIS) is a transponder system through which vessels broadcast identity, position, speed and course, received by terrestrial and satellite networks.
For container tracking, AIS offers continuous, independent signals from the vessel itself, regardless of whether the carrier has processed an event. It allows teams to monitor vessel position, follow voyage progress against the expected track, and detect delays early.
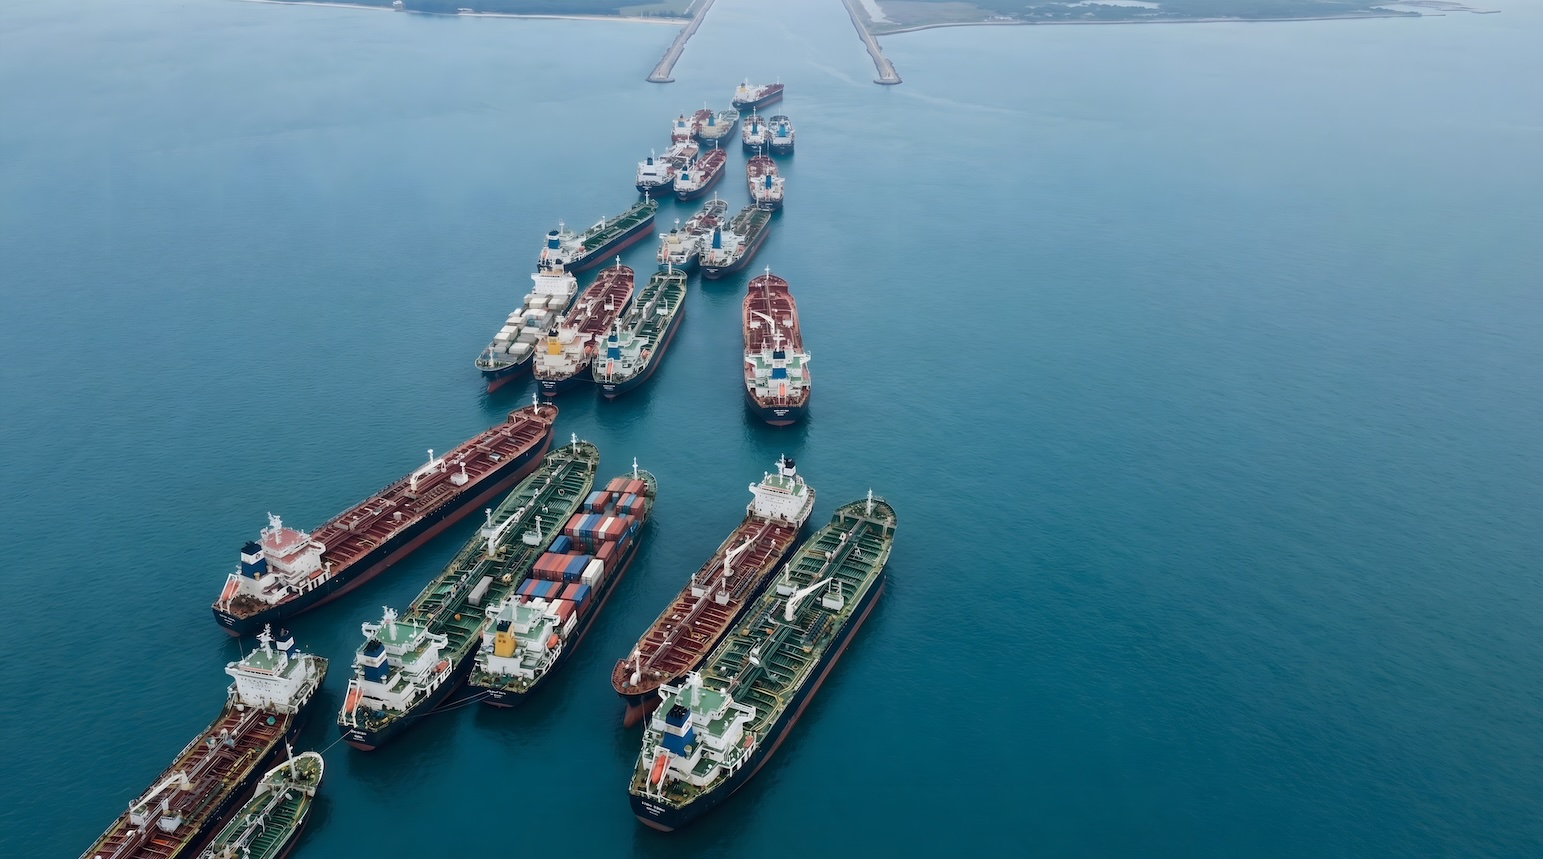
A vessel anchoring outside a port – a common indicator of berth congestion – can be visible hours or days before a carrier records a delay milestone. AIS coverage also keeps position intelligence available when a carrier feed is delayed or absent.
Port and terminal data
Terminal systems capture gate-in, loading, discharge and handling events, confirming that a milestone has physically happened rather than being inferred from a schedule. They also provide the context ETAs depend on, including berth availability, queue length and throughput.
Combining sources
Carrier data shows what the carrier has recorded. AIS shows what the vessel is doing. Terminal data shows what is happening at the quay and in the yard. Combined, they improve accuracy, timeliness and confidence. Alone, each has blind spots.
Why terminal-level visibility matters
Port-level data is a blunt instrument. A hub may operate several terminals, each with its own berth availability, wait times and throughput. A port that looks congested on average can contain one terminal in severe backlog alongside others running normally.
Durban illustrates the point. It is the largest and busiest port in sub-Saharan Africa, handling up to 31.4 million tons of cargo and 4.5 million TEU a year across 58 berths and more than 20 terminal operators. The World Bank's 2024 Container Port Performance Index ranked it 403rd of 403 ports, based on severe vessel delays and low terminal productivity.
Port-level data for May to June 2025 suggested only a mild deterioration:
- Vessel calls fell 11% and calling TEU capacity fell 4%.
- The share of vessels experiencing waiting rose from 93.2% to 95.8%.
- Average waiting time rose 28%, from 19.7 to 25.3 hours.
- Average staying time fell 22%, from 63.3 to 49.2 hours.
The terminal view told a sharper story. Terminal 1 and the Multi-Purpose Terminal performed relatively well, while Terminal 2 was the clear bottleneck. A vessel calling at Terminal 2 faced a very different outcome from one calling at Terminal 1, though the "Durban delay" figure was the same.
For BCOs and forwarders, terminal data supports carrier negotiations and routing decisions. For terminal operators, it enables benchmarking and a clearer view of where queues form.
How to automate workflows with container tracking software
The manual process is familiar:
- Log into multiple portals
- Copy ETAs into a spreadsheet
- Cross-reference bookings
- Email updates internally
It is time-consuming, error-prone and hard to scale. As volumes grow, teams either add headcount or accept degraded visibility. Manual tracking also lags at the worst moments. Congestion, schedule changes and cargo rollovers cascade, and a team checking portals twice a day cannot respond at the speed they require.
What automation looks like
Container tracking software replaces the check-and-log cycle with a continuous data pipeline. Three workflows deliver most of the value:
- Automated shipment tracking: monitoring hundreds of containers at once, queried by container number, booking reference or bill of lading.
- Real-time status alerts: notifications for vessel departure, container discharge and shipment delays.
- Exception monitoring: detection of schedule changes, missed connections and unexpected rerouting.
Exception management is where logistics expertise adds value. A team that no longer spends hours copying ETAs can respond to the exceptions that matter.
Integration with business systems
Automation only pays off if data reaches the systems where decisions are made:
- Transportation Management Systems (TMS), Enterprise Resource Planning (ERP) platforms, and supply chain visibility or control tower dashboards.
- APIs and webhook notifications matter here, because pushing an alert when a milestone occurs removes the latency of batch updates and polling.
- Alignment with Digital Container Shipping Association (DCSA) standards helps too. Consistent event naming, data structure and milestone definitions reduce the custom mapping needed to connect carrier data to internal systems.
The result is centralised operations, automated reporting and better planning.
Moving from "where" to "when" with predictive terminalanalytics
Traditional tracking answers where your container is. Predictive analytics answers when it willarrive.
Predicting arrival times
A forward-looking ETA accounts for the variables that move arrival dates, such as vessel speed and position against the expected track, schedule reliability, port congestion, weather and berth availability.
Predictive scheduling that combines AIS position data, historical port call patterns and terminal performance can generate vessel-level and terminal-level schedules six weeks or more ahead. That window suits decisions typically made weeks before arrival, such as warehouse capacity planning, haulage pre-booking and supplier communication.
Detecting delays early
Predictive signals often appear before a delay is formally recorded, for example, a vessel slowing, congestion building at the next port of call, a transshipment connection at risk. Useful congestion indicators include vessel counts at anchor against historical norms for the same terminal and period, average berth waiting time, vessel turnaround and container dwell time.
Commonly cited benchmarks:
- Major hubs might average 6 to 12 hours of berth waiting in efficient periods. Multiple days indicates significant congestion.
- Calls that normally take 24 to 36 hours but stretch to 48 to 72 hours or more point to terminal capacity constraints.
- Yards above 75 to 80% utilisation struggle with positioning efficiency, slowing loading and discharge.
- Import dwell of 3 to 5 days is normal at efficient ports; congested terminals may see 7 to 10 days or longer.
- Efficient operations typically deliver 25 to 35 moves per crane per hour.
Using historical data
Historical analysis reveals average transit times, route reliability, carrier performance and seasonal congestion patterns, supporting carrier selection, negotiation and realistic transit assumptions in inventory plans.
How port congestion spreads
Congestion is the most common reason tracking data and reality diverge. It occurs when vessel volume exceeds a terminal's ability to process it.
Typical drivers are demand surges (terminals built for steady volume struggle with sudden 30 to 40% increases), ultra-large vessels of 18,000+ TEU that handle 3,000 to 5,000 containers per call, labour disputes, equipment constraints, weak landside rail and road access, and weather.
Delay then propagates. A vessel delayed three days at one port arrives three days late at every subsequent port on its rotation. Congestion also holds ships in port, reducing effective fleet capacity, pushes carriers to speed up and burn more bunker to recover schedule, and strands equipment at destination while origin exporters face shortages.
Carriers may respond with congestion surcharges, for example tiers of US$200, US$500 and US$1,000+ per container tied to berth waits of 24 to 48 hours, 48 to 72 hours and beyond 72 hours. Terminals use peak-period pricing, density-based fees and dwell-time penalties.
Global rankings of "the most congested port" shift with season, volume and disruption. For a specific shipment, live conditions on your own trade lanes and terminals matter more than any ranking.
Reading a chokepoint disruption through vessel data
Independent, vessel-level visibility is clearest in a fast-moving disruption. After the escalation affecting the Strait of Hormuz on 28 February 2026, container operations across the Gulf entered a period of uncertainty. Roughly 20% of global oil flows and a significant share of regional container trade pass through the strait. Carriers paused new bookings, vessels slowed or stopped near the strait, and some services diverted.
An AIS-based analysis of container vessels on Gulf services between 28 February and 4 March showed this snapshot:
Several points stand out:
- Carrier responses differed. Of 18 MSC vessels linked to Gulf services, 15 had diverted. CMA CGM had largely moved away from Gulf calls, and Maersk was split, with about half its ships diverted and the rest awaiting instructions.
- Trapped vessels create hidden downstream risk. Ships inside the Gulf with next ports outside the region could not continue their rotations, stalling onboard cargo. Among the top five carriers, CMA CGM had 14 vessels inside the Gulf, MSC 12, Maersk 8, Cosco 7 and Hapag-Lloyd 6.
- Vessel behaviour led the paperwork. Ships holding at the Gulf entrance or changing destination in AIS data signalled events before formal schedule updates. In a crisis, individual vessel movements are the earliest signal.
- Alternatives have limits. Hubs such as Salalah and Khor Fakkan were not designed to absorb Jebel Ali's volumes, so a large shift in flows would likely create congestion there. Queue length and average wait show where diverted cargo may stall.
- Costs follow. Several carriers introduced substantial emergency surcharges on Gulf-linked cargo, and MSC declared voyages to Gulf destinations ended, discharging shipments at the next available port. The fuller effects were expected in later weeks as trapped vessels disrupted downstream service loops.
7 best practices for container tracking
Seven practices stand out for turning tracking data into better decisions, whether you ship as a BCO, move cargo as a forwarder, or run vessels and terminals:
- Centralise tracking: Replace carrier-by-carrier portal checking with a unified view across carriers.
- Monitor proactively: Track vessel movements in transit, not just port events. Treat anchoring, slowing and route changes as early warnings.
- Set automated alerts: Container discharge, shipment delays and schedule changes, routed into existing workflows.
- Track the right KPIs: Average transit time, delay frequency, port dwell time and carrier reliability.
- Align tracking with inventory planning: Feed visibility into demand planning, warehouse scheduling and inventory management, so it informs decisions rather than sitting in a dashboard.
- Plan for congestion: Compare alternative terminals on congestion, transit time and total landed cost, and track each carrier's schedule reliability, since carriers do not respond to congestion equally.
- Protect yourself contractually: Limit congestion surcharge exposure, add schedule reliability commitments or delay compensation, and for congested markets consider earlier ordering, higher safety stock and sharing forecasts sooner.
The future of container tracking
Trade complexity, recurring disruption and just-in-time inventory models are driving demand for deeper visibility. Predictive analytics and real-time platforms are becoming the baseline, and standards such as DCSA's are making data easier to exchange. The shift is from location monitoring to decision support: knowing where a container is matters less than knowing whether the ETA will hold and what congestion awaits on arrival.
Fragmented portals, delayed milestones and unreliable ETAs leave teams reacting after the fact. The way forward is to combine carrier, AIS and terminal data, automate monitoring into the systems where decisions are made, look weeks ahead rather than hours back, and measure performance at the terminal, where delay originates.
Visibility is critical to efficient global trade. Organisations that treat container tracking as an operational discipline will act before the queue forms.

See why the most successful traders and shipping experts use Kpler

Container tracking & predictive ETAs