60 days of a broken US-Iran MoU: the market stopped waiting for Hormuz
The 60-day window under the Islamabad MoU lapsed on 17 August with no deal, no extension, and no talks under way. Kpler data shows the truce cleared the war's stranded backlog in 3 weeks and moved roughly 374 mb of crude out of the Gulf, but it never reopened the strait. This final piece in our weekly series closes the 60-day ledger and maps the export system the MoU leaves behind.
Key takeaways
- The 60-day window under the Islamabad MoU lapsed on 17 August with no agreement, no extension, and no negotiations under way: Tehran now asserts a permit-and-toll regime over the strait, and Washington rejects it.
- The MoU moved oil; it did not restore the strait. Crude clearance out of the Mideast Gulf ran at 6.1 mbd across the window, nearly 3 times the blockaded pre-MoU pace but around 40% of the ~15 mbd Hormuz averaged in 2025.
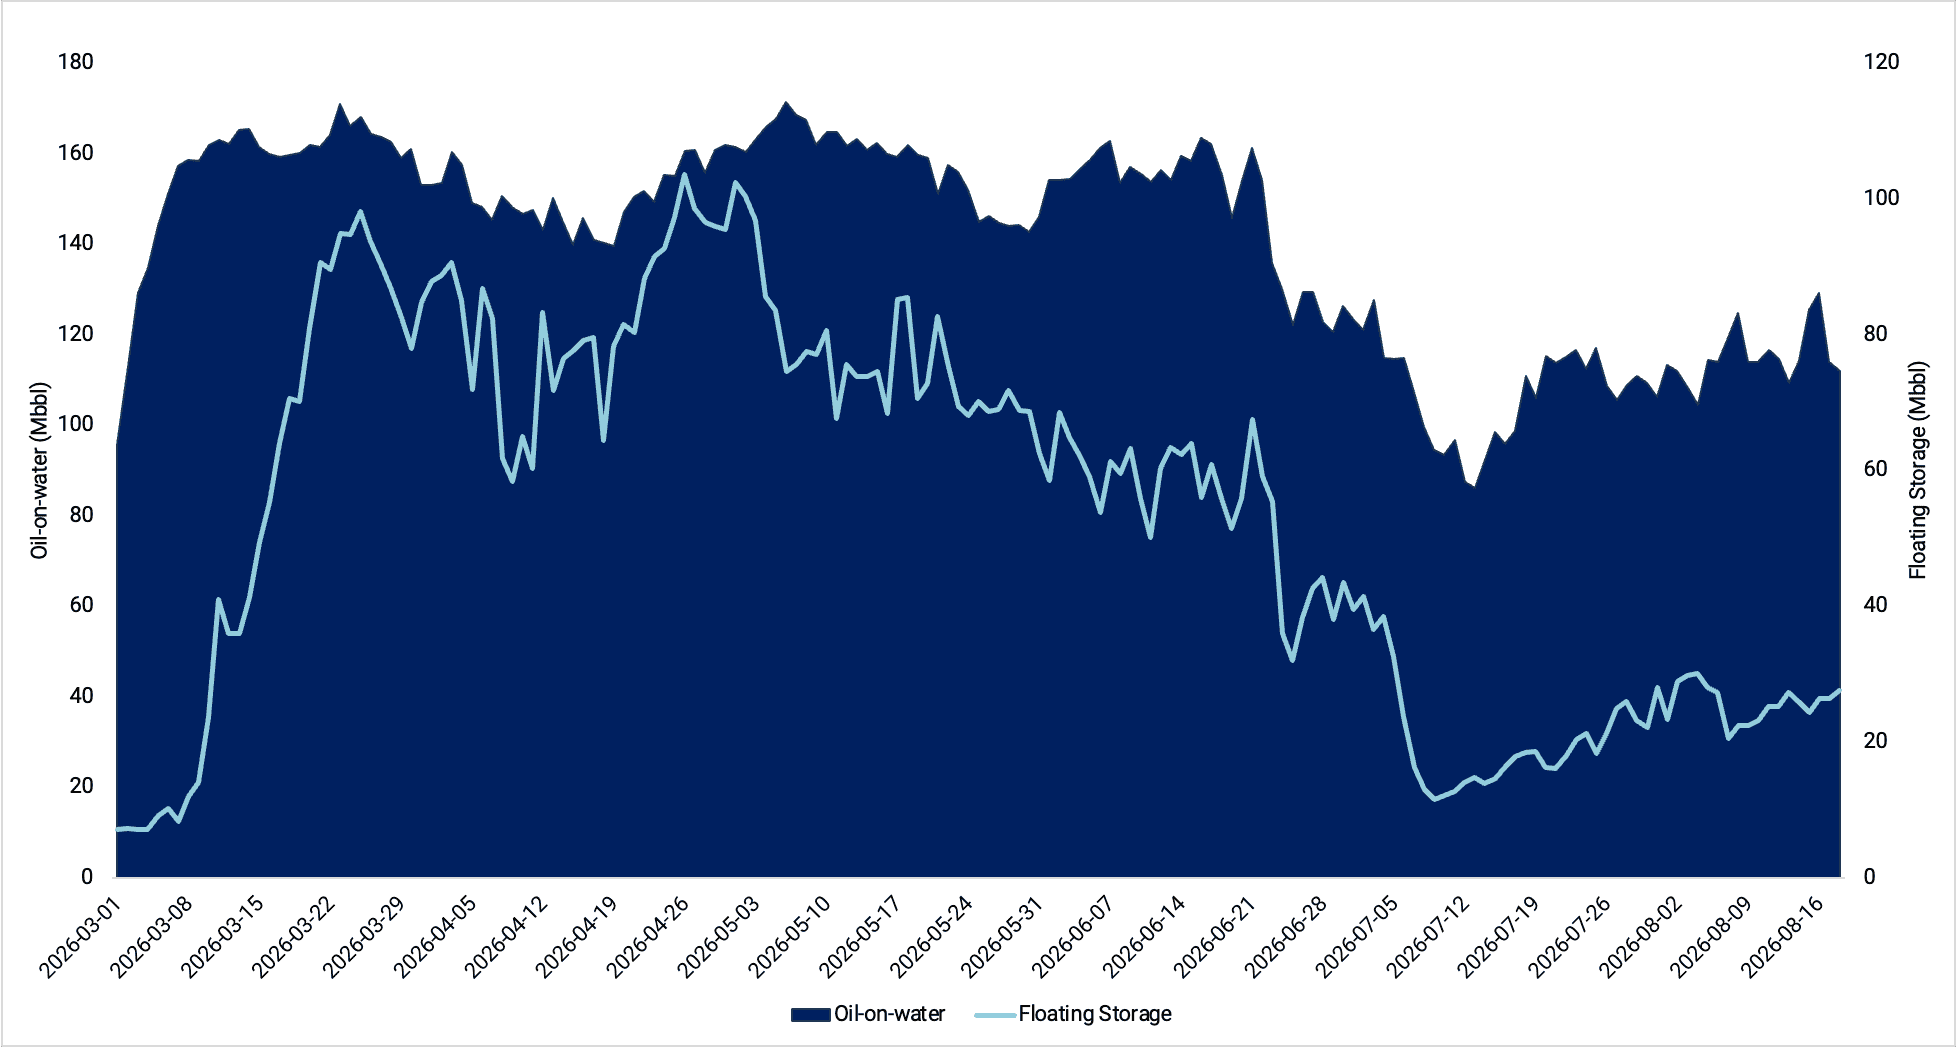
- The stranded backlog cleared; the system did not. Floating storage fell from 61 mb at signing to 16 mb within 3 weeks, but total crude on water inside the Gulf system closed the window at roughly 130 mb, above even the war's starting level.
- Every operative commitment failed early: the US oil waiver survived 20 of the 60 days, the blockade lift 27, and Iran's mine-clearance obligation was never completed.
- Iran ends the window exporting less than it did during the war, with crude loadings collapsing from 893 kbd in July to 156 kbd through 17 August.
- At expiry, the market is not betting on a reopening: final-week loadings near 4.9 mbd ran against confirmed clearance of 2.3 mbd, and ballast entries into the Gulf have fallen to about 2 per day.
- The bill lands in Q4: the window's shortfall against normal Hormuz flows is roughly 550 mb of crude, bridged so far by inventory draws and truce-window buffers that thin from September.
The window closes
In the third week of the US-Iran MoU, 95% of the barrels leaving the Gulf could be traced to the terminal that loaded them. In the final week, 66% could not. That reversal, more than any statement from Washington or Tehran, is the story of the 60 days.
The 60-day window established by the Islamabad Memorandum of Understanding (MoU) of 17 June lapsed at midnight on 17 August with no peace agreement, no extension, and no active talks. It was a formality rather than a cliff-edge. Iranian Foreign Minister Abbas Araghchi had dismissed the premise days earlier, saying Tehran "never had a ceasefire that would now need to be extended", and President Trump answered "No" when asked about an extension. On expiry day, Tehran declared the MoU nullified by US violations and announced mandatory transit permits and maritime environmental tolls; Washington rejected the claims and kept its convoy escorts and blockade enforcement. Brent crossed $90/bbl.
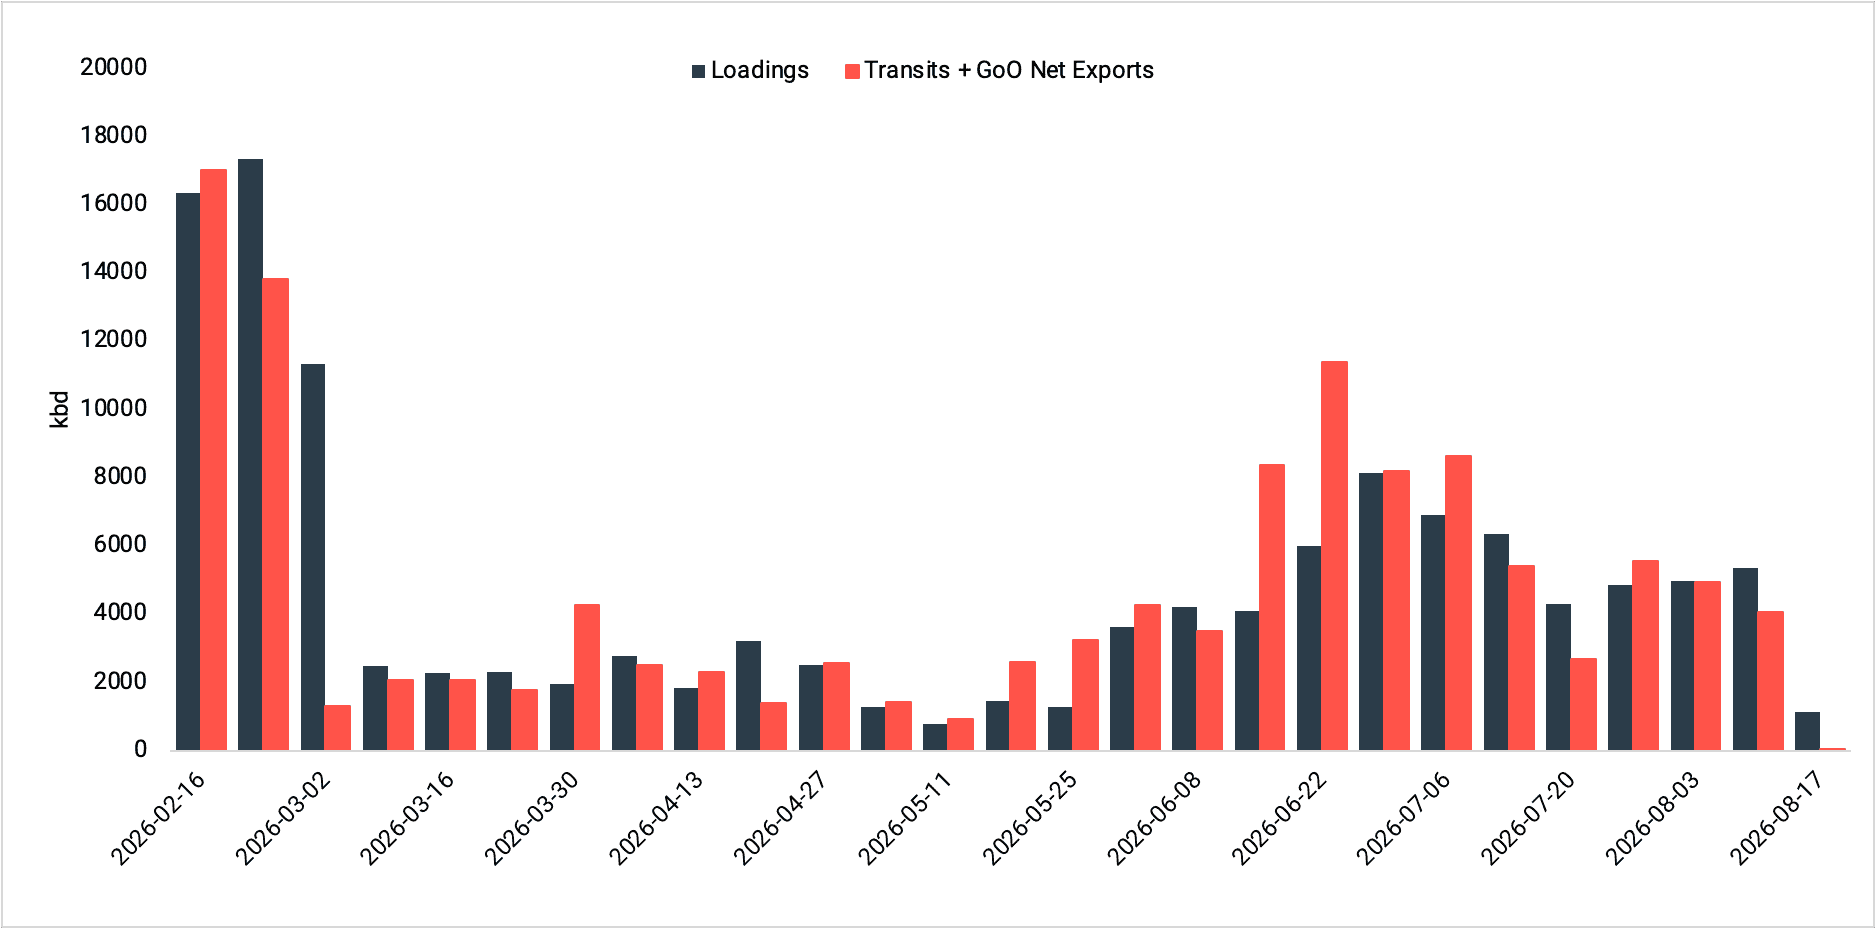
The physical record is easier to score than the diplomacy. The war closed the strait on 28 February, cutting off the outlet for roughly a fifth of global seaborne oil and stranding fleets of laden tankers inside the Gulf. The MoU reopened it partially: roughly 374 mb of crude cleared the Mideast Gulf across the window, about 6.1 mbd, against 2.3 mbd over the blockaded months from April to the signing. Clearance here means non-Iranian Hormuz transits plus Gulf of Oman net exports, a combined measure built to avoid double counting. But the truce never came close to restoring the strait: the run-rate is around 40% of the ~15 mbd Hormuz averaged in 2025, more than half of it moved in the first 3 weeks, and by the end the flow was thinner, darker, and re-accumulating behind the chokepoint.
The 60 days in one view
Weekly combined Crude/Co clearance versus Mideast Gulf Crude/Co loadings, MoU weeks 1–9 (mb)
Source: Kpler
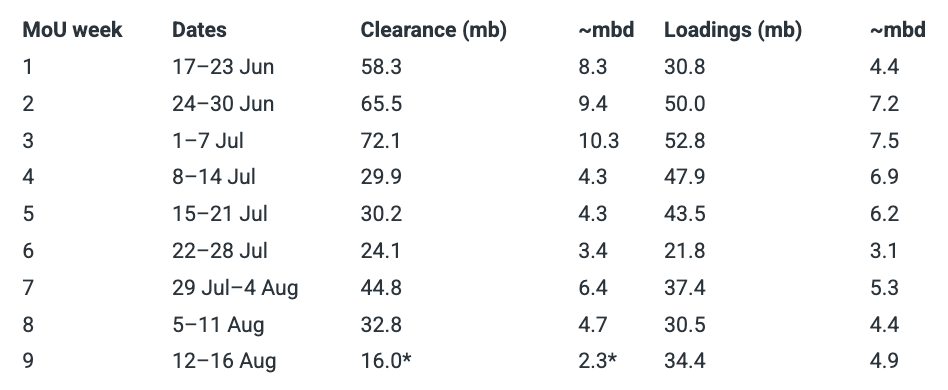
*Floor: the most recent week carries the heaviest confirmation lag, and revision history suggests the true figure will settle 1.5 to 2 times higher. Clearance and loadings are Crude/Co only. Total crossings of all liquids and LPG averaged 8.8 mbd across the window, roughly 547 mb, of which crude and condensate made up 418 mb.
Did the backlog clear? Half of it did. The war left 2 stacked problems inside the Gulf, and the MoU solved only 1 of them. The first was stranded ships: idle floating storage of crude, laden tankers sitting for a week or more, peaked at about 104 mb in late April and still stood at 61 mb when the MoU was signed. Within 3 weeks the truce cut it to 16 mb, and that is the backlog clearance the strong early numbers reflect. The second problem was the flow itself, and it never healed. Total crude on water inside the Mideast Gulf and Gulf of Oman fell from 165 mb at signing to 107 mb by 7 July, then stopped falling. It stood at roughly 130 mb as the window closed on 16 August, easing to 110 mb by 18 August, still above the roughly 96 mb of the war's start. The stranded ships got out; the system that put them there is still in place, and by the final week it was refilling.
Crude on water (left) and floating storage (right) inside the Mideast Gulf and Gulf of Oman, 1 March to 18 August (mb)
Source: Kpler fleet metrics
The strait went dark twice. The first measure is the share of clearance surfacing only as Gulf of Oman net exports: cargo appearing in the Gulf of Oman with no confirmed upstream, the residue of the shuttle system we mapped in our June explainer. Before the MoU that unattributed share ran at around 28%. At the Week 3 peak it fell to 5%, as vessels loaded openly and crossed with the Automatic Identification System (AIS) on. From Week 4 it ratcheted straight back, reaching 66% of a shrinking total in the expiry week. The second measure is the route label on each crossing. The southern Omani corridor opened under JMIC guidance on 20 June, peaked at 48 crossings in Week 2, and was effectively gone by Week 4 after attacks on vessels using it. The IMO route followed, at zero from Week 5. What was left was a binary strait: a fading Iranian route, and a Dark/Unknown share that never fell below 44% and closed the window above 80%. The collapse was cross-product, too: LPG crossings fell to zero in mid-July, and LNG carriers halted for almost 3 weeks before resuming in late July, running dark. The MoU's visibility dividend was real, and it did not survive the MoU.
Weekly Strait of Hormuz crossings by confirmed route, all vessels, MoU weeks 1–9 (count)

Source: Kpler
The 6 dates that decided the window:
- 17 June: the MoU is signed, setting a 60-day negotiation window, free safe passage, and US commitments to lift the naval blockade within 30 days and issue oil waivers; the US Office of Foreign Assets Control (OFAC) issues General License X on 22 June.
- 7–8 July: the LNG carrier AL REKAYYAT and tanker WEDYAN are attacked, OFAC revokes the waiver with wind-down only to 17 July, and US retaliatory strikes follow. Day 20 of 60.
- 12–14 July: GFS GALAXY, MOMBASA B, and AL BAHYAH are struck, the southern Omani route never recovers, and the US reimposes its naval blockade of Iranian ports. Day 27.
- 20–25 July: the Houthis declare a maritime embargo on vessels serving Saudi ports, shifting the kinetic centre to the Red Sea, and the Jizan refinery is struck and shut. In the days that follow, US strikes pause for 4 days and clearance does not respond: the binding constraint is mines, war-risk insurance, and IRGC interdiction, not US ordnance.
- 4 August: Tehran approves a dual-lane transit framework on a second, separate 60-day clock, with zero tolls and mine clearance of the main lane within 30 days; clearance rallies, but the mine work never starts.
- 17 August: the window lapses; Tehran asserts a permit-and-toll regime and Washington rejects it.
The pattern across those dates is symmetrical: each side's headline concession was withdrawn within a month, and each blamed the other's violation. By the final fortnight, the argument had moved on from the MoU entirely, to whether Iran can charge for passage that Washington insists is free.
The full report is available to Kpler Insight clients and contains:
- Week-by-week clearance vs. loadings data (Weeks 1–9)
- Floating storage drawdown vs. total crude-on-water levels
- Unattributed/dark cargo share and route-by-route crossing breakdown
- Timeline of the 6 key dates/incidents across the 60 days
- Gulf loadings by origin country + ballast entry indicators
- The 5 export reroute paths (Bab el-Mandeb, Yanbu, Suez-SUMED, etc.)
- Iran's export collapse: Kharg Island loadings, dark-fleet anchorage, buyer-side data
- War-risk insurance pricing, VLCC rates, stranded vessel/seafarer figures
- 5 structural shifts left behind and 5 forward indicators to watch
Kpler delivers unbiased, expert-driven intelligence that helps you stay ahead of supply, demand, and market shifts.
Trade smarter. Request access to Kpler today.

See why the most successful traders and shipping experts use Kpler