Real time data across LNG, onshore gas, and power markets.


.webp)


428.86 Mt
830+
5 year
4 week
Crude oil
Coal / petcoke
Iron ore
Grains
LNG
LPG
Gasoline / diesel
Fertilizer
Metals
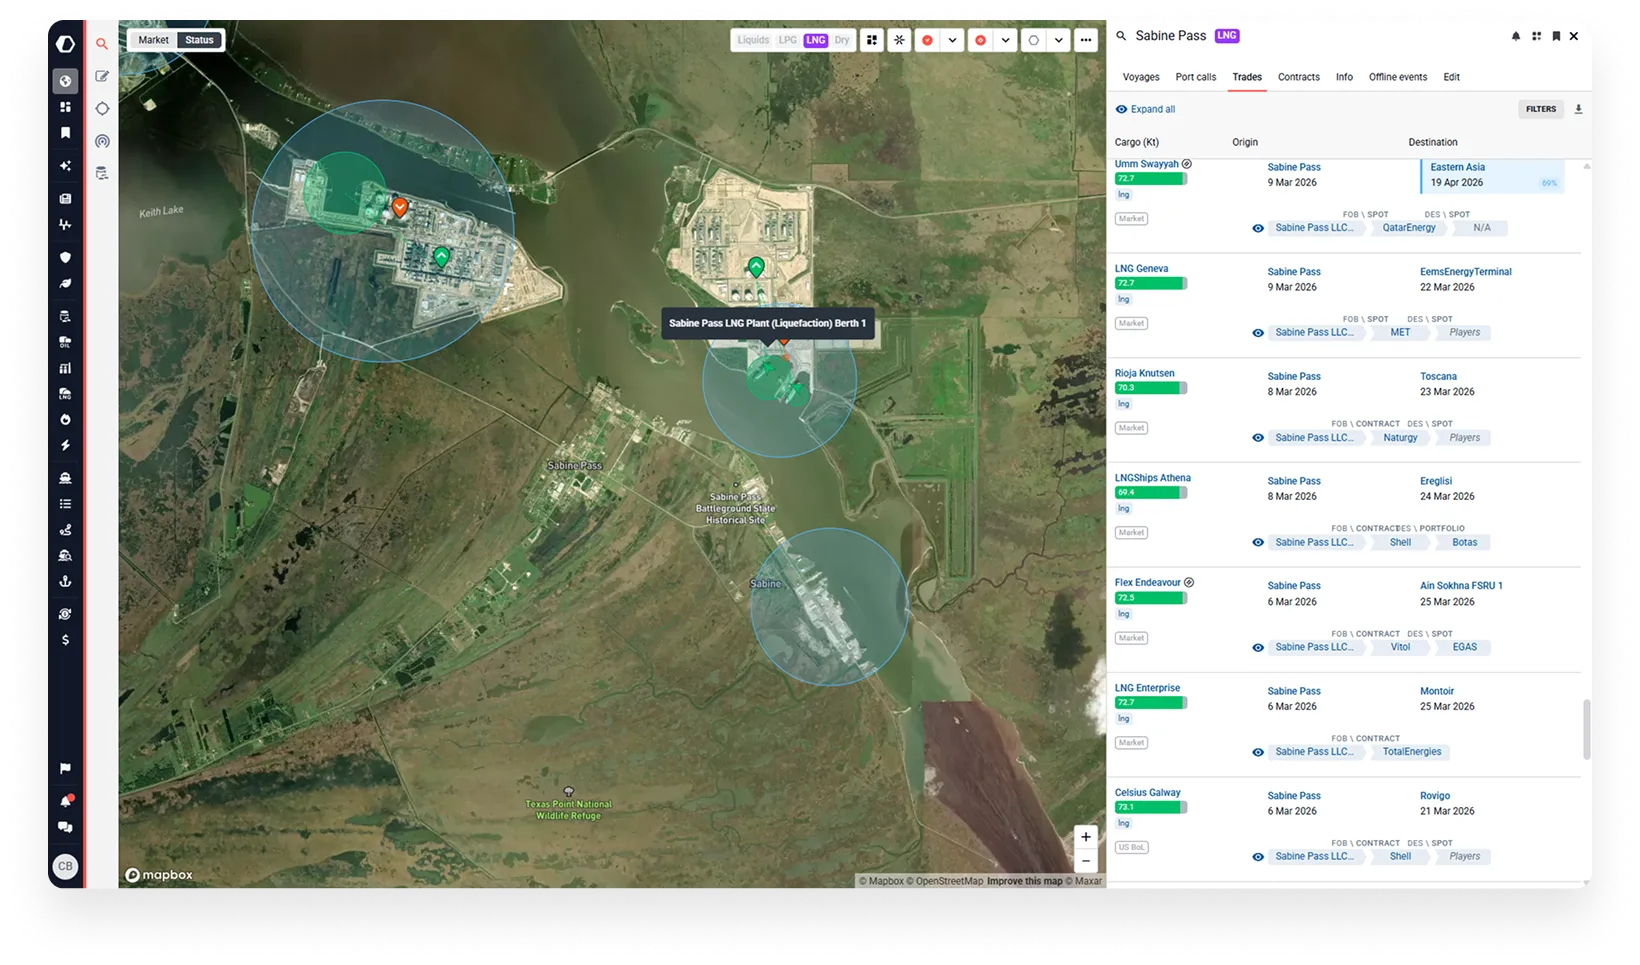
Monitor LNG cargoes with details like buyers, sellers, trade type, voyage details, including insight into diversions, tenders and LNG terminal outages.
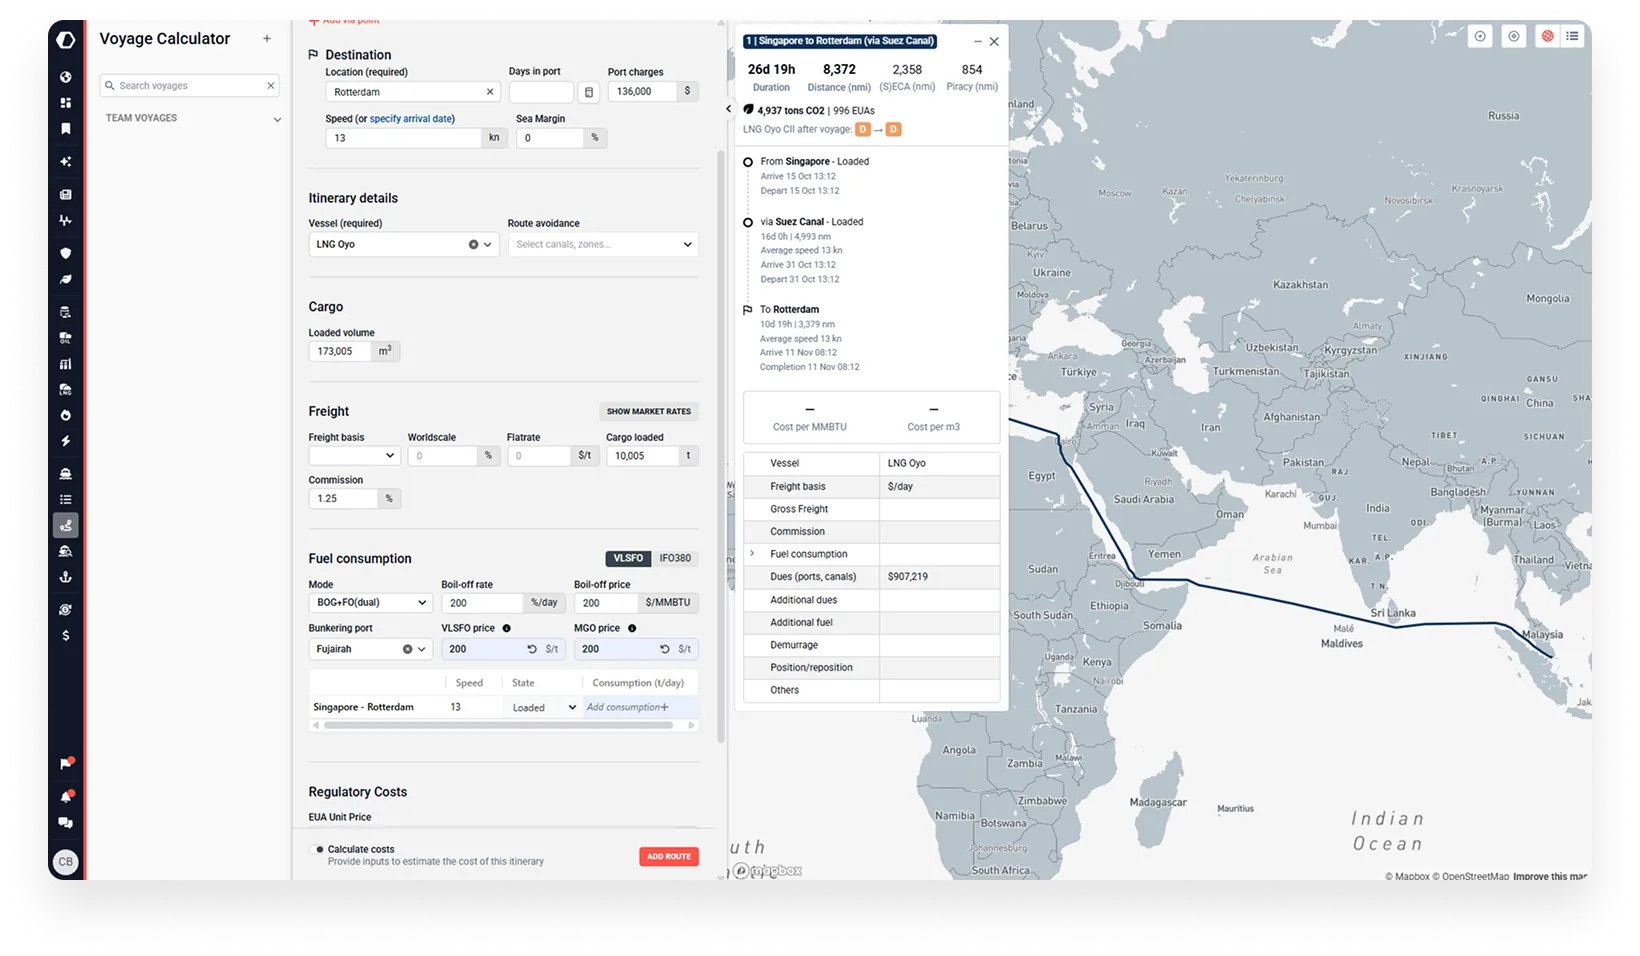
View real-time LNG freight congestion, fleet utilisation, along with tonmile, speed and other performance analytics for LNG carriers around the globe. Quickly identify opportunities with customisable dashboards that for critical updates.
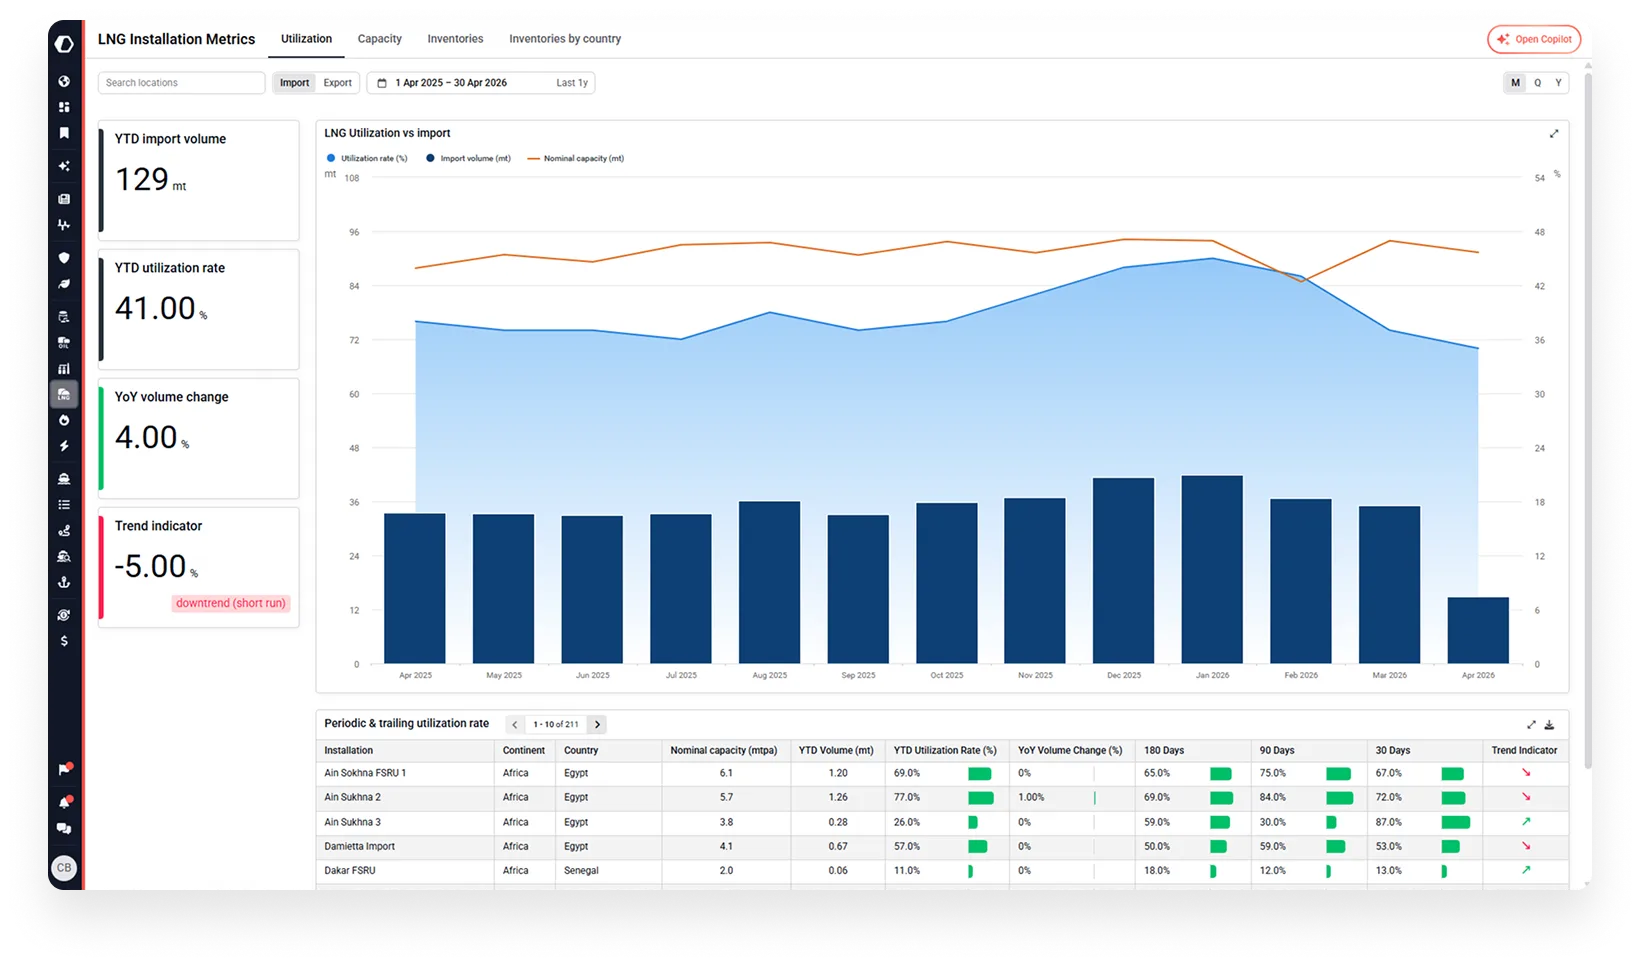
Analyze inventory by installation, country, and timeframe, identifying precise storage trends in Europe, the US, Australia. Access real-time utilization, capacity, historical data, and contracts for LNG terminals globally.
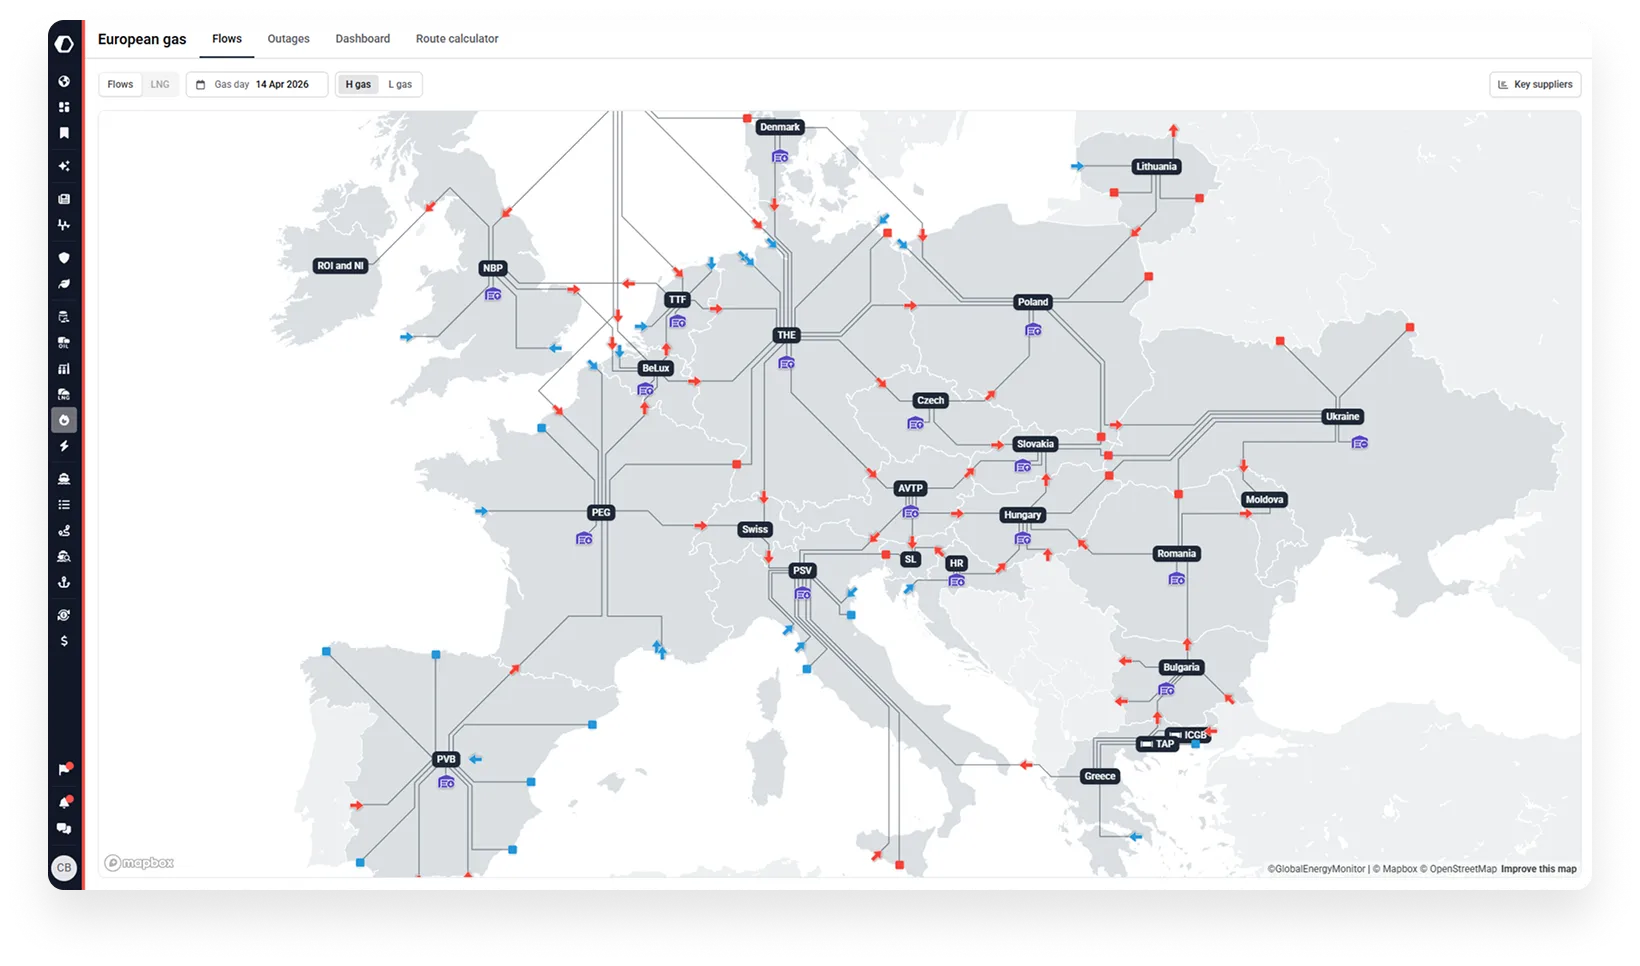
Real-time flows and tariff insights across European gas pipeline routes and major trading hubs like AVTP, NBP, PSV, THE, TTF, and more, for smarter, faster decision-making.
A one-stop-shop for data, analytics, and insights. Trusted by physical and financial market players to empower their decisions with confidence and speed.
“Best part? Kpler dashboards. I set up my metrics once, and they update in real-time. I can access the latest insights instantly.”


.webp)
FAQ
Kpler delivers a unified view across LNG, European natural gas, and power markets — connecting cargo flows, pipeline data, storage levels, outages, and price analytics in one platform. It covers 437,000+ Kt of LNG and gas tracked annually, 3,500+ TWh of power, and 5,300+ power and gas plants globally, giving traders and analysts a single, connected view across the full gas-to-power chain.
Kpler tracks 1,100+ LNG vessels in real time via the world's largest proprietary AIS network, combining vessel positions with near-term end-destination forecasts and European pipeline flow data. This unified view lets users assess how today's LNG cargo movements translate into tomorrow's gas availability — and what that means for power prices and generation mix.
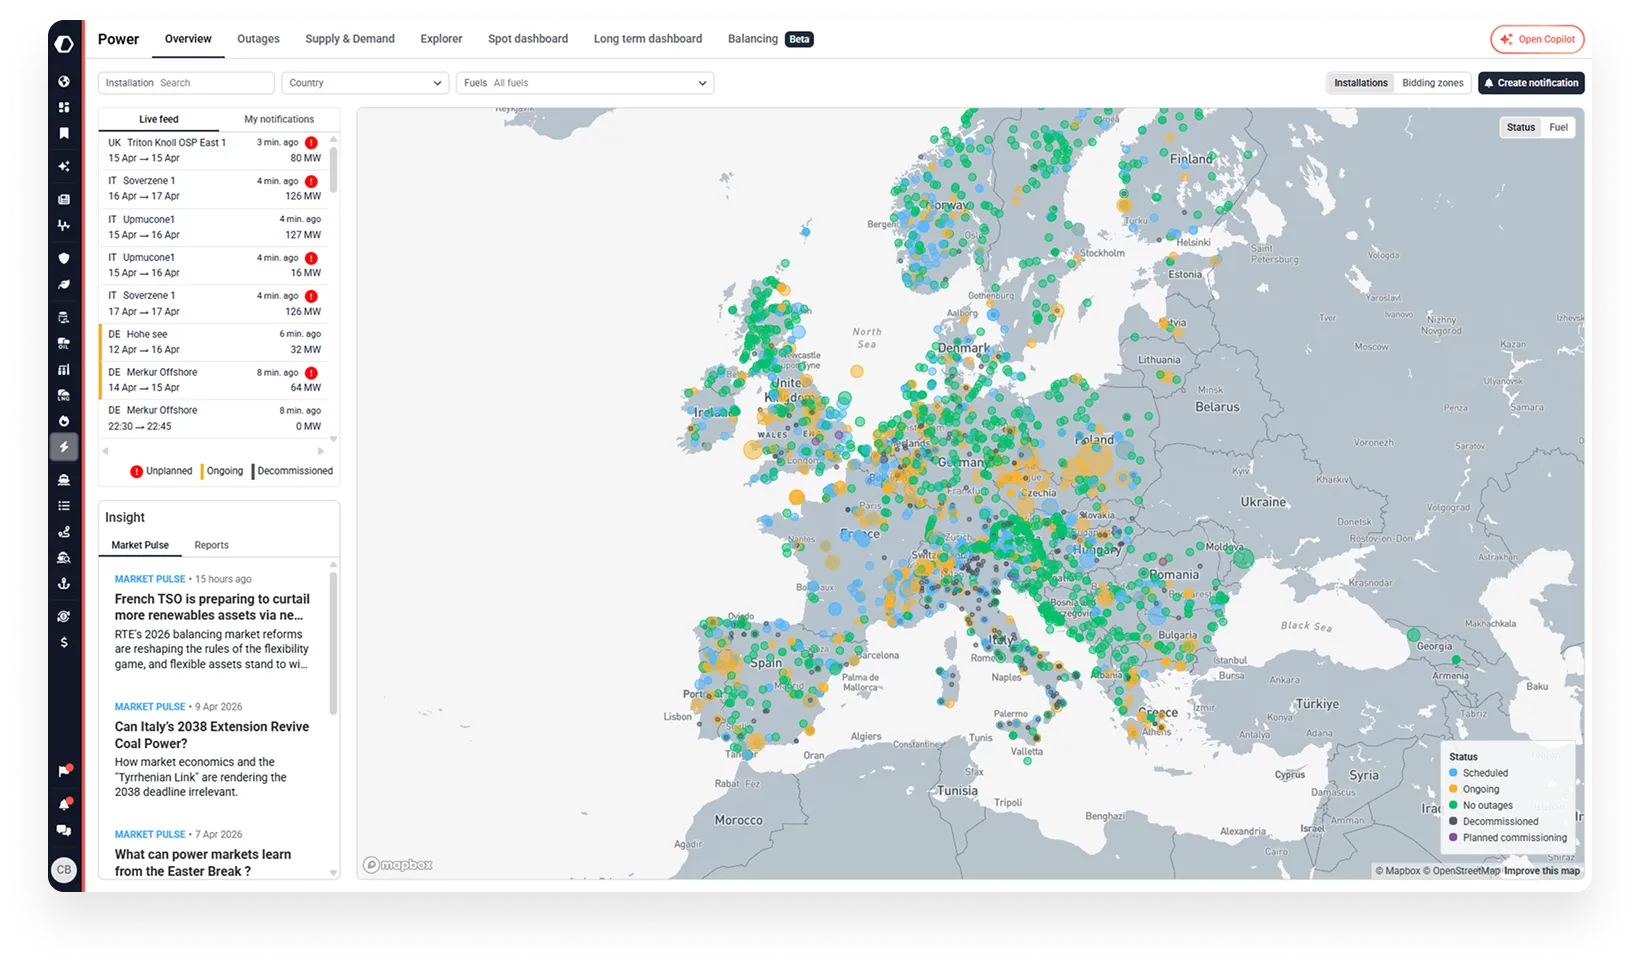
Kpler covers 48 European countries with power market data and analytics, spanning supply, demand, generation mix, outages, interconnections, and spot prices. Coverage links electricity markets with upstream gas dynamics and cross-commodity factors including weather, hydro stocks, and renewable intermittency.
Kpler monitors 230+ LNG and gas storage terminals globally, tracking ramp-ups, commissioning, maintenance, historic utilisation, and forecast capacity. Near-term LNG storage data is published alongside 15+ new market stories each week, highlighting patterns identified from proprietary cargo and installation data
Yes. Kpler aggregates pipeline flow, storage, and pricing data from Transmission System Operators (TSOs) across 23 countries, alongside 10-day gas consumption forecasts and spot price forecasts. A unique tariff analytics feature calculates transport costs for tailored European pipeline routes from regasification terminals to end consumers — enabling traders to assess netback margins directly within the platform.
Yes. Kpler tracks LNG bunkering fuel trades and volumes globally, with company tagging and market context delivered via a monthly report. Built on the combined depth of Kpler and MarineTraffic vessel data, it gives users a clear view of LNG adoption as a marine fuel — tracking fleet expansions, emerging bunkering hubs, and shifting demand patterns as the market evolves.