Arbitrage signals as leading indicators of flow allocation
See routing bias before flows confirm it
Kpler's backtest links crude arbitrage signals with subsequent physical flow allocation across
USGC, LatAm and WAF crude systems. The strongest relationships emerge when arbitrage
signals are compared with flows 15–45 days later, consistent with physical trading timelines.
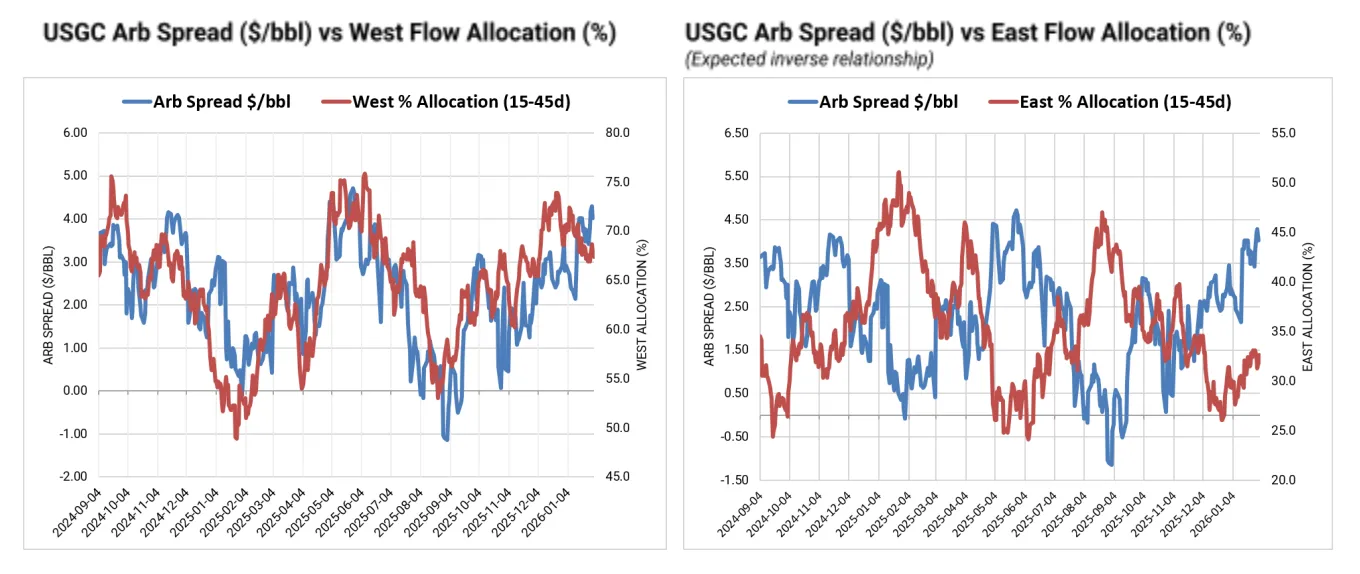
Figure 1 : West-to-East WTI Midland Arbitrage Spread versus USGC Flows
Arbitrage signals show a measurable lead relationship
Physical flows do not respond instantly. Across the tested systems, changes in destination economics are often reflected in subsequent flow allocation.
The relationship is strongest where barrels have optionality
Not all arbs matter
For USGC Midland, flow response becomes more pronounced once the West-East spread exceeds roughly +2 $/bbl.
From signals to action
Arbs are not cargo-level predictions. Freight, vessel availability, term commitments, refinery demand and quality constraints can all prevent a screen-open arb from being executed. Their value lies in identifying potential routing bias before it becomes visible in physical flow data.
- Monitor whether fixtures and nominations confirm a stronger Westbound pull.
- Track whether improving Eastbound economics are reflected in physical allocation.
- Distinguish between transient pricing signals and moves that ultimately influence where barrels clear.
You can download the full version of this report here.
Ready to transform your trading desk?
Book a personalised demo and discover how Kpler's Crude Arbitrage tool delivers the competitive edge you need.

See why the most successful traders and shipping experts use Kpler

.webp)