Real-time flows and tariff insights across European gas pipeline routes and major trading hubs.


.webp)


60
TSO tariffs
5+
- Full visibility over the European gas grid — tracking physical flows across LNG terminals, pipelines, and underground storage
- Compare European gas hub spreads, route and regasification costs, and transmission capacity
- Navigate evolving maintenance and outage events with up-to-date scheduling data
- Tariffs spanning historical periods from 2019 through the current and gas-year ahead
- Data aggregated from 60+ sources across the European gas network
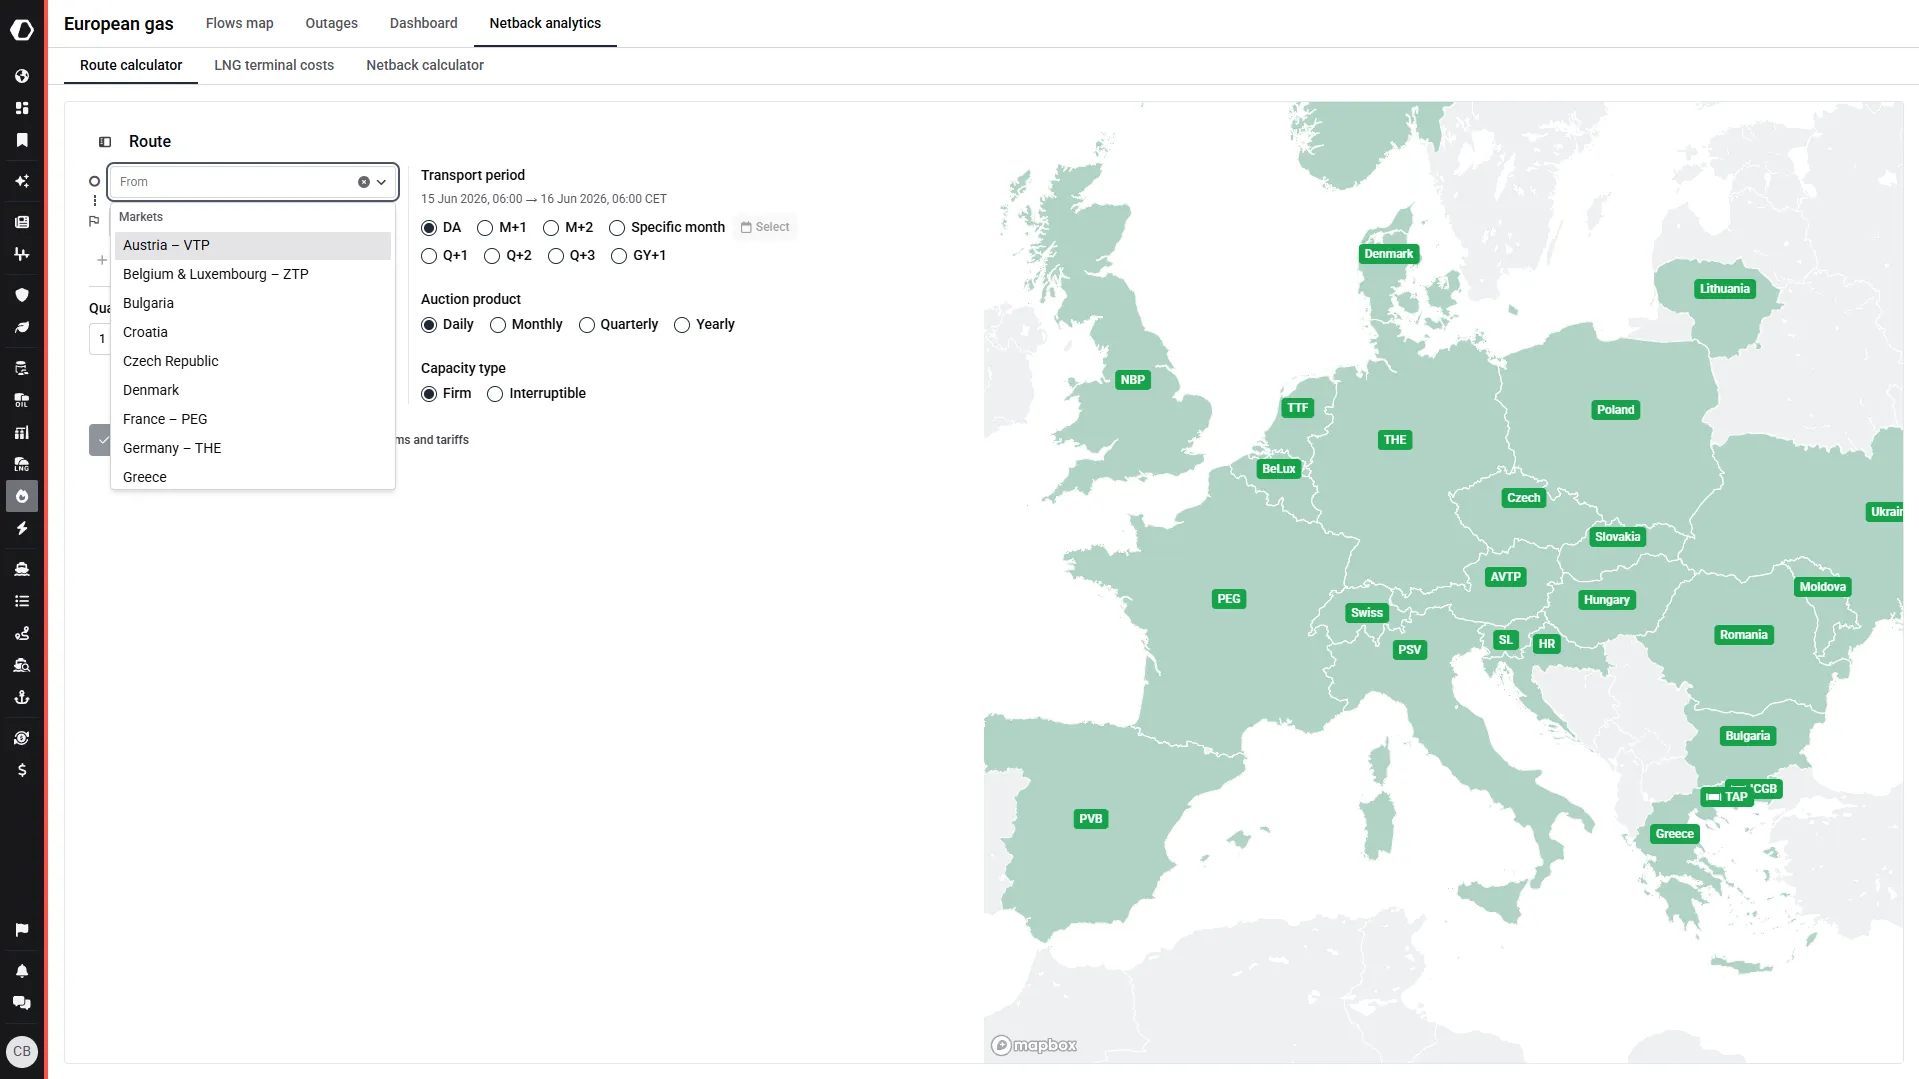
- Specify transport period, auction product, and capacity type to mirror your exact circumstances
- Evaluate all available routes based on entry and exit fees across fixed and variable costs
- View discounted routes for select journeys — pre-calculated from TSO-provided discount rates
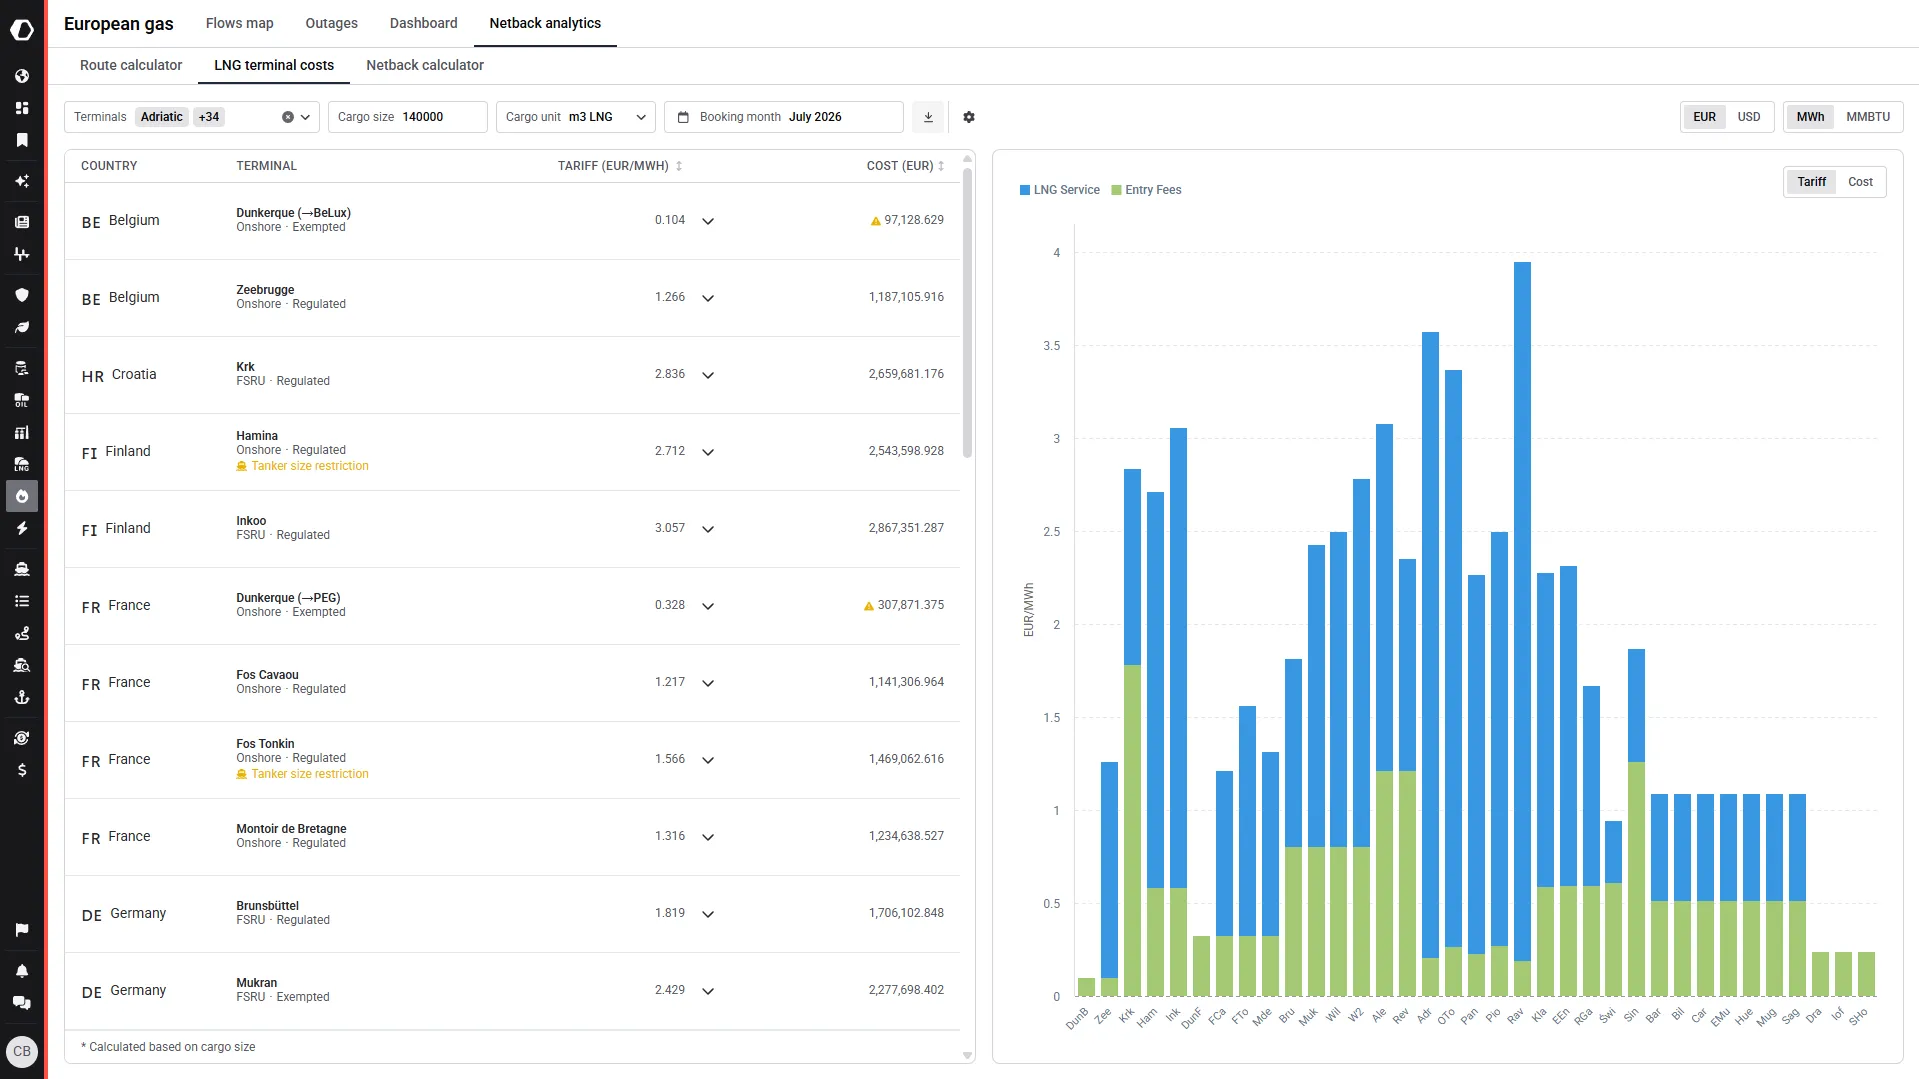
- Consider all pipeline tariffs associated with specific regasification plants to ensure all expenses are accounted for
- View live slot availability for last-minute scheduling
- Specify cargo volume, booking month, fees, and terminal(s) to output bespoke cost breakdowns
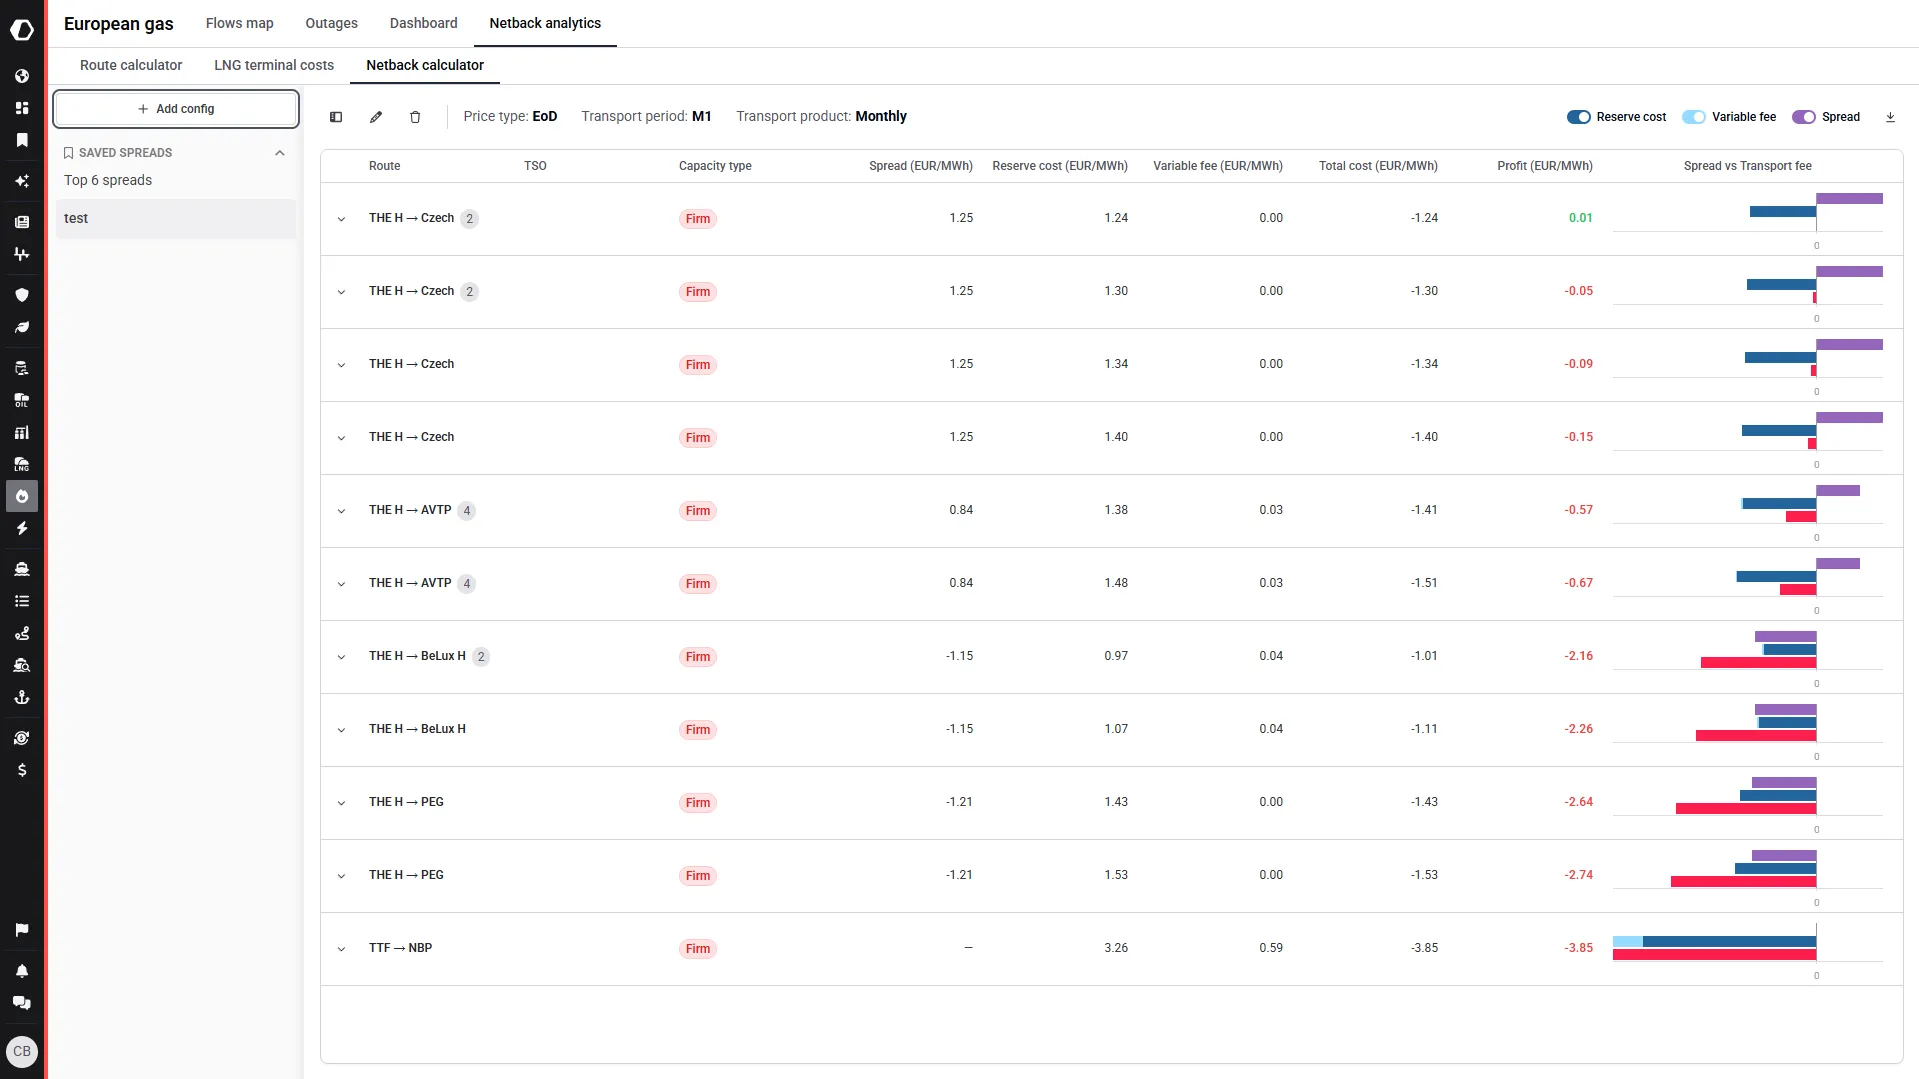
- Leverage price spreads for insight into potential hedging opportunities within the grid
- View a detailed breakdown of reserve cost vs variable fee, visualising the balance in a compact inline chart
- Match spreads between firm, interruptible, or mixed capacity to reflect your delivery structure
- Calculate assumed profit for specific price types, transport periods, and transport products
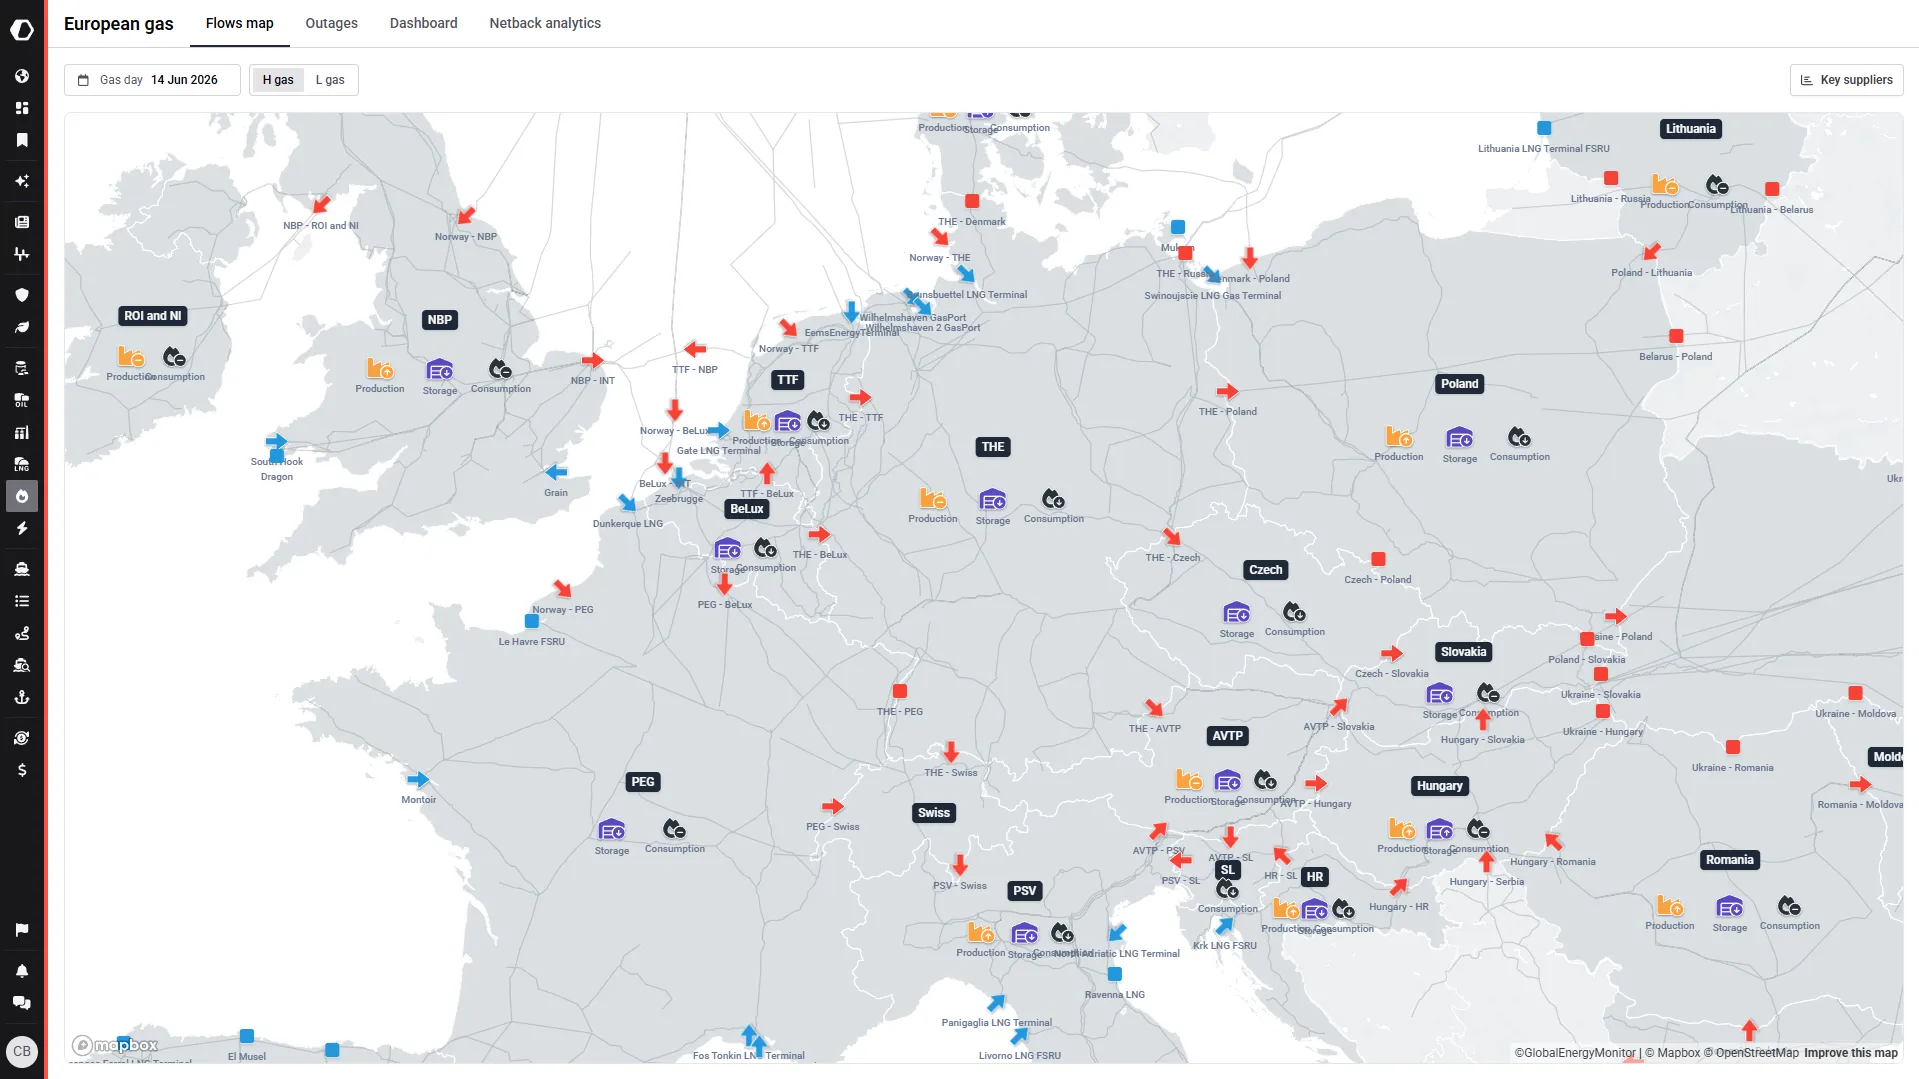
- Interactive map with net commercial flow and LNG sendout for interconnector points and terminals — granular storage injection, withdrawal, and fill rates at facility level
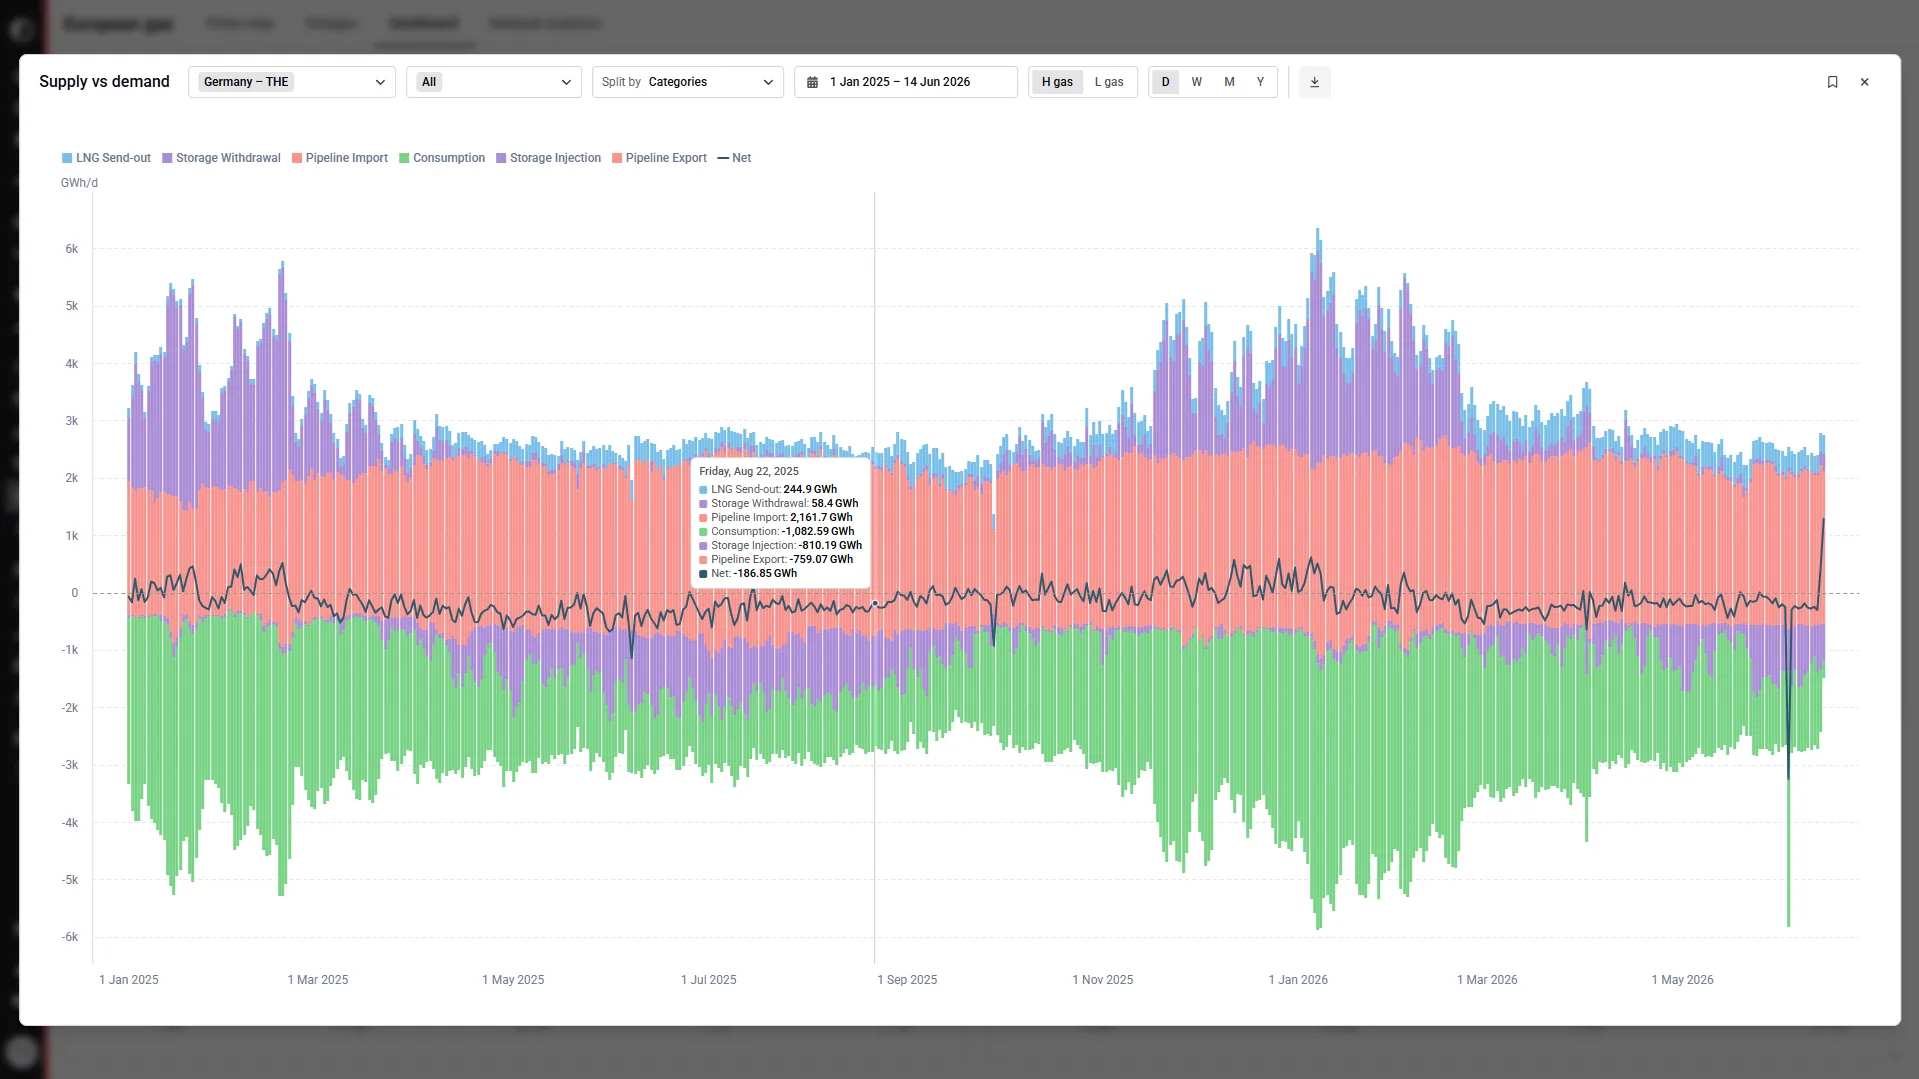
- Aggregated consumption and production expandable to individual points — plus pipeline exports for key suppliers split by receiving terminals
- Interconnector flow and usage rates including entry/exit capacity and nominations
- Track European gas maintenance works across (V)IPs and storage facilities — with outage duration, capacity reductions, and historical maintenance data to estimate future impacts
- Select wider routes to monitor all maintenance and outage activity along your shipment's journey
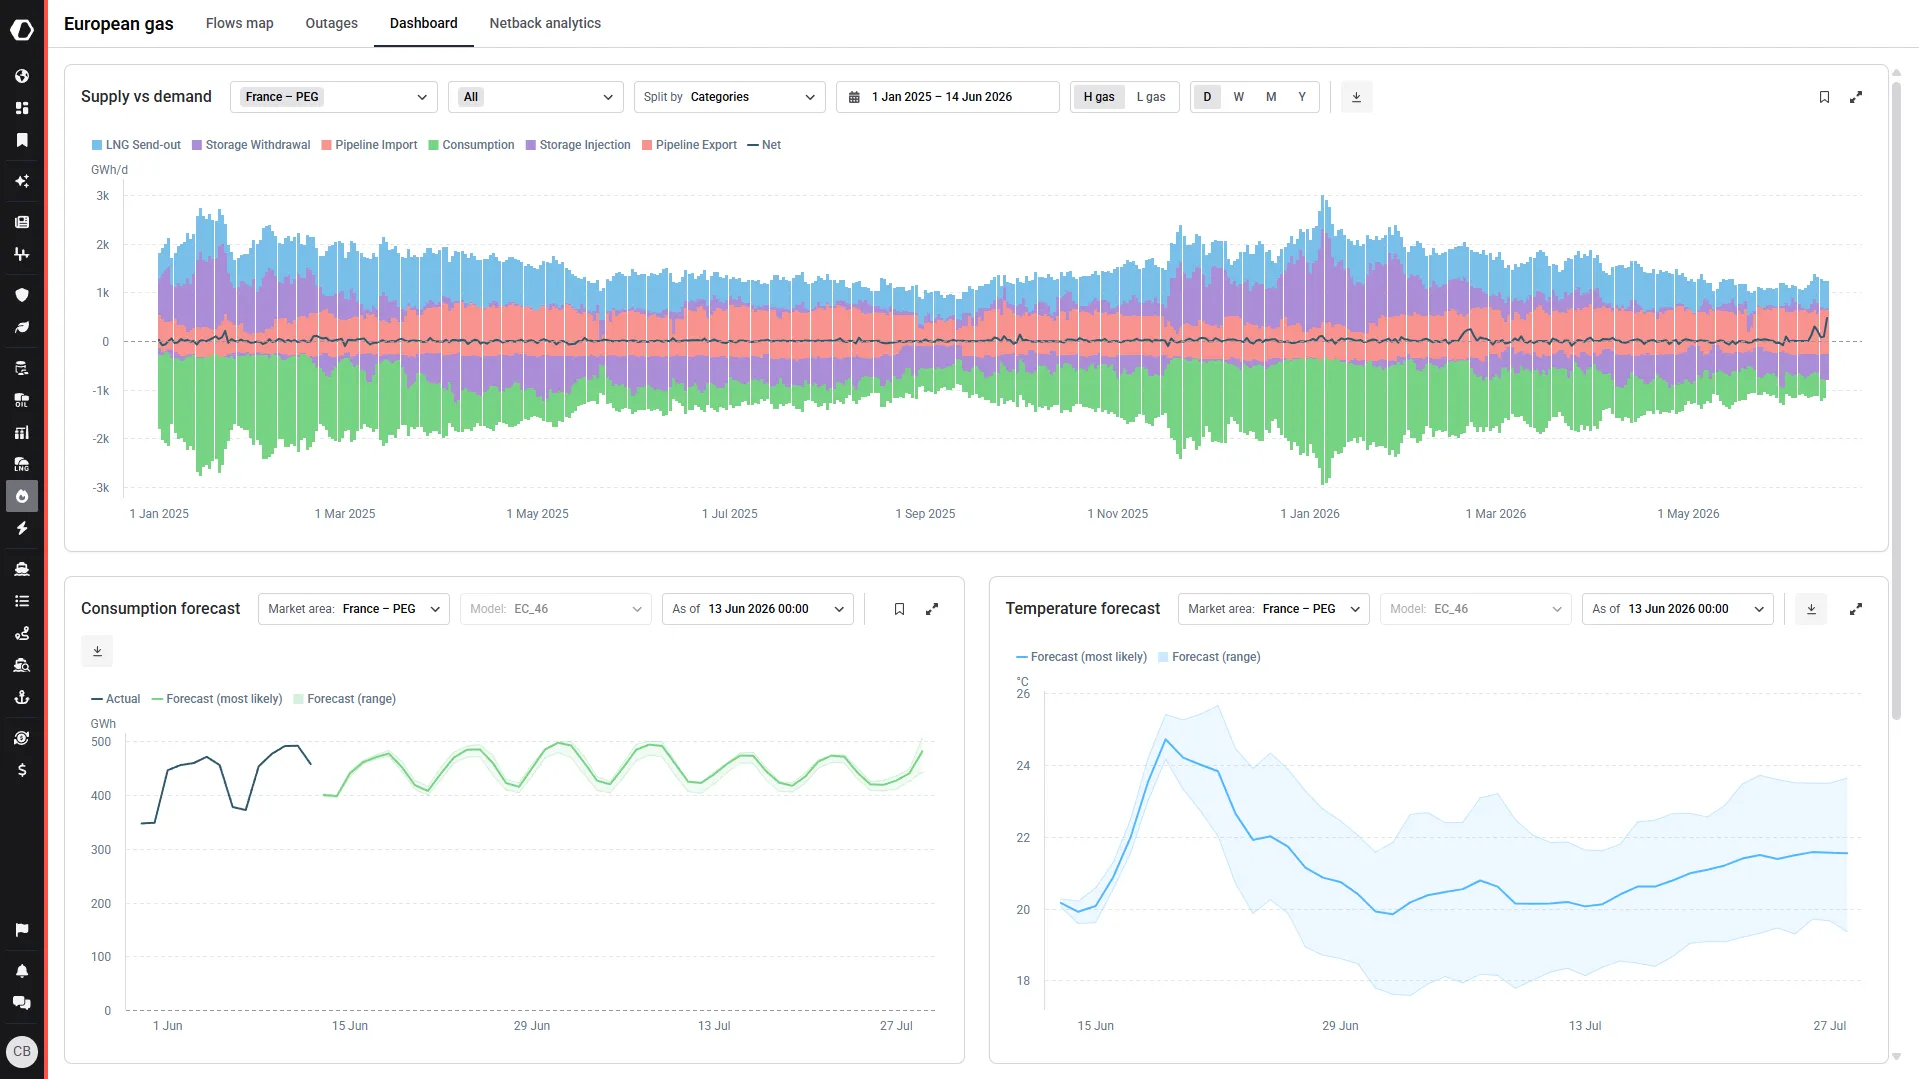
- Forecast consumption 46 days ahead based on Kpler's proprietary ML model
- Monitor individual or multiple market areas for an aggregated view of European gas balances
- Split views by categories, market areas, assets, operators, or neighbouring markets
- Analyse hub price trends across day-ahead, month-ahead, and longer contract periods

“It supports a more responsive insurance model, and gives us meaningful visibility in situations where speed and clarity really matter.”


.jpeg)
FAQ
The platform includes:
- Physical gas flows across pipelines, LNG terminals, and storage
- Tariffs (fixed and variable) and transport costs
- Storage levels, consumption, and production data
- Hub prices and spreads across major European markets
- Maintenance and outage information
This enables a full supply-demand and infrastructure view of the European gas market.
- Flow and TSO data: updated hourly
- Variable tariffs: updated daily
- Maintenance/outage data: updated up to 4 times per day
The platform covers major European gas hubs and markets, including:
- TTF (Netherlands), NBP (UK), PEG (France), THE (Germany)
- Southern and Eastern Europe (e.g. Italy PSV, Greece, Romania, Ukraine)
- Nordic and Central European regions
It provides a pan-European view of gas flows and trading hubs.
The Route Calculator helps users model gas transportation routes and costs by:
- Selecting origin, destination, and intermediary points
- Choosing transport period (e.g. day-ahead, monthly, yearly)
- Comparing firm vs interruptible capacity
It outputs transport costs, tariffs, and optimal routing options based on real market data.
The LNG Cost Calculator estimates regasification and total import costs for LNG shipments. It includes:
- Terminal tariffs and fees
- Shipping costs
- Capacity and cargo size inputs
Users can generate a full cost breakdown for LNG imports into Europe.
The platform tracks planned and unplanned maintenance events at at interconnection points and storage facilities. Users can:
- View outage duration and capacity reductions
- Filter by firm vs interruptible capacity
- Plan routes around disruptions
This supports better operational and trading decisions.