trusted by thousands of organisations worldwide


.webp)


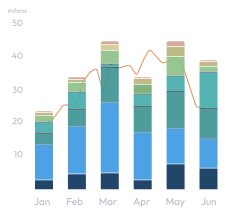
Monthly Exports
Global (LNG, by destination)
18+
Year history
1.2k+
Vessels tracked
590+
Installations covered
427.31+
Mt LNG exports tracked in 2025
- Track and analyze real-time trade flows live using filters across geography, buyer, seller and more to gain clarity in key market dynamics.
- Analyse changes in real time to volumes along critical trade routes, such as the US Gulf to Europe, Australia to Asia, Qatar to Asia, and more.
- Follow diversions, terminal outages, and tenders in real time with precise market data.
Request demo
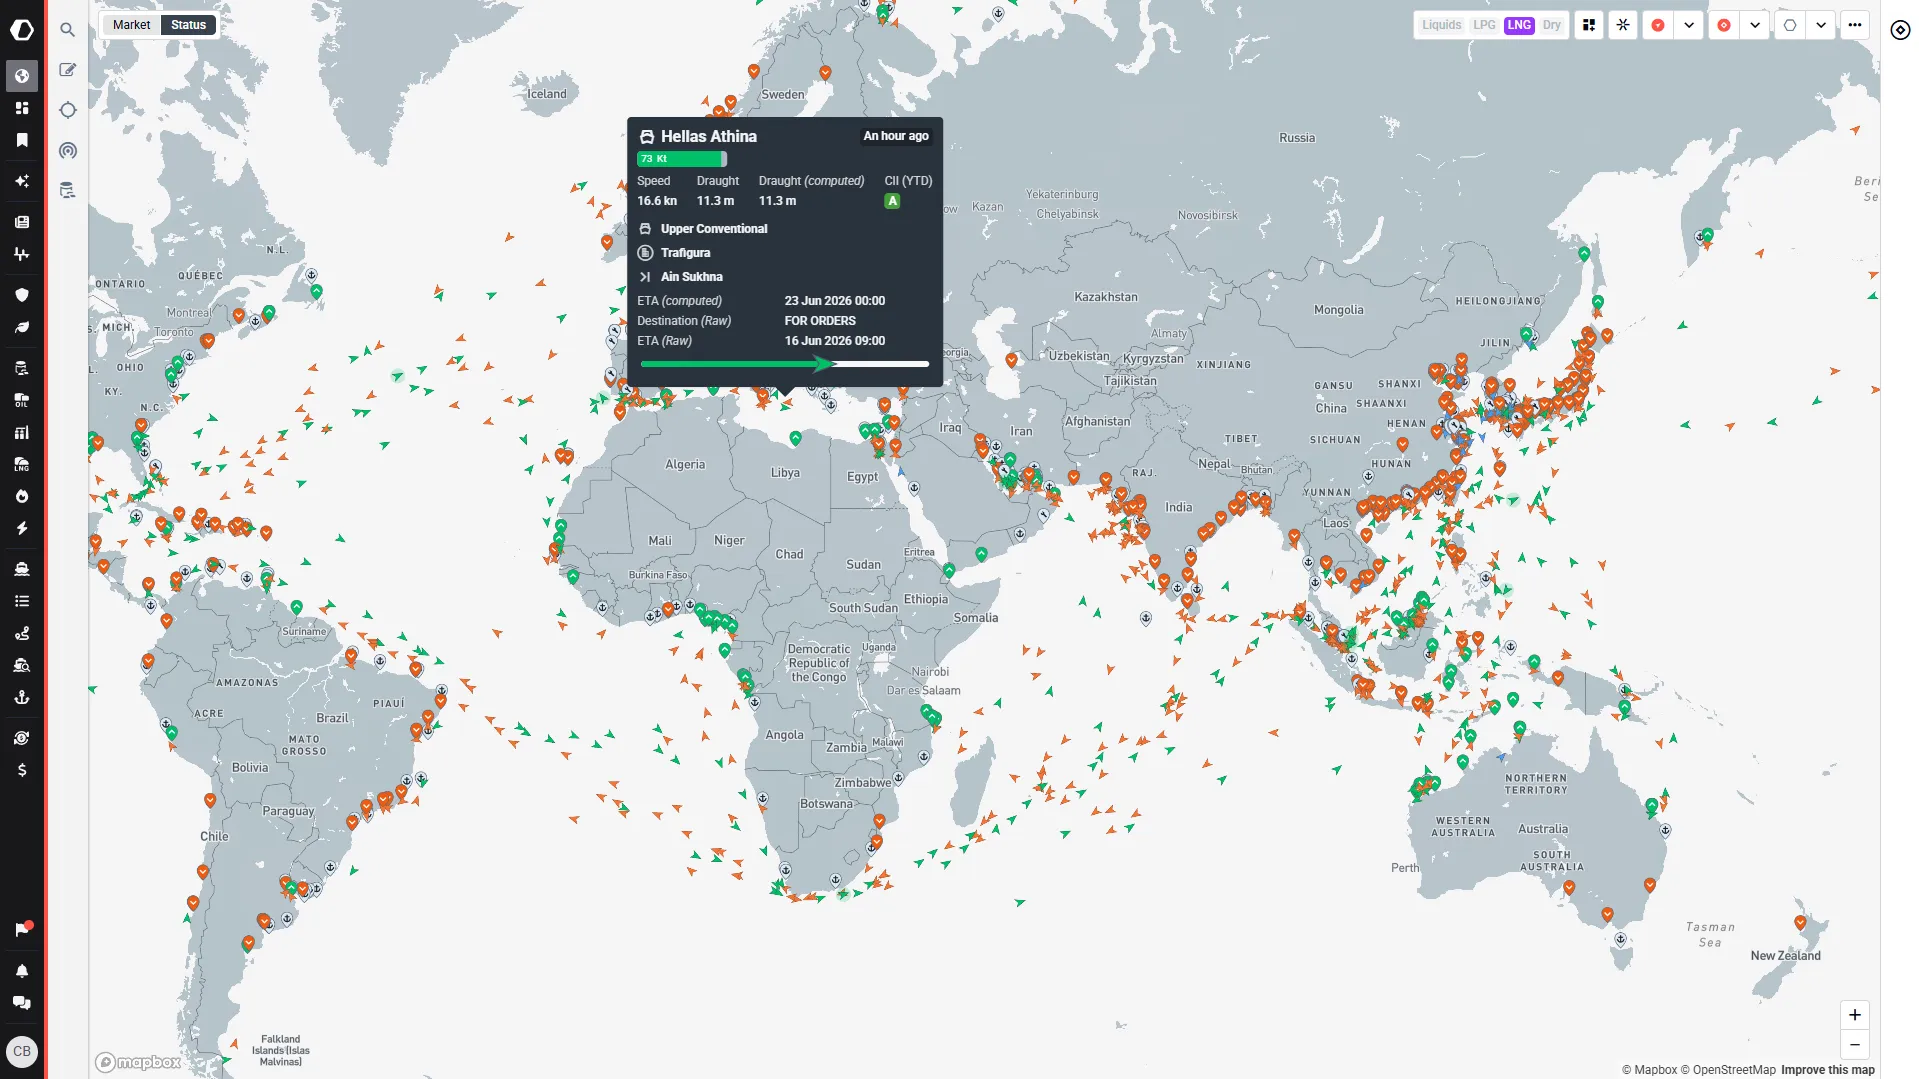
- Monitor activity by region, port, installation, vessel, and time frame to reflect your desired market
- Last signal, draught, speed, and state, including if the vessel is stopped, bunkering, ballast, or laden, give clear indications of incoming supplies
- Filter vessels by carrier type, status, and more to analyze specific behavioural patterns
Request demo
- Track planned and unplanned liquefaction outages with impacted volume estimates, updated continuously
- Seasonal charts shed light on patterns in supply and demand, with YoY charts to see the evolution of flows at any granularity
- View top players, changes to key trade routes, and potential arbitrage windows far before the wider market
Request demo

- Track US export ramp-ups or Asian demand shifts, major importers like KOGAS, JERA, and CPC, or exporters like Qatargas, Sabine Pass, and Yamal
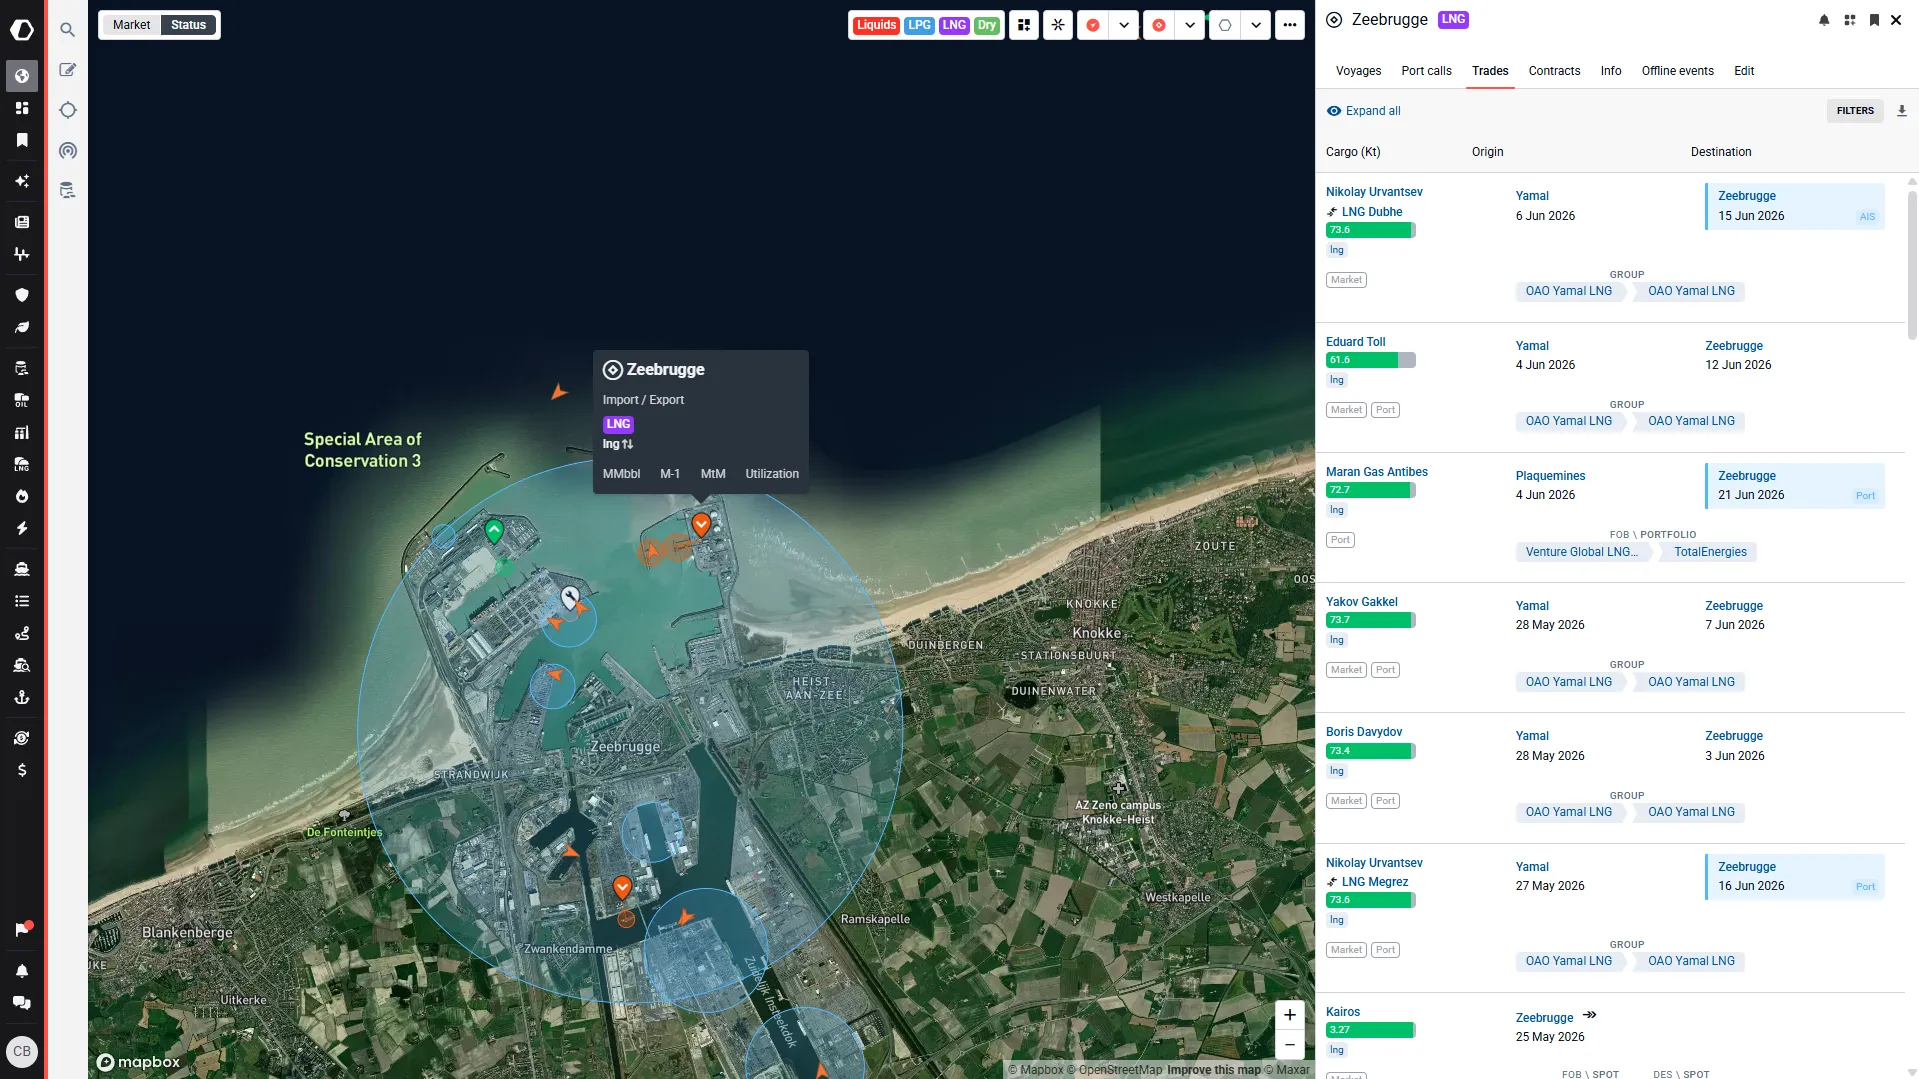
- Drill down to the individual voyage and cargo level, with buyers and sellers, origin and destination terminals, cargo size, and estimated arrival to spot transit bottlenecks, or surplus capacity before it impacts wider markets
- Track trade flows between producing and consuming regions, enhancing your view of supply and demand dynamics
Request demo
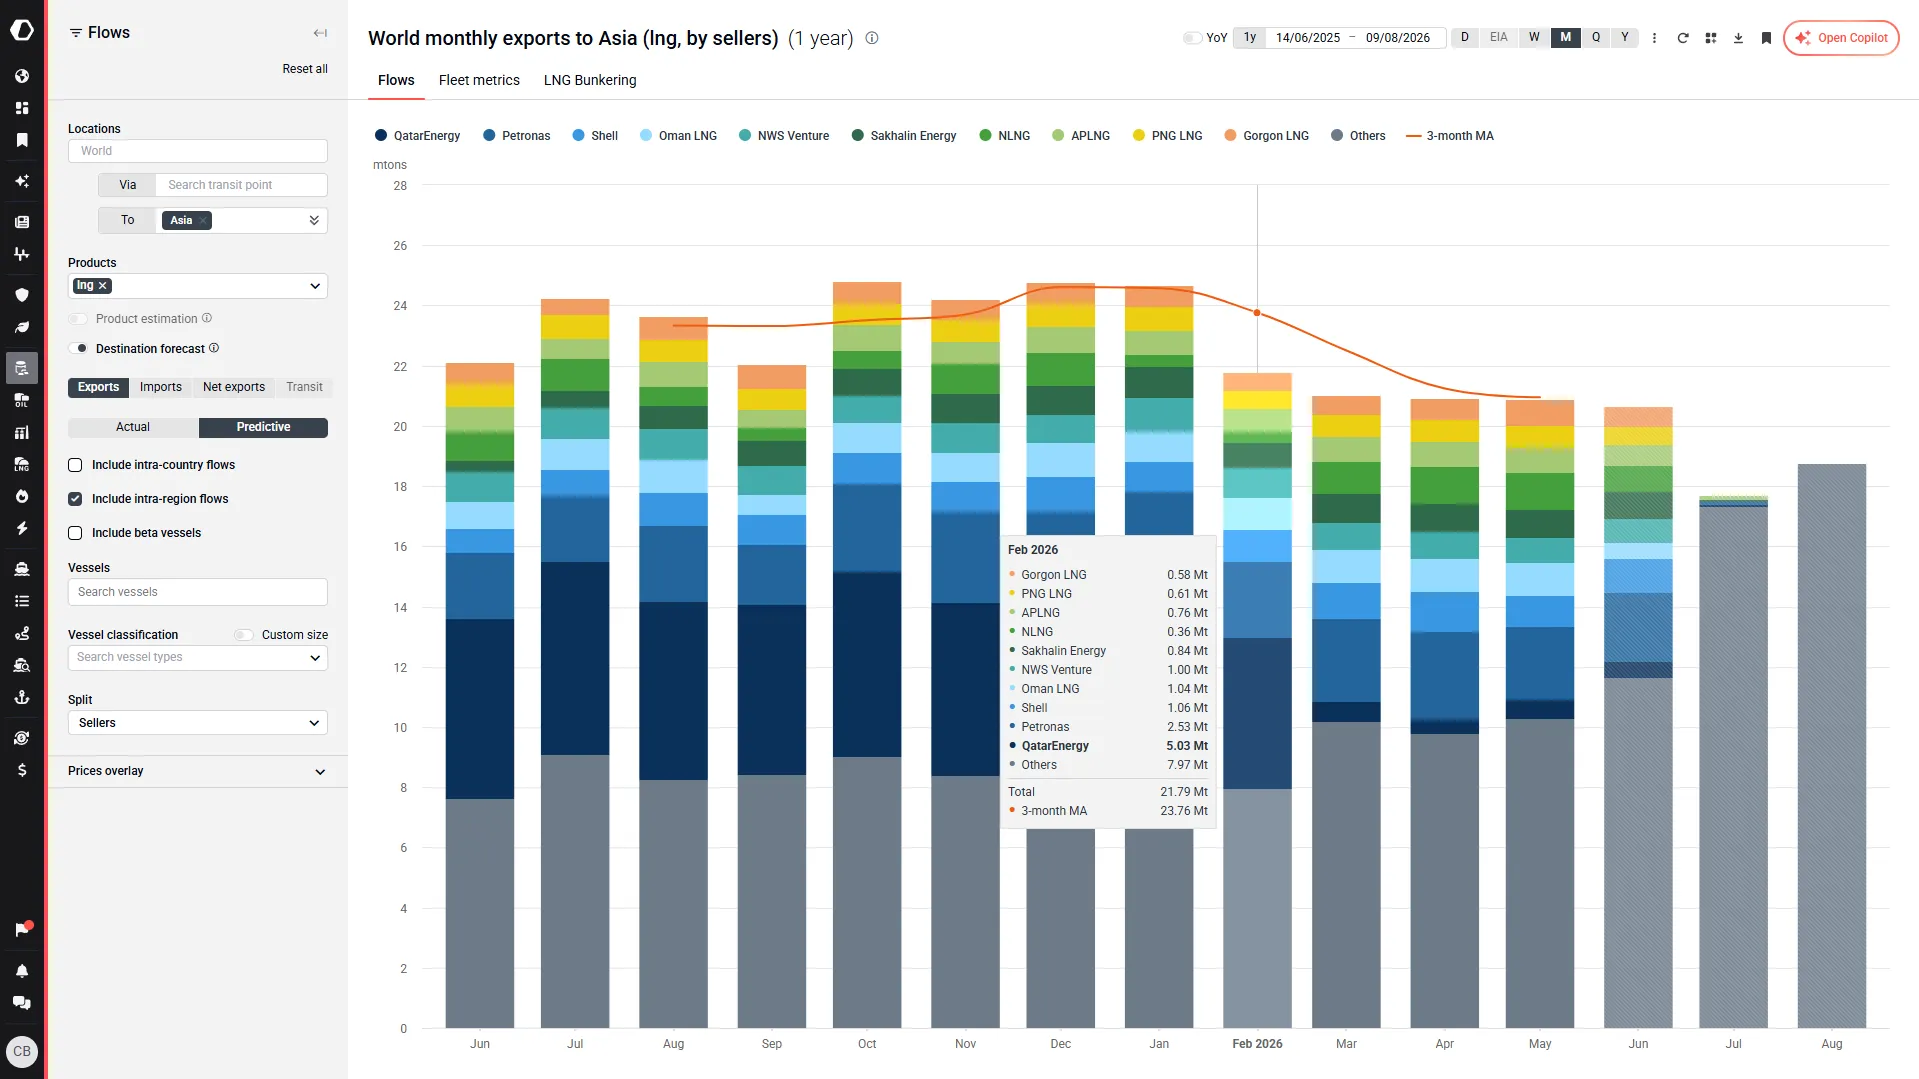
- Insight into the global LNG fleet at any given time, viewing laden, ballast, or vessels at port to understand the evolution of LNG shipping capacity
- See how much cargo has been stuck at anchor and for how long to estimate supply delivery delays
- Floating storage trends offer an indicator of the market’s direction in response to geopolitical or macroeconomic shifts
Request demo

- Daily updates on spot and short-term tender activity — dashboard views of all tenders issued in the last 31 days, with detail on closed date, type, players, locations, status, delivery, and cargo count
- Real-time cargo diversion tracking — vessel details, origin, prior destination, and new destination detected and displayed by Kpler analysts, with dashboard views across the last 31 days
- LNG fixture data from 2008 onwards — vessel name, quantity, charterer, owner, laycan, and fixture rate, filterable by location, vessel class, and fixture status
Request demo


“Best part? Kpler dashboards. I set up my metrics once, and they update in real-time. I can access the latest insights instantly.”
Broadview Capital
Director of Energy Research, Broadview Capital


.jpeg)