Explainer: the nuances of reading Hormuz oil flows data

Hormuz oil numbers vary across sources mainly because definitions do. This explainer sets out the counting lines Kpler publishes, why the newest days revise higher, and how the main official figures map onto tracked data.

Why the numbers may differ

Since the strait was again shut in June and traffic shifted to escorted corridors, estimates have ranged from about 5 to 10 mbd for oil leaving the strait itself, and up to 15 mbd for the region as a whole. Most of that spread comes from three definitional choices: what counts as oil (crude only, or all petroleum liquids), where the counting line sits (the strait itself, the Gulf of Oman, or the wider region including bypass terminals), and when a barrel is dated (at loading, at crossing, or when it surfaces). Kpler defines all three explicitly. Official figures do not publish their definitions, so comparisons between the two are mapping exercises rather than contradictions.

The counting lines Kpler publishes

Kpler measures regional petroleum-liquids exports at three concentric lines, each a confirmed floor built from tracking, imagery, and market and import-side intelligence.

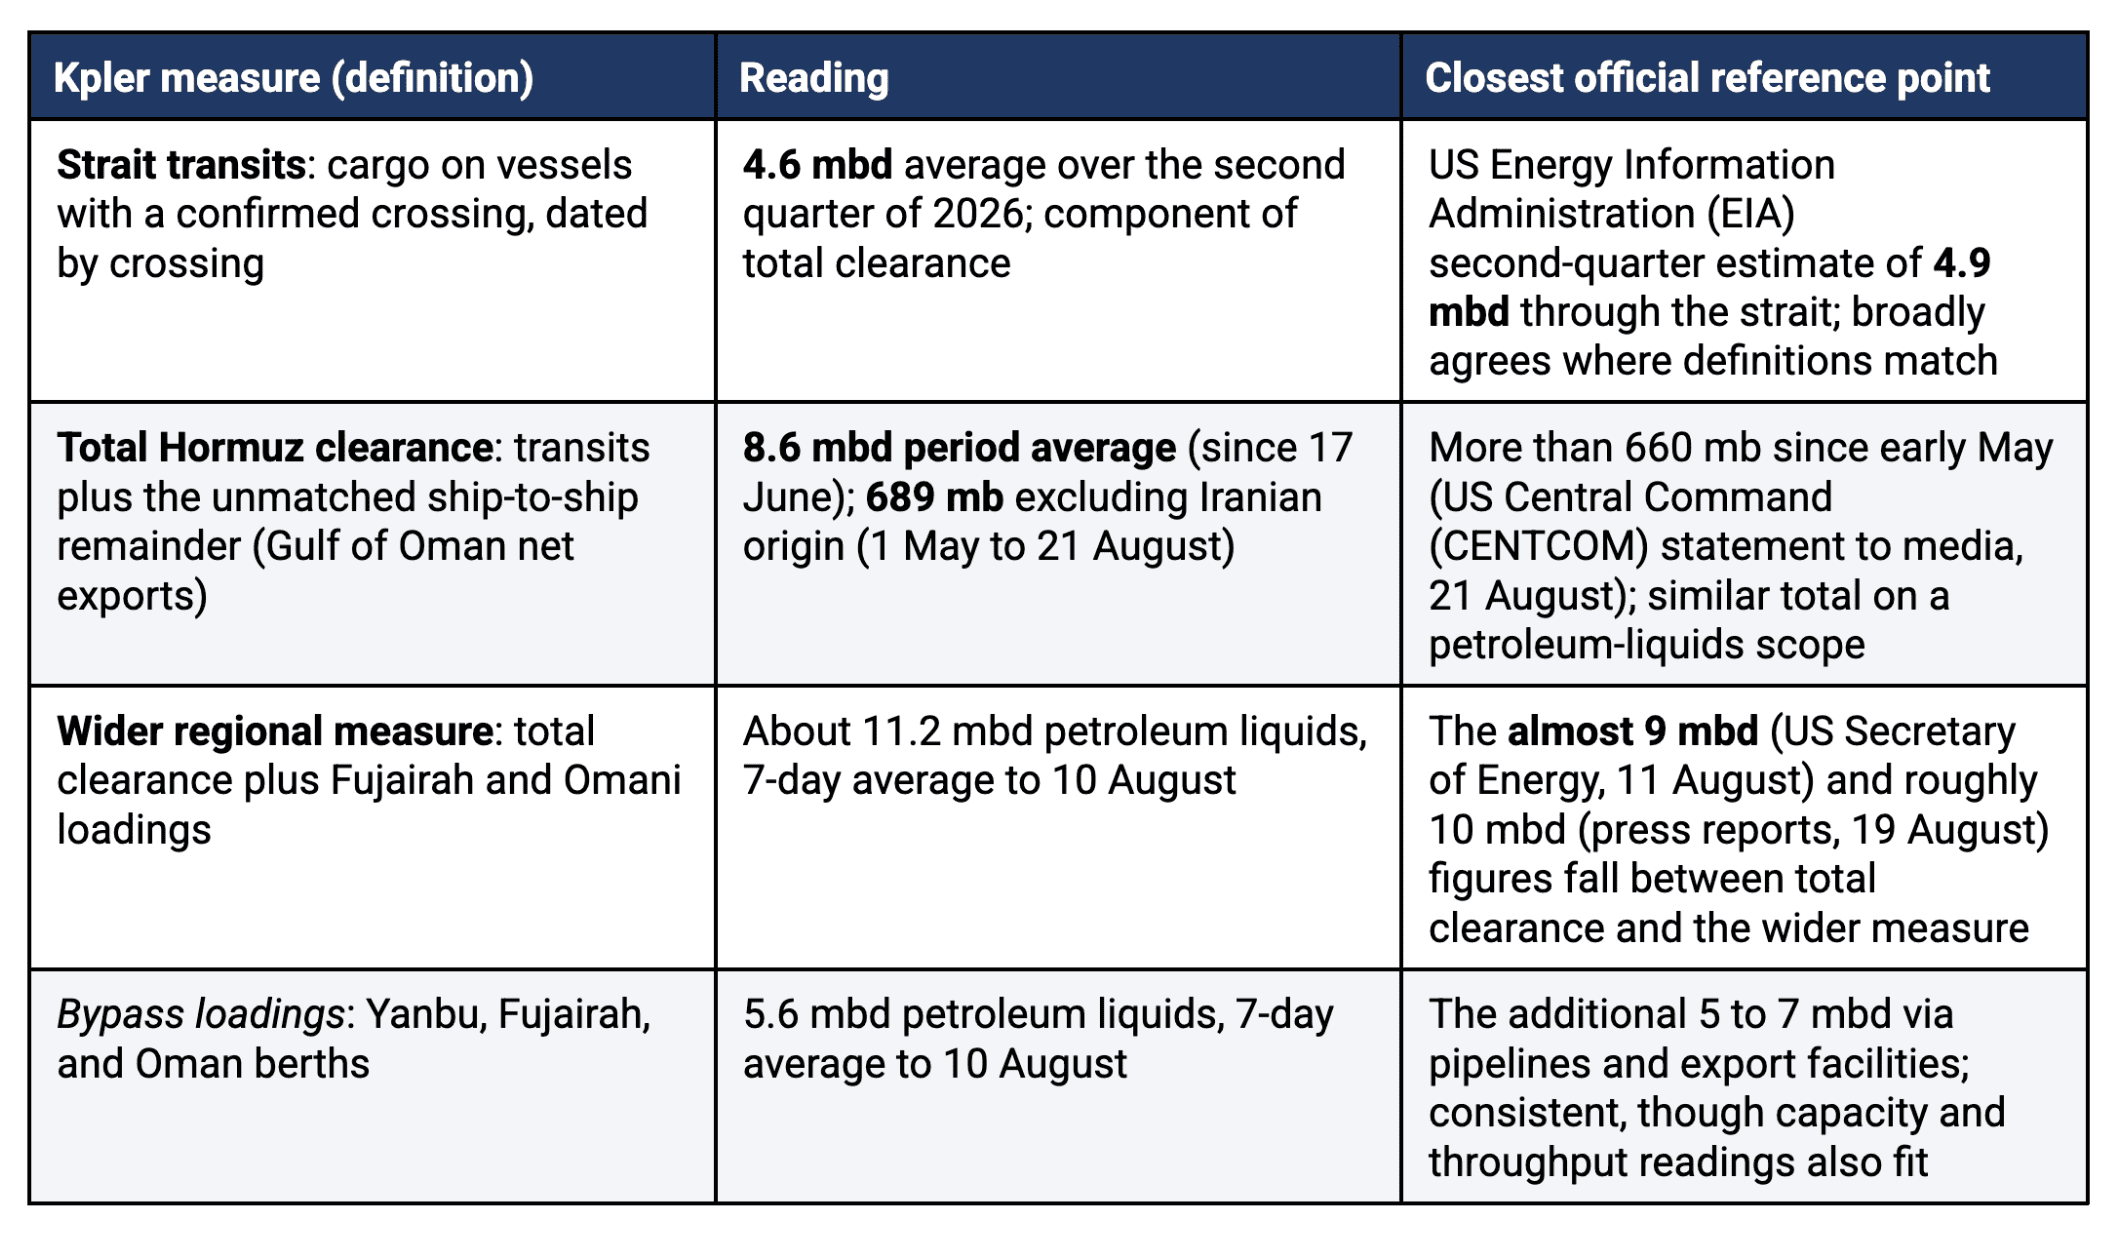
Strait transits: cargo on vessels with a confirmed crossing, dated by crossing.

Total Hormuz clearance: strait transits plus Gulf of Oman net exports, the unmatched remainder of the offshore shuttle system. Cargo whose ship-to-ship chain cannot yet be traced to a load terminal surfaces attached to the Gulf of Oman zone, and the net-exports construction adds exactly that remainder. It has averaged 8.6 mbd since the MoU signing on 17 June.

The wider regional measure: adding Fujairah and Omani terminal loadings to Hormuz clearance, which reach the market without passing the narrows, roughly 2.4 and 1.6 mbd in August.

Separately, Kpler tracks loadings that bypass the strait entirely, at Yanbu, Fujairah, and Oman berths. This bypass data is not a fourth concentric line: its Fujairah and Oman legs are the same loadings already counted in the wider regional measure, so the two series cannot be added.
Screenshot 2026-08-27 at 10.40.52 AM.png

All Kpler figures in the table are petroleum liquids, defined in the source note, and confirmed floors as of 27 August 2026 that revise upward as confirmations land. The rows are alternative counting lines, not additive components: Fujairah and Omani loadings sit inside both the wider regional measure and the bypass loadings row, so rows cannot be summed.
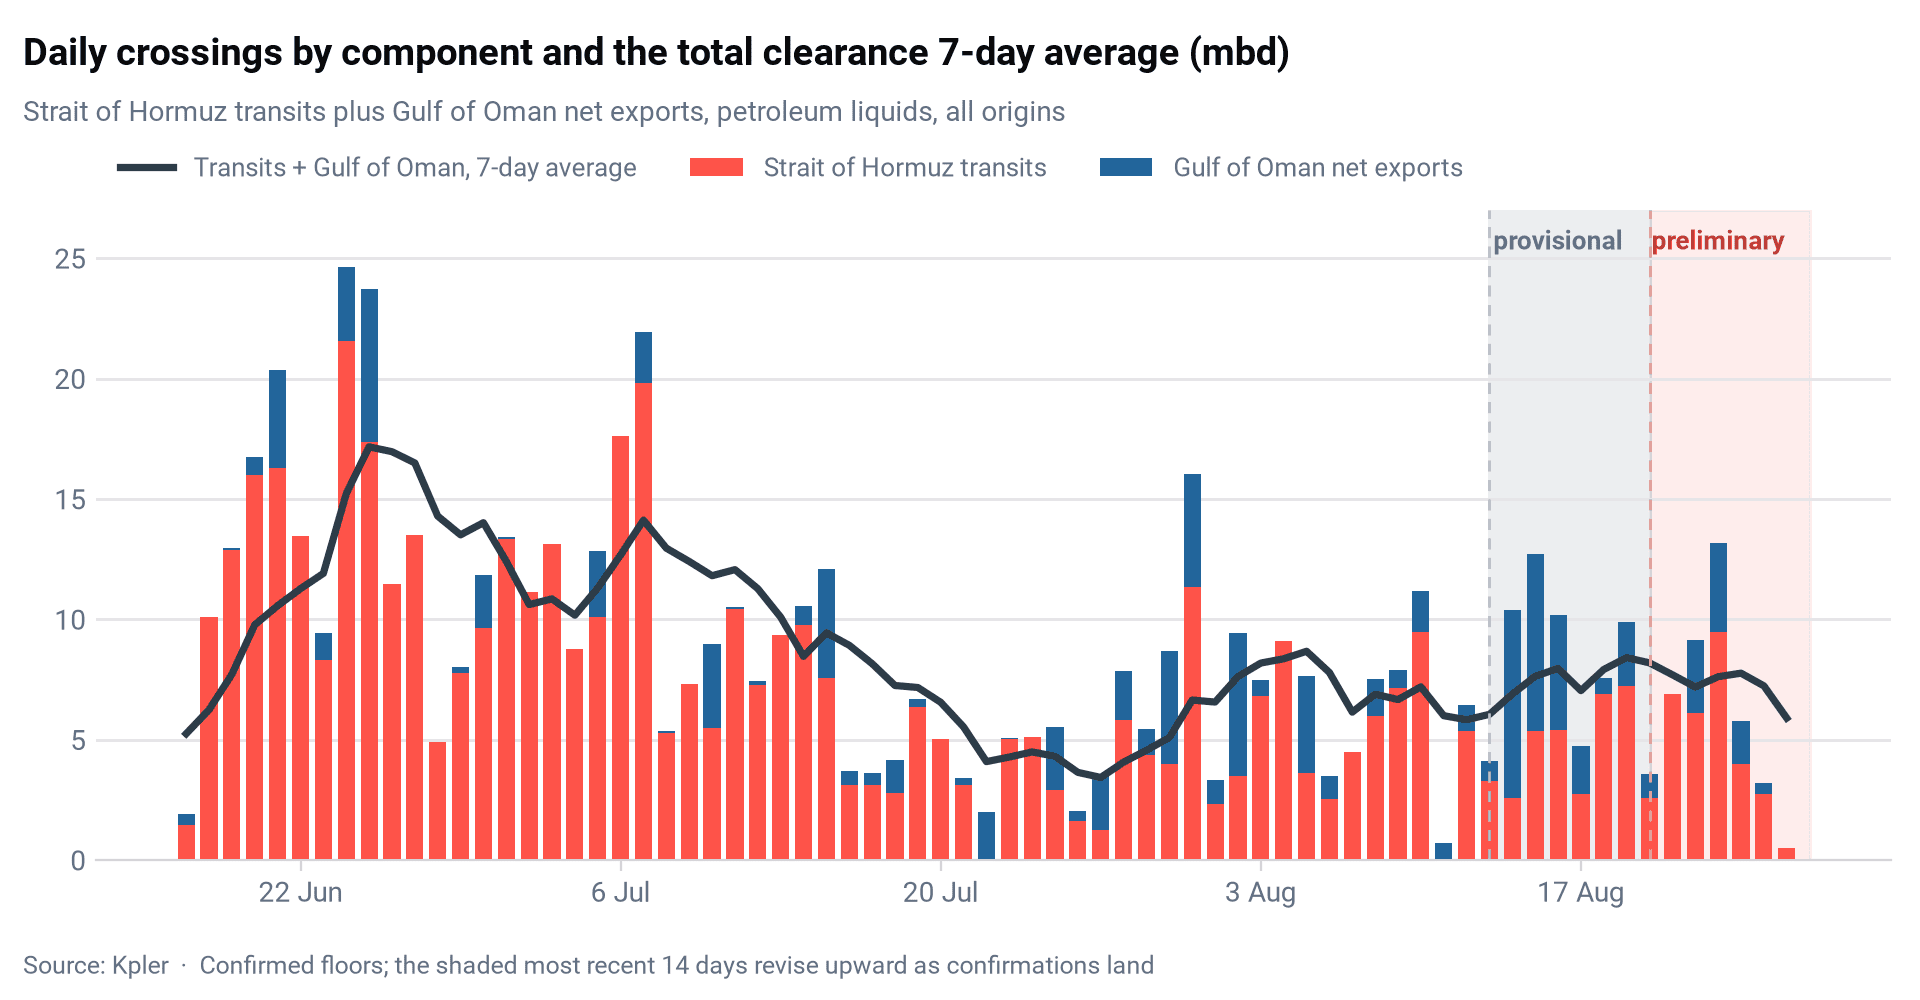
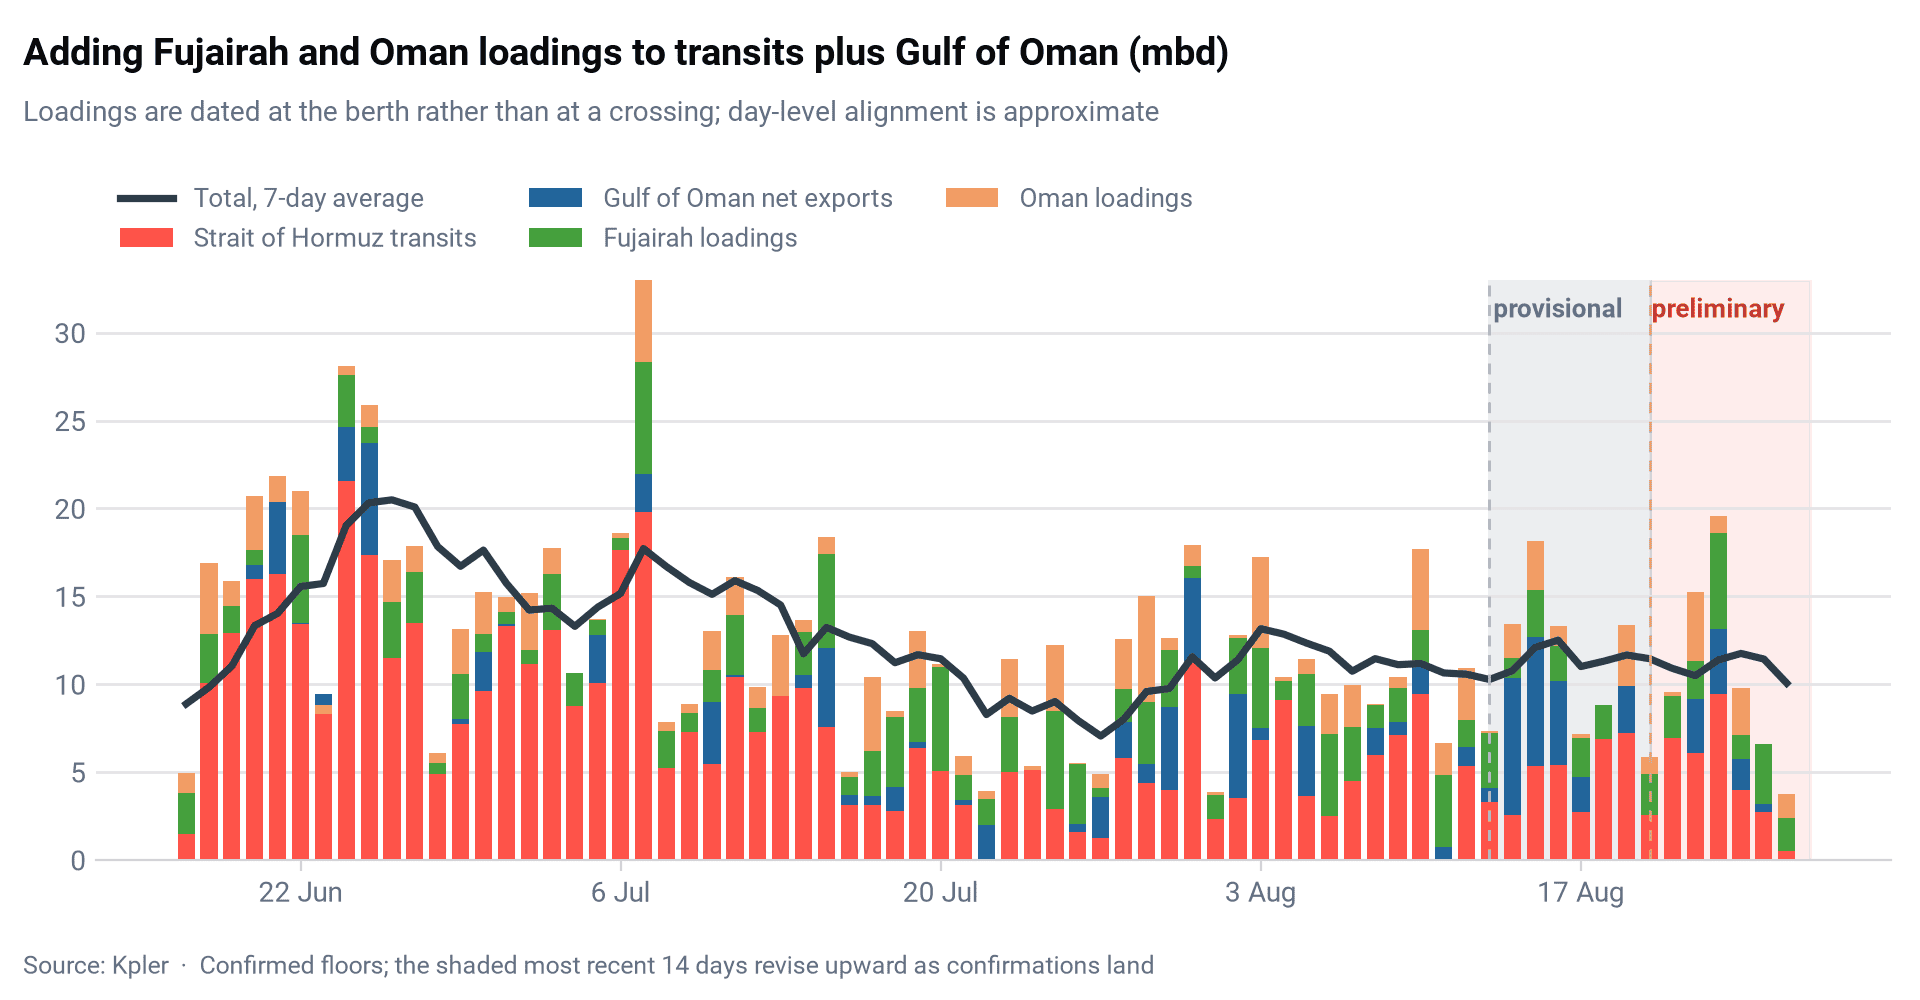
image.png
image.png

One measure, two views

A common pitfall when reproducing these numbers is the exports view. Exports are dated by loading, and a loading only receives a Strait of Hormuz tag once its transit is confirmed, so an exports pull silently drops every recent loading whose crossing is not yet confirmed and understates the strait. Strait of Hormuz transits date cargo by crossing and are the correct basis, on the full petroleum-liquids scope: crude and condensate, refined products, chemicals, and natural gas liquids (LPG, ethane, and pentane). Adding offshore Gulf of Oman net exports, the ship-to-ship cargo with no confirmed load terminal, excluding direct Oman terminal loadings, completes total Hormuz clearance. Net exports are used deliberately. Consider a shuttle tanker that loads at a Gulf terminal, crosses the strait dark, and transfers its cargo to a long-haul vessel in the Gulf of Oman. When both legs are identified, the cargo is a strait transit and is counted there. When the shuttle cannot yet be identified, the cargo first appears in the Gulf of Oman with no origin, and net exports add exactly those barrels; netting off unmatched arrivals stops a barrel being counted twice when only one leg is visible. In a perfectly mapped shuttle system the term would be zero. Its size measures what tracking cannot yet attribute, not a separate flow. The full methodology sits in the help centre, and the adaptation of the export system itself is mapped in the June explainer.

Why the newest days revise higher

Every figure is a confirmed floor. A movement enters the series once independent evidence supports it, an AIS track, a satellite image, a matched transfer, a port or import record, or market intelligence, and nothing is estimated in to fill a gap. That standard costs time. A vessel running dark leaves no live signal, satellite passes capture a given stretch of water only intermittently, and imagery over parts of the region is release-restricted, so confirmation often lands days after the movement itself. That lag is engineered against rather than accepted. The evidence base expands continuously: additional high-resolution optical imagery and synthetic aperture radar, which sees in darkness and through cloud, are being folded in to widen coverage and shorten confirmation times. The same retrospection means the series never reveals where an unreported ship currently is, which protects vessels and crews.

Figures are therefore published in three recency tiers: preliminary (last 7 days), provisional (8 to 14 days), and reported (older). The boundaries are empirical rather than mechanical: most satellite, port, and cargo confirmations arrive within about two weeks of an event, and the newest 7 days are the most incomplete, with published floors typically settling 1.5 to 2 times higher. Revisions concentrate inside these windows but do not stop at them.

Late confirmation does not mean lost barrels. The system is closed at the import side: a cargo that leaves the Gulf unseen must still discharge somewhere, and arrival, port, terminal, and customs intelligence at the destination provides a second chance to identify it. Many dark departures also resolve earlier: some relight AIS en route, at times as far as southern India, and others show through draught changes at the transfer point. When a movement is confirmed late, it is backdated to its likely transit or Gulf of Oman lifting date rather than booked on the day of confirmation, so revisions fill in history where the barrels actually moved instead of spiking the present.

Destination checks are proactive rather than passive. At import ports Kpler reads vessel lineups, port schedules, and terminal intake alongside AIS, so a discharge does not need a clean AIS trail to be caught. In the nearest plausible markets, India and Pakistan, those checks have surfaced no discharge that tracking had missed. Cargo travelling further, to East or Southeast Asia, would have to run AIS for the long transit and would meet the same lineup and import checks on arrival; vessels that sail with AIS gaps are flagged and followed until the gap resolves. Whatever leaves the Gulf must eventually appear at a destination, and the destinations are watched. Movements that official channels have verified through their own sources may simply still be waiting on evidence here, which is why recent figures are floors still filling in rather than settled values.

image.png

How the barrels are dated

Kpler dates each component by its own observable event: strait transits by crossing date, estimated where the crossing ran dark; Gulf of Oman net exports by the date cargo surfaces or departs, likewise approximate for dark transfers; and Fujairah and Omani volumes by loading date. Daily totals therefore mix event timings. Seven-day averages absorb most day-level offsets, but short-window comparisons between tracked and official figures inherit this imprecision, and the dating convention behind the official counts has not been published.

How official figures map onto tracked data

The cumulative figures align once the product basis is broad. Excluding 93 mb of Iranian-origin transits as an analytical assumption, to approximate traffic eligible for US-facilitated passage under the blockade, total clearance reaches 689 mb from 1 May to 21 August, close to the more than 660 mb stated by CENTCOM. A crude-only construction reaches 532 mb, around 20% below the stated floor on any start date from 1 to 10 May, which makes commodity scope the first definitional choice to check.

The current-rate figures fall inside the range that different counting lines produce. The almost 9 mbd 7-day average posted by the US Secretary of Energy on 11 August sits between total clearance, 7.2 mbd on a 7-day average to 10 August, the last full day before the post, and the wider regional measure, about 11.2 mbd; the roughly 10 mbd corridor figure attributed to US officials in press reporting on 19 August sits in the same bracket. The spread reflects definitions, not missing barrels. The Secretary's additional 5 to 7 mbd via pipelines and export facilities is consistent with several readings at once: the East-West Pipeline's capacity alone, total bypass pipeline throughput, and Kpler-tracked bypass loadings, which sum to 5.6 mbd on the same 10 August basis. Because all three constructions land inside the stated range, the agreement cannot identify which was meant. Where the EIA, the statutorily independent statistical agency within the same Department of Energy, defines both commodity and chokepoint, its second-quarter estimate of 4.9 mbd sits close to the matching Kpler construction, which averaged 4.6 mbd over the same quarter.

Caveats

All figures are confirmed floors and remain subject to upward revision at any horizon. Official statements are quoted from public reporting. Kpler figures are as of 27 August 2026.

Source: Kpler. Petroleum liquids covers crude and condensate, refined products, chemicals, and natural gas liquids (LPG, ethane, and pentane). Marginal ammonia and olefin cargoes, strictly chemicals rather than petroleum liquids and about 0.2% of the total, travel in the same product selection and are retained so the linked Terminal views reproduce these figures exactly; LNG is excluded. Offshore Gulf of Oman net exports exclude Oman terminal loadings.

Cargo ship docked at industrial port with red-covered containers and red ore piles, city skyline in the background.

See why the most successful traders and shipping experts use Kpler

Request a demo



