How Kpler helps navigate the fertilizer market
Since the conflict in the Middle East began in March, sulphur and urea trade flows have been heavily disrupted. Roughly half of seaborne sulphur cargo originates from the Middle East, which means that the recent disruptions have had major impacts on the overall market. Kpler can help market professionals navigate this highly volatile time in the market with accurate, real time tradeflow data. Let’s take a look at how Kpler’s products are able to help surface important fundamental insights to give fertilizer traders and market participants an edge in decision making.
First we can take a look at the seasonal picture of sulphur flows with Kpler’s historical data, which goes back to 2019. Taking a look at the picture below, we see that the levels of sulphur flows being exported from the Middle East (in dark blue) on any given month can equate to roughly half of the total flow.
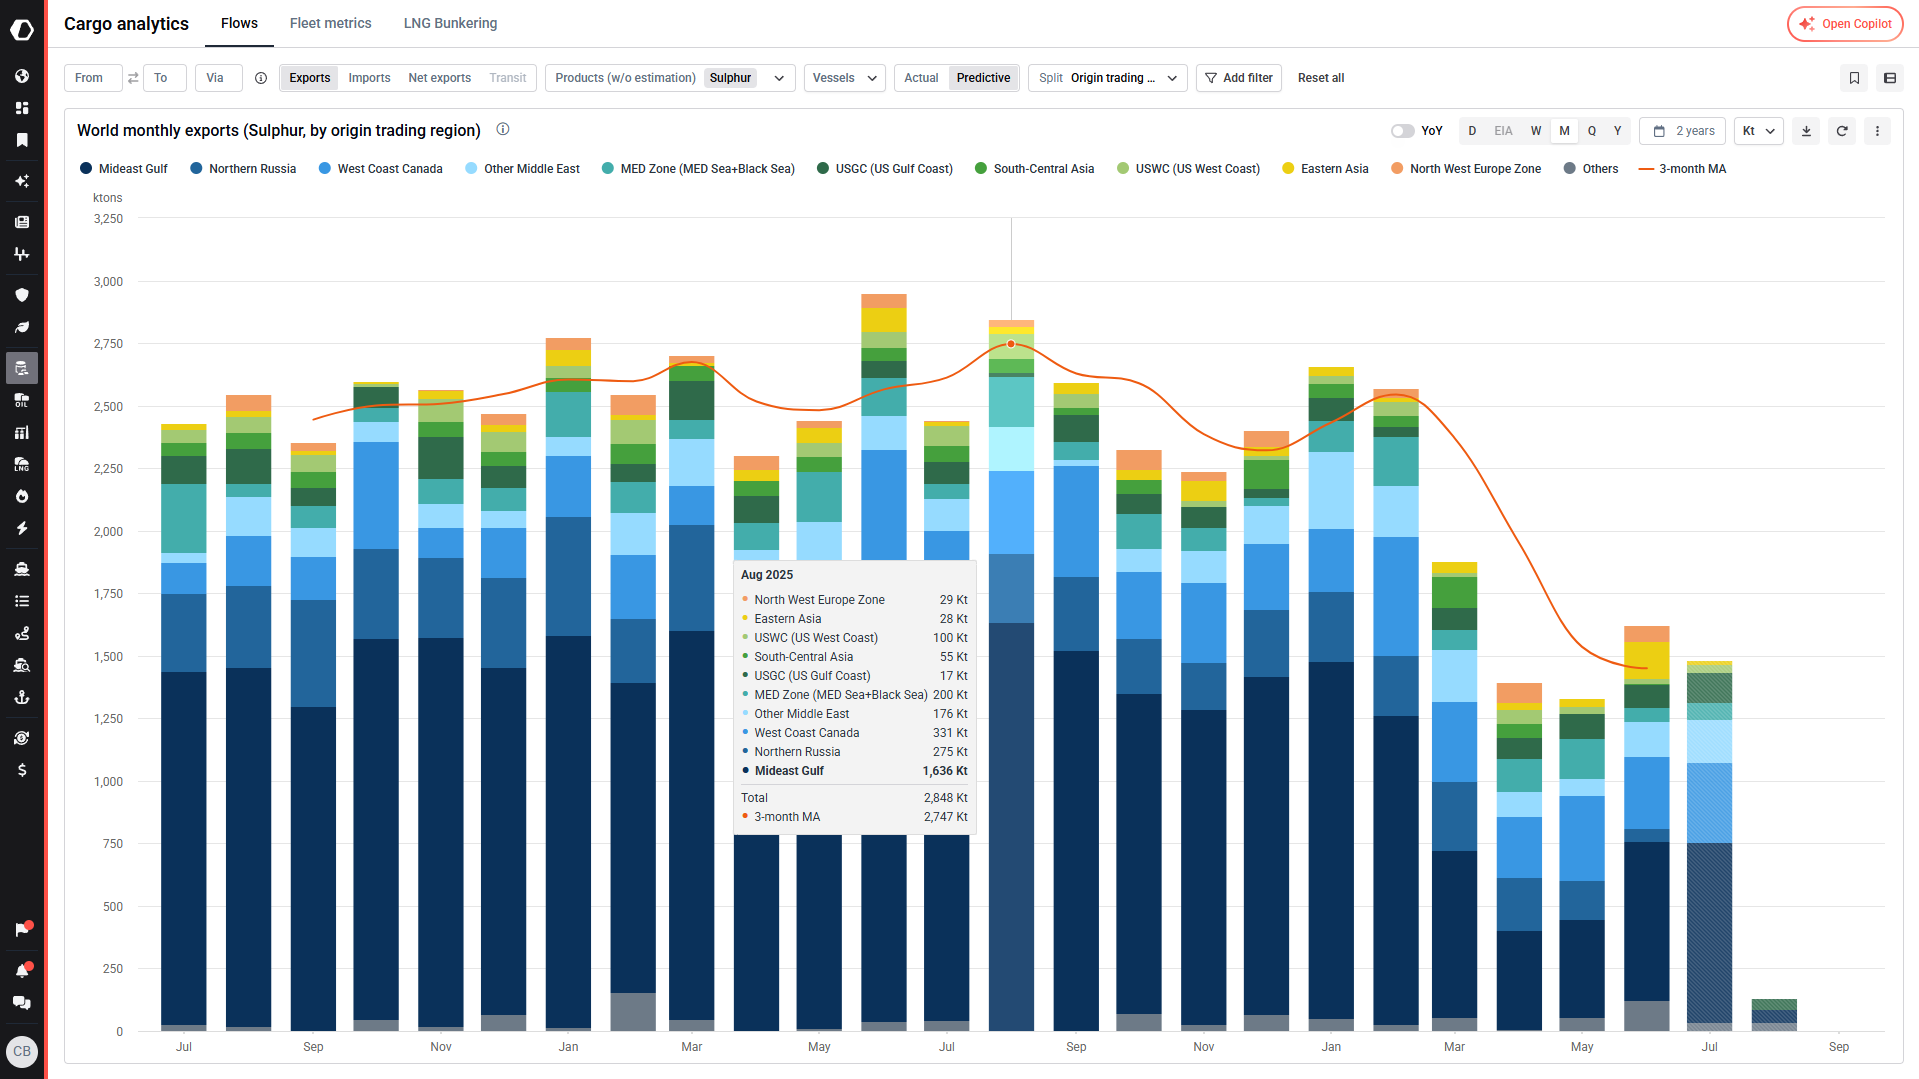
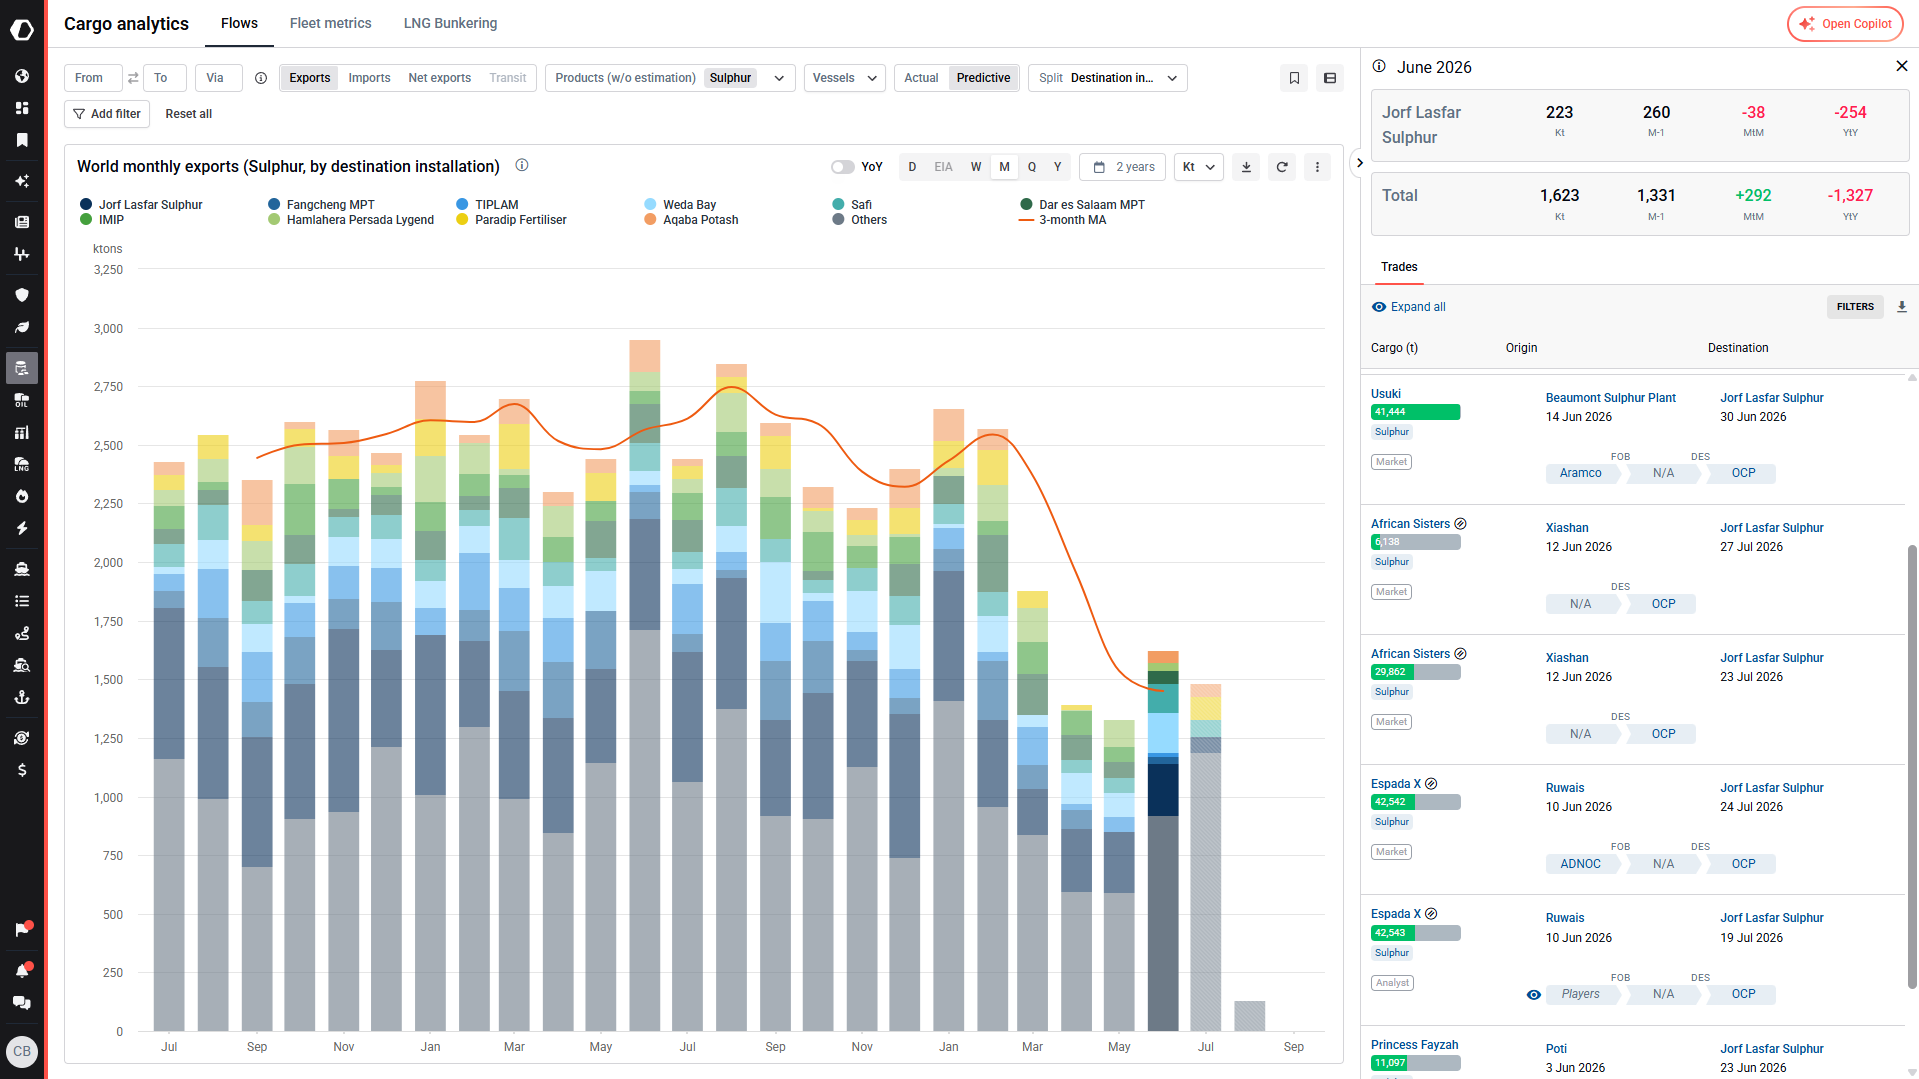
Specifically, Kpler can identify that sulphur loadings recorded from the Middle East Gulf averaged around 1,170 kt/month in 2025, peaking at 1,636 kt in August 2025. In the beginning of the conflict, export levels from the Middle East Gulf fell to 668kt in March and bottomed out at 392kt in May. This dramatic shift in flow levels has had consequences for importers, most of which are in Asia and Africa. Kpler enables users to define precise filters for destinations, going down to the installation level. This clarity helps market professionals connect important associated details such as ownership of terminals combined with flows that can provide a clearer picture of which entities are importing what products. In the image below we can see affected destinations such as Jorf Lasar in Morocco and specifically which trades are composing the total volume of imports at that location.
Kpler also enables users to see cargo flows through specific transit points, such as the Strait of Hormuz. In scenarios like the current situation in the Middle East, Kpler’s team provides an extra layer of certainty for its clients. All Strait of Hormuz crossings are analyst verified wherein the team uses intelligence such as satellite imagery and their decades of experience to identify when ships have used deceptive techniques and only populate accurate data. We can see in the image below that the situation regarding flows through the Strait of Hormuz have dropped drastically in comparison to pre-conflict levels.
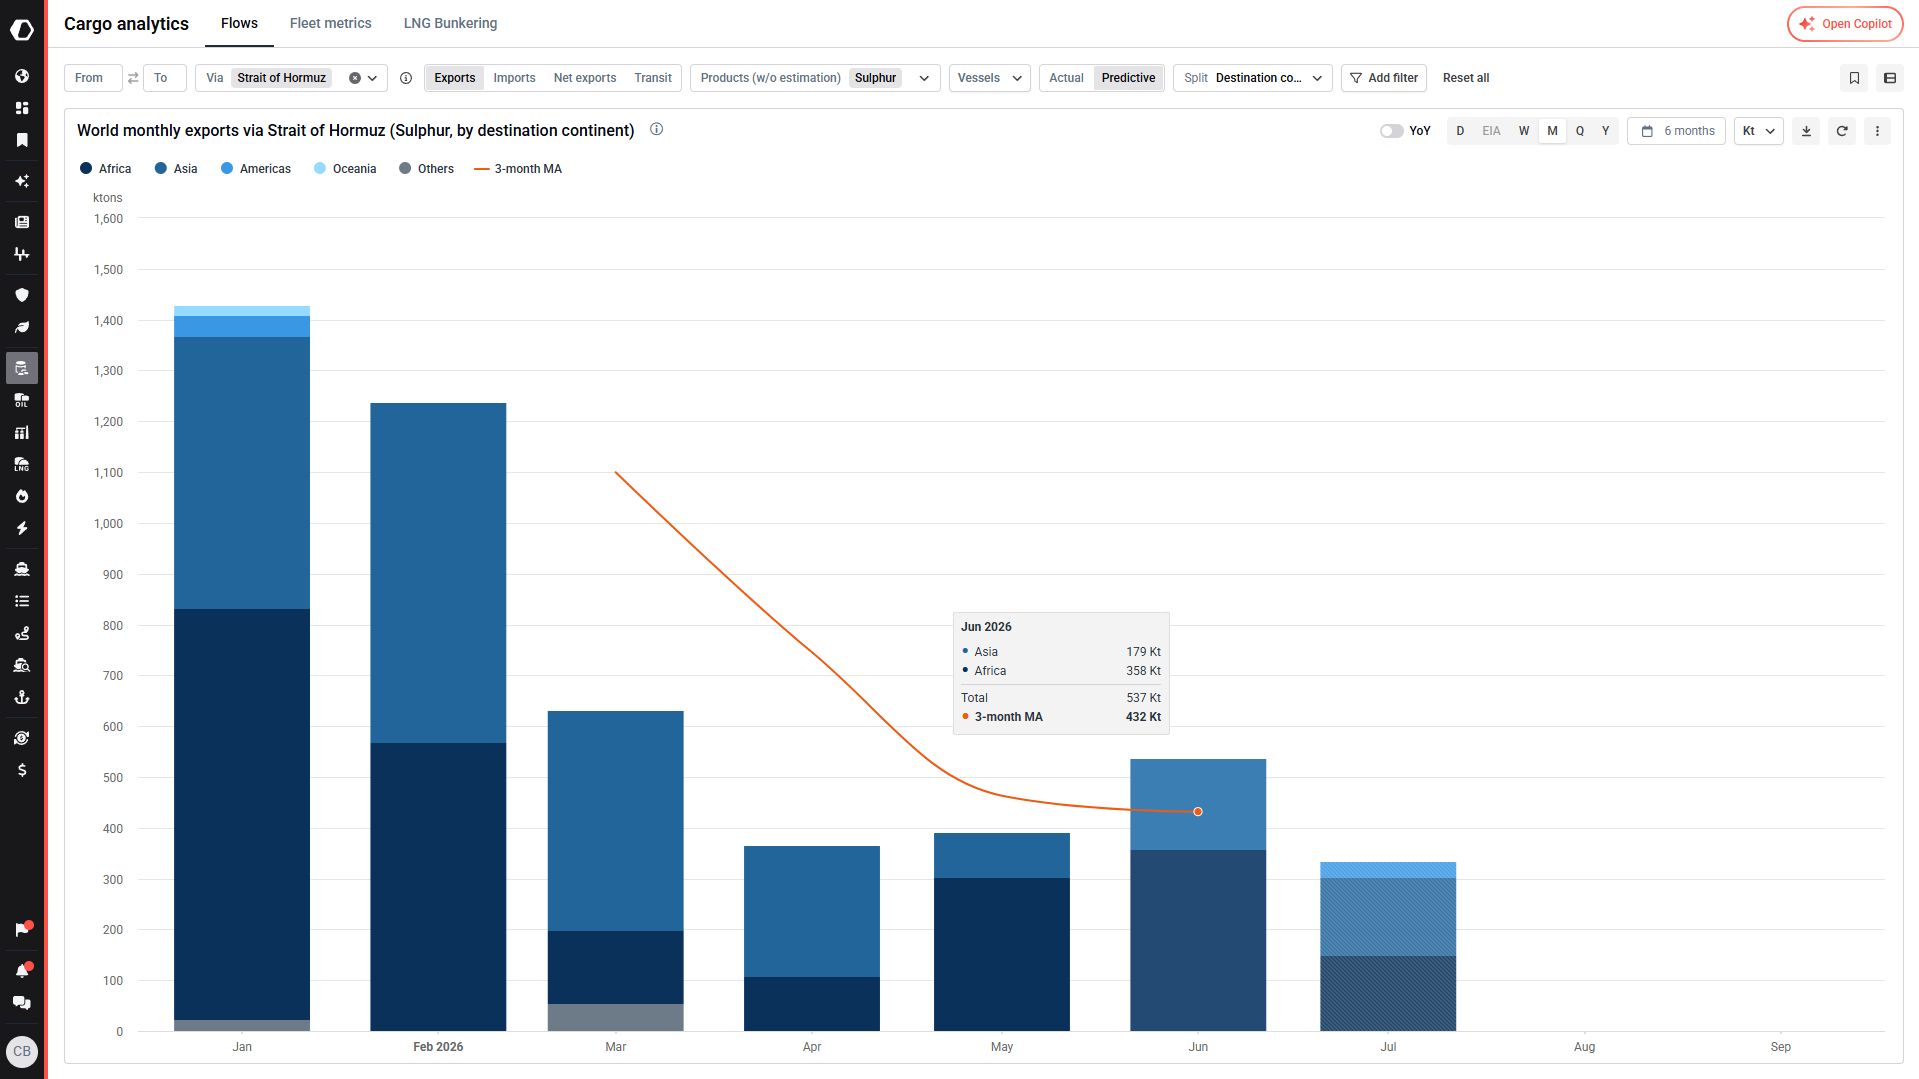
However, one can also see that exports have risen steadily since the lows and appear to be rebounding slightly. This will be a critical trend to observe moving forward given how large of a share exports from the Middle East have typically occupied.
Kpler can help fertilizer market professionals navigate the supply situation with real time data from across the globe. With bans on sulphur exports from many countries, such as Russia, Kazakhstan and Turkey the supply picture grows tighter. China, the largest exporter of sulphuric acid, has banned exports of sulphuric acid - which can be observed through Kpler data as well. The image below depicts the last two years of sulphur and sulphuric acid exports from China. The dark blue represents the sulphuric acid. For the month of May 2026, there were 0 observed exports of sulphuric acid as can be seen highlighted in the text.
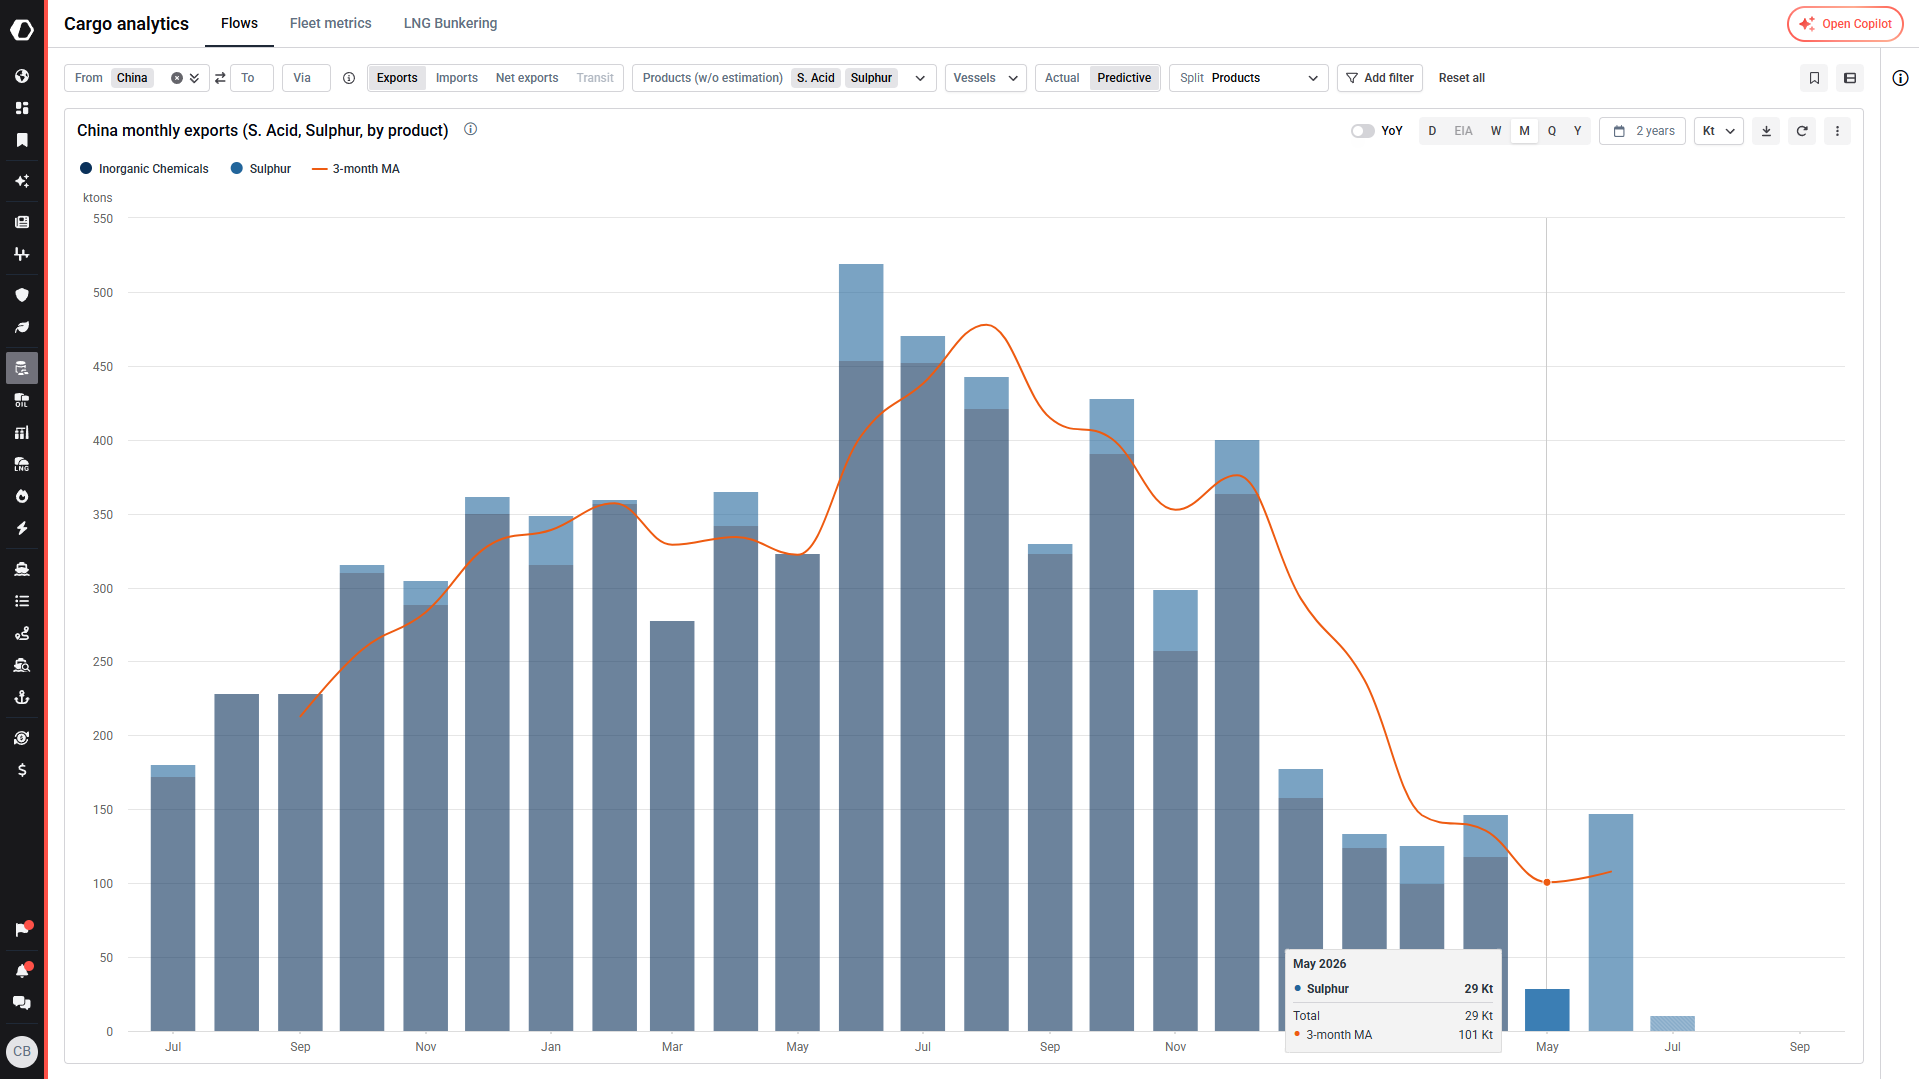
This trend appears to continue for June where only sulphur is exported and no sulphuric acid has been exported. In July a very small volume, 11kt, of sulphur can be observed exporting from China. This is a dramatic shift from the previous flow pattern and will undoubtedly have an impact on prices as we move forward in the year.
Kpler is able to help fertilizer market professionals in these volatile times where traditional flow patterns are shifting rapidly. With real-time, highly accurate flow data down to the grade level, Kpler is able to provide critical insight into where the market is moving. This transparency translates into maximal returns and reduced risk.
If you are interested in gaining access to Kpler’s data and research, please reach out by clicking the button below.

See why the most successful traders and shipping experts use Kpler