


The hidden layer of commodity markets: Understanding systematic CTA flows
Commodity markets don't move on fundamentals alone.
Supply disruptions, macroeconomic developments, and geopolitical events often provide the initial direction, but they don't always determine how far a market price ultimately travels.
Every futures trader has experienced markets that continue moving long after the original catalyst has faded. What often appears to be unexplained momentum can instead reflect large pools of systematic capital entering or exiting positions at predefined price levels. These participants don't react to headlines—they react to price.
Understanding these systematic flows provides an additional layer of context for interpreting price action, managing risk, and identifying where price moves may continue or begin to fade.
Fundamentals start moves. Systematic flows often influence how far they go.
Commodity Trading Advisors (CTAs) are professional money managers that trade primarily in futures markets. An important segment of the industry consists of systematic CTAs, which use quantitative models to make trading decisions. Rather than responding directly to headlines or fundamental developments, these strategies react to changes in market price, trend, and volatility.
What makes systematic CTAs influential isn't simply the amount of capital they manage. It's that many employ similar trend-following and risk management principles. As trends strengthen, these strategies tend to build positions incrementally. As trends weaken or predefined risk thresholds are breached, they reduce or reverse exposure in much the same way. This synchronized and persistent behavior can reinforce existing market moves, creating price trends that extend well beyond the original catalyst.
For traders, understanding these systematic flows isn't about replacing fundamental analysis. It's about adding another layer of market intelligence.
Knowing how systematic participants are positioned can help answer practical questions throughout the trading lifecycle:
- Trade timing: Has the bulk of systematic buying or selling already occurred, or could additional CTA participation extend the move?
- Risk management: Are key execution levels nearby that could trigger a wave of mechanical buying or selling and increase volatility?
- Position sizing: Is your fundamental view aligned with systematic positioning, or are you trading against the prevailing flow?
Fundamental analysis explains why a market is moving. Understanding systematic positioning provides additional context around how that move may evolve, whether momentum is likely to persist, and where liquidity or volatility may emerge.
From hidden flows to actionable insight
Knowing that systematic flows can influence price action is useful. Seeing those flows before they reach the market is much more powerful.
Historically, tracking these flows has been difficult. Market participants have largely had to rely on delayed positioning datasets or infer systematic participation from price action after the fact. Neither provides a clear view of how systematic strategies may respond as prices move.
Kpler Financial Flows is designed to close that gap.
Rather than reconstructing positioning after trades have occurred, Financial Flows models the systematic strategies themselves. It provides a real-time view of estimated CTA positioning, execution levels, and potential future order flow, helping traders understand not only where systematic strategies are positioned today, but how that positioning may change as prices move.
Because systematic CTAs respond to price, modeling their behavior can provide insight into where buying or selling may emerge next. Traders can identify price levels where systematic strategies may add to positions, reduce exposure, or reverse direction, providing another lens for assessing whether an existing move could accelerate, lose momentum, or encounter additional volatility.
The result is a forward-looking view of systematic participation that complements fundamental analysis: not simply what systematic capital has already done, but how it may respond to the market's next move.
Validated against real CTA performance
Modeling systematic strategies is only valuable if those models accurately reflect the behavior of institutional managers.
That's why validation sits at the core of Kpler’s Financial Flows. Financial Flows is continuously validated against major CTA benchmarks, public positioning data, and observed market activity to ensure the modeled portfolios closely replicate real systematic behavior.
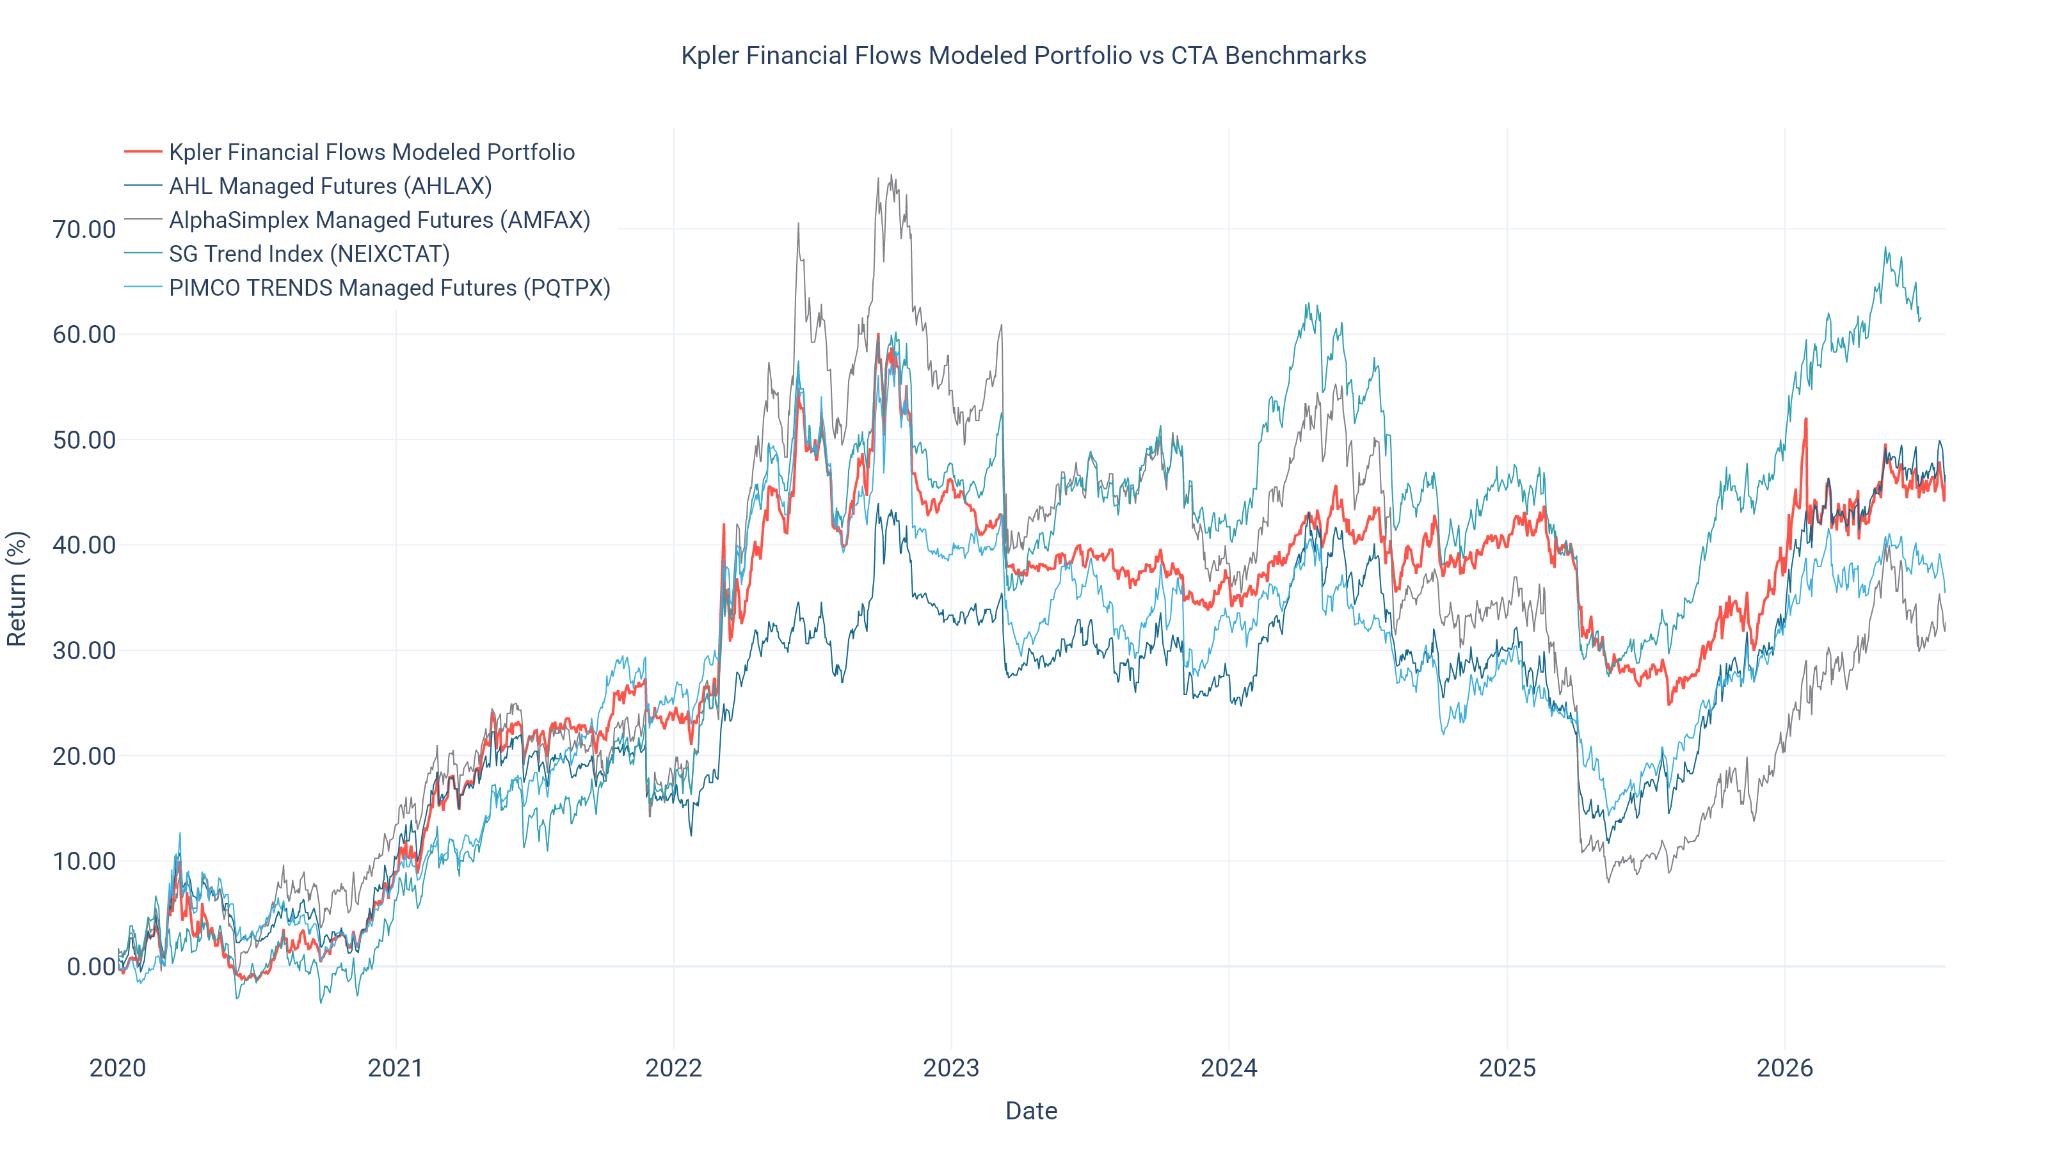
Over the past quarter, the Financial Flows modelled CTA portfolio achieved a 0.901 correlation to major CTA benchmarks, while maintaining an approximately 0.89 correlation over the full historical sample. These results provide confidence that the framework is capturing real systematic positioning rather than simply fitting historical price movements.
The full validation framework is available in our Financial Flows Methodology paper for readers interested in the research behind the models.
A more complete view of commodity markets
Commodity markets have always been shaped by fundamentals. But understanding the fundamental catalyst alone doesn't always explain how far a move may travel or what happens as prices approach levels that matter to systematic participants.
That is where the two perspectives come together.
Fundamental analysis provides context for why a market is moving. Systematic positioning provides another lens on how that move may evolve, where mechanical buying or selling could emerge, and whether systematic capital is likely to reinforce or work against the prevailing move.
For traders navigating increasingly complex commodity markets, seeing both sides provides a more complete picture of the forces shaping price.
If you'd like a copy of the methodology paper, or to see Financial Flows coverage across the markets you trade, you can request a demo here.

See why the most successful traders and shipping experts use Kpler






