
The May-July soybean spread offers a measured way to trade tighter US stocks
Kpler's supply and demand analysis suggests US soybean ending stocks should be much lower than USDA's 8.6 Mt (315 mbu). The May-July spread which is currently 7¢ in carry offers a good opportunity to express the tighter fundamental view.
US 2026/27 ending stocks estimate suggests an inverse
May 2027 soybean futures traded 7 ¢/bu under the July 2027 contract on 21 October. Full carry is approximately 15 ¢/bu/month, made up of about 8 ¢/bu of storage and 7 ¢/bu of interest. The spread is therefore at about a fifth of full carry. The market rarely approaches the limit, and the widest carry in the past nine years was 21 ¢/bu in 2024. While the downside is modest, the upside is open once the spread inverts.
Brazilian and Argentine harvests from early 2027 support carry through to March and May respectively. After that, little new supply reaches the market, and US old-crop stocks set the price of the spread. Kpler has US 2026/27 ending stocks at 4.2 Mt, well below USDA at 8.6 Mt. We expect May-July to move into inverse as US stocks tighten.
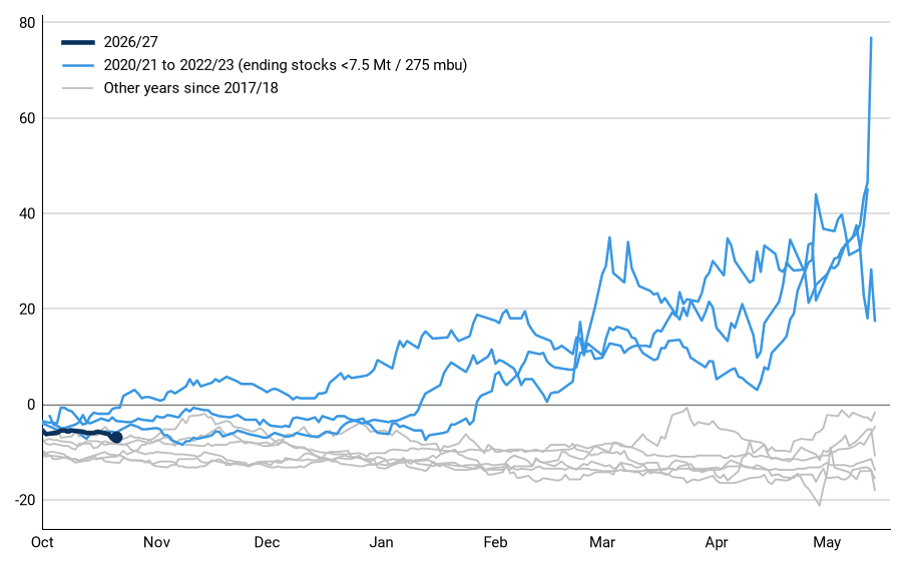
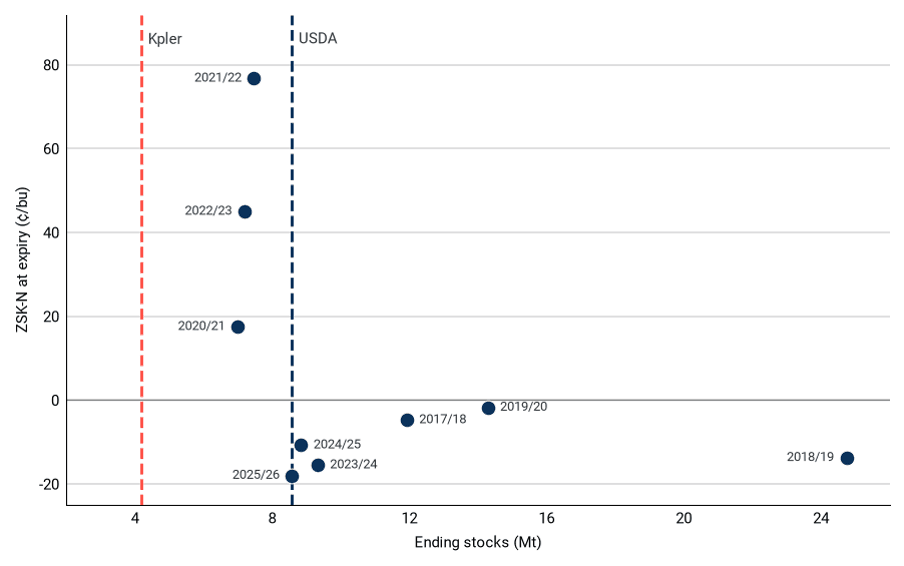
US final ending stocks were in the 7.0–7.5 Mt range in 2020/21, 2021/22, and 2022/23. In those three years the May-July spread finished at an inverse of 17.5 ¢/bu, 76.8 ¢/bu, and 45.0 ¢/bu. In 2021/22 and 2022/23 it crossed into inverse in mid-to-late January, and in 2020/21 it was already inverted in November.
On the contrary, years with final stocks of 8.5 Mt or more finished at a carry of 2–18 ¢/bu. A modest reduction to USDA's forecast would place it within the group that inverted, and Kpler's 4.2 Mt is well in inverted territory.
Tight-stock years pushed May-July into inverse by late January (¢/bu)
Source: Barchart
Ending stocks near 7 Mt led to an inverse (¢/bu at expiry)
Source: Barchart, USDA, Kpler Insight
Exports are hard to cut with China at 25 Mt and non-China sales near their normal pace
Kpler's export estimate of 50.4 Mt is higher than USDA's 46.1 Mt, while production and domestic use differ by less than 0.5 Mt. China has committed to buy 25 Mt of US soybeans in 2026/27. Export sales show 11.3 Mt of 2026/27 commitments to China at 8 October, about 45% of the 25 Mt, against none a year earlier.
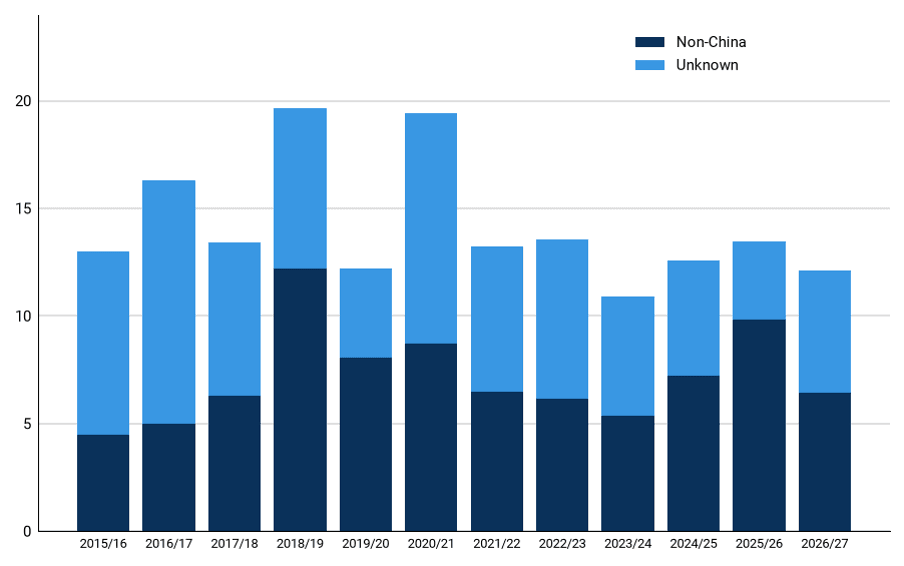
That leaves non-China destinations to take 25.4 Mt on Kpler's numbers, in line with the 24.8 Mt 5-year average. The implied USDA estimate is 21.1 Mt, near the 2022/23 and 2023/24 lows. Non-China sales on the books at 8 October were 6.5 Mt, close to the 6.8 Mt average for the week in the five seasons before last year. Last year is excluded because China's absence pushed purchases by other buyers unusually high.
Reaching USDA's level would need non-China buying to fall to its weakest since 2023/24. That requires pricing US soybeans out of competition, so prices would have to rise until US offers are no longer competitive with Brazil's. Rationing demand on that scale points to higher nearby prices, which is the move the spread is positioned for.
US soybean export sales excluding China by 8 October are close to average pace (Mt)
Source: USDA
US Gulf offers for November shipment are about $7/t below Brazil and within $4/t of it for December and January, which is still priced to compete. The discount has narrowed from $13/t in August as futures rose, but US offers remain broadly in line with Brazil's, so non-China buyers have had little incentive to switch origin.
Brazil's record crop is not yet in the bag, and El Niño raises the risk
USDA estimates Brazil's 2026/27 soybean production at a record 186 Mt, while Kpler's model estimate is lower at 177 Mt. Planting is under way, and the final crop will be shaped by weather in December and January. NOAA's Climate Prediction Center expects a strong to very strong El Niño to last through January–March 2027, and El Niño can leave parts of Brazil drier than usual. Production problems are more likely than in non-El Niño years.
In the previous El Niño in 2023/24, USDA opened its 2023/24 Brazil forecast at 163 Mt in May 2023 but had to eventually cut it to 153 Mt by June 2024. A smaller Brazilian crop would add to the pull on US exports and provide bullish impetus to both price and spreads.
Modest risk and open upside are attractive, but it could take time to play out
The widest carry in the past nine years was 21 ¢/bu, which would put the risk near 15 ¢/bu from today's level. In recent tight years, the May-July spread has even closed at above 70 ¢/bu.
The move may take time to develop. In 2021/22 and 2022/23 the spread crossed into inverse in mid-to-late January, and the South American harvest can keep a carry in place through March. USDA's weekly export sales, especially to non-China destinations, and South American growing season weather over the next three months will be key watchpoints.
Market Insights you can trust
Kpler delivers unbiased, expert-driven intelligence that helps you stay ahead of supply, demand, and market shifts.
Trade smarter. Request access to Kpler today.

See why the most successful traders and shipping experts use Kpler