
UK carbon (UKA) max exposure study
Traditional systematic trend following strategies progressively build exposure as a trend develops, adding length as prices move higher or short exposure as prices move lower. Once maximum deployment is reached, the strategy is fully positioned and the focus shifts to managing the trade through its stop logic.
Systematic trend performance at max exposure
Historically, both maximum long and short exposures in UKA have generated negative cumulative P&L, with short positioning significantly underperforming:
- 100% long: −1% cumulative P&L
- 100% short: −26% cumulative P&L
Performance has shifted notably since September 2023, with maximum long exposure becoming profitable while short exposure has underperformed:
- Before Sep 2023:
- 100% long: −19% cumulative P&L
- 100% short: 0% cumulative P&L
- Since Sep 2023:
- 100% long: +18% cumulative P&L
- 100% short: −26% cumulative P&L
Cumulative P&L at maximum exposure: long vs. short
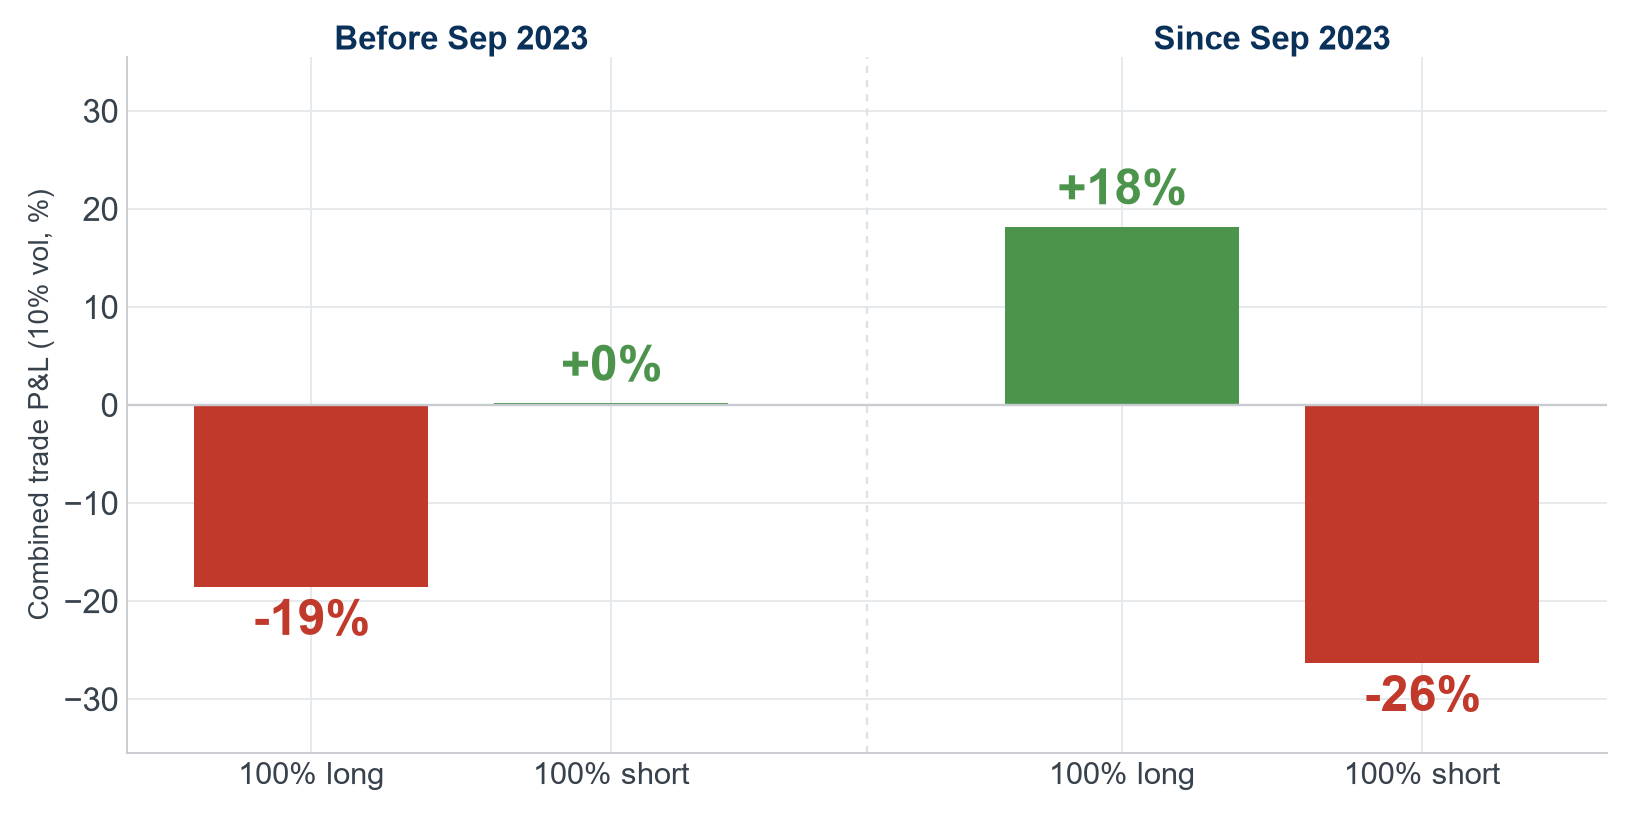
This shift suggests that UKA's downside moves have become more limited once CTAs reach maximum-short exposure, while upward trends now offer opportunities after full long deployment.
P&L during maximum-short periods: peak vs. realized at full exit
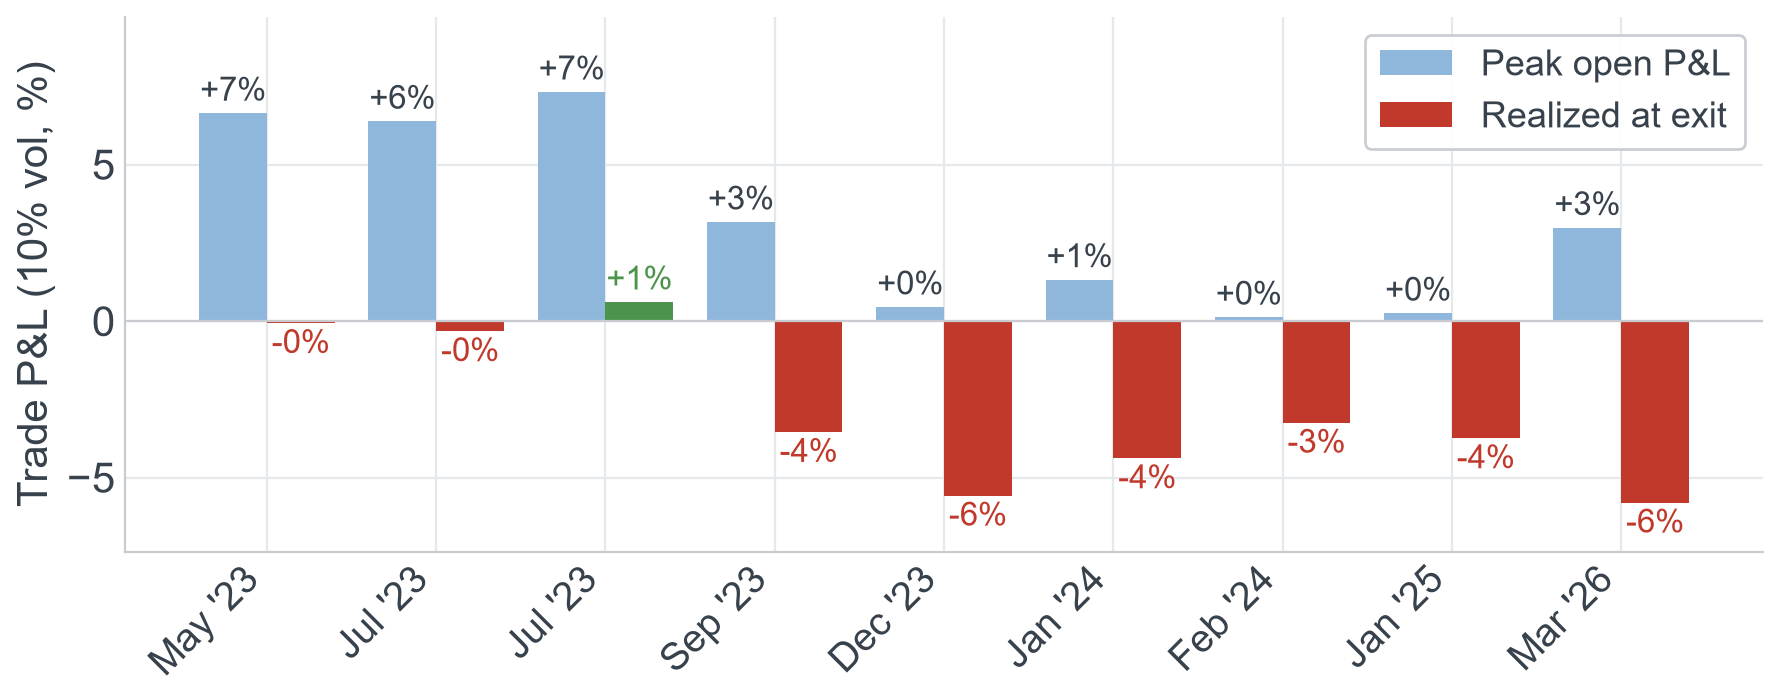
Maximum-short positions have historically generated positive open P&L, but failed to retain those gains through full exit:
- Average peak open P&L: +3.2%
- Average realized P&L at exit: −0.8%
Before September 2023, maximum-short positions reached peak open profits of 6–7%, with most gains surrendered by exit. Since September 2023, peak profits have been smaller, while realized losses have persisted.
This suggests that recent downward price moves have offered less additional profit potential once CTAs reach maximum-short exposure.
P&L during maximum-long periods: peak vs. realized at full exit
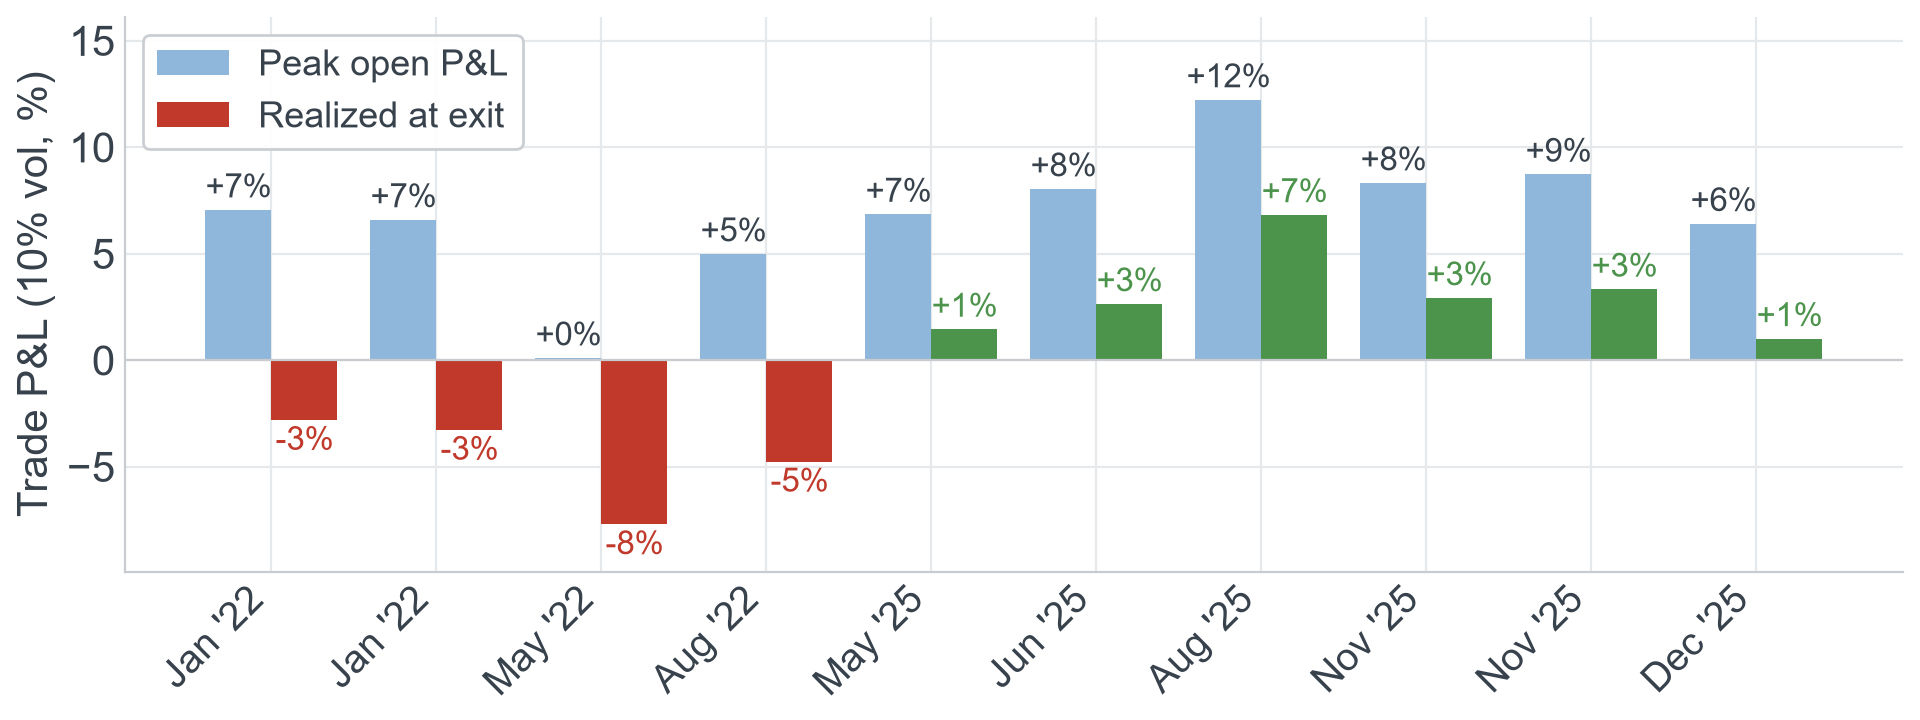
Maximum-long positions have historically generated larger peak profits than maximum-short positions, with realized performance improving in recent periods:
- Average peak open P&L: +6.9%
- Average realized P&L at exit: −0.5%
Prior to 2023, maximum-long periods consistently ended in losses despite reaching positive peak P&L. Since 2023, all observed maximum-long periods have closed profitably, retaining a portion of their peak gains.
This improvement aligns with stronger upward price continuation after CTAs reach full long deployment.
Price continuation after maximum exposure
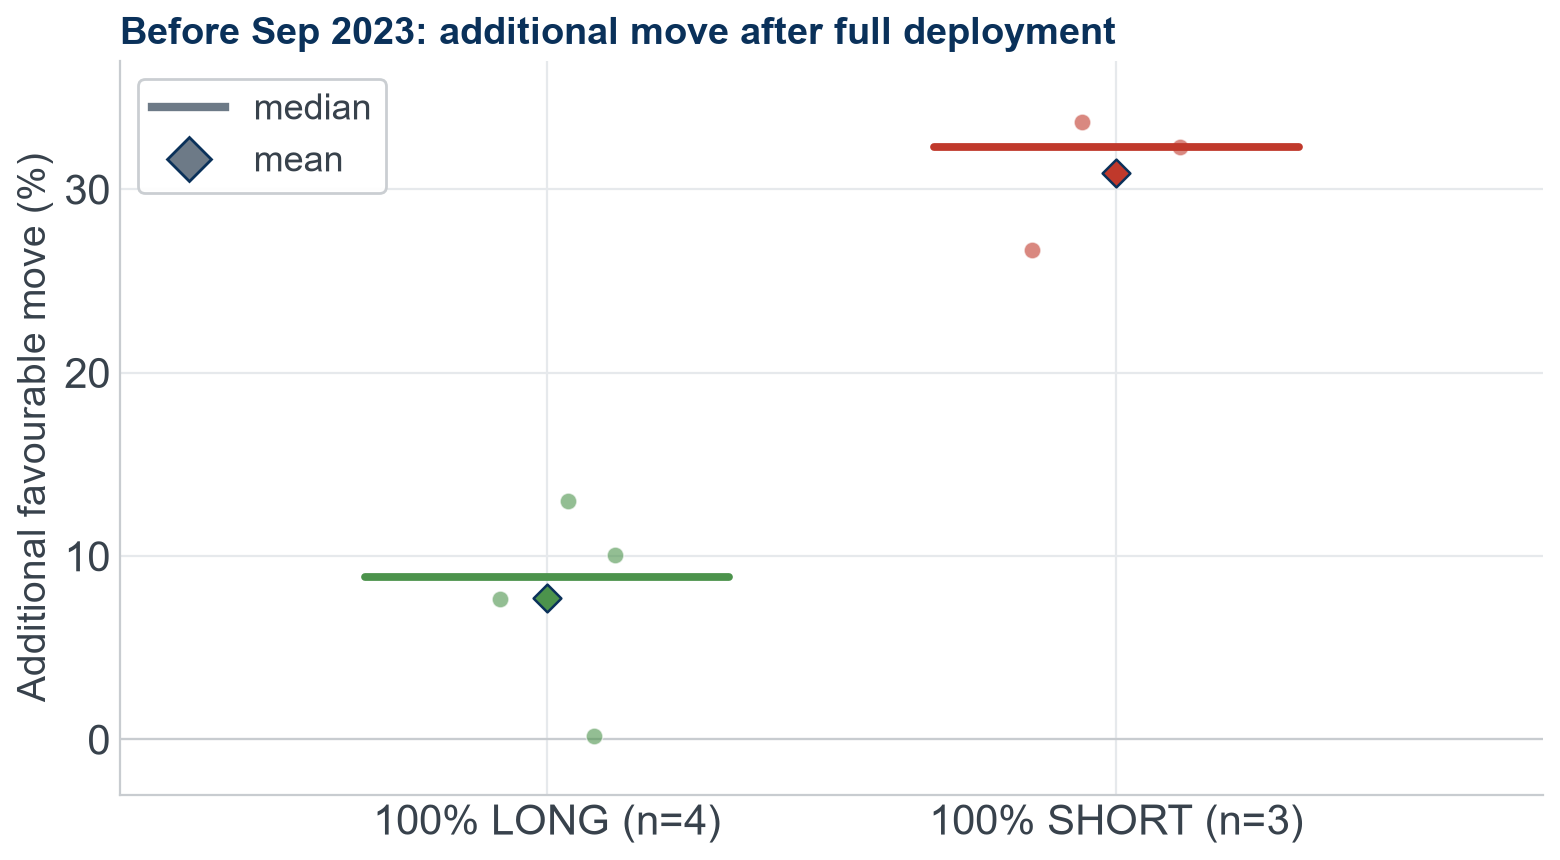
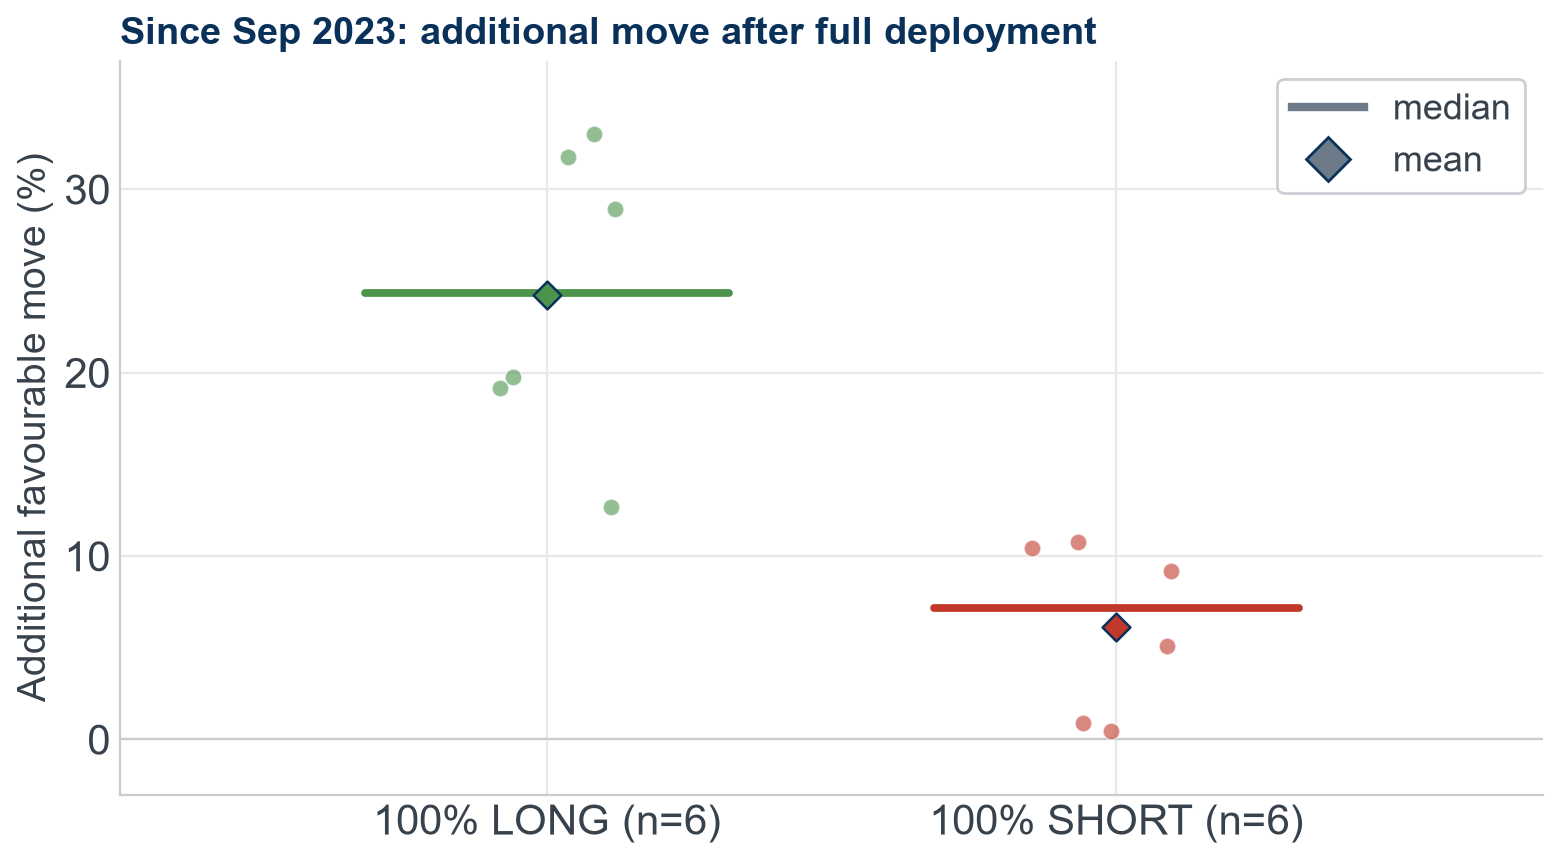
To assess remaining trend potential, we measure the additional favorable price move after CTAs reach maximum exposure, expressed as a percentage of the price at full deployment.
Before September 2023
- Maximum long: +9% median additional upside (+8% mean).
- Maximum short: +32% median additional downside (+31% mean).
Since September 2023
- Maximum long: +24% median additional upside (+24% mean).
- Maximum short: +7% median additional downside (+6% mean).
Since September 2023, additional upside following maximum-long deployment has increased from 9% to 24% on a median basis. Additional downside following maximum-short deployment has declined from 32% to 7%.
The shift suggests that maximum-long exposure now occurs earlier in the remaining price trend, while maximum-short exposure occurs closer to the end of downward moves.
Additional price move after reaching full deployment
Current UKA trend positioning
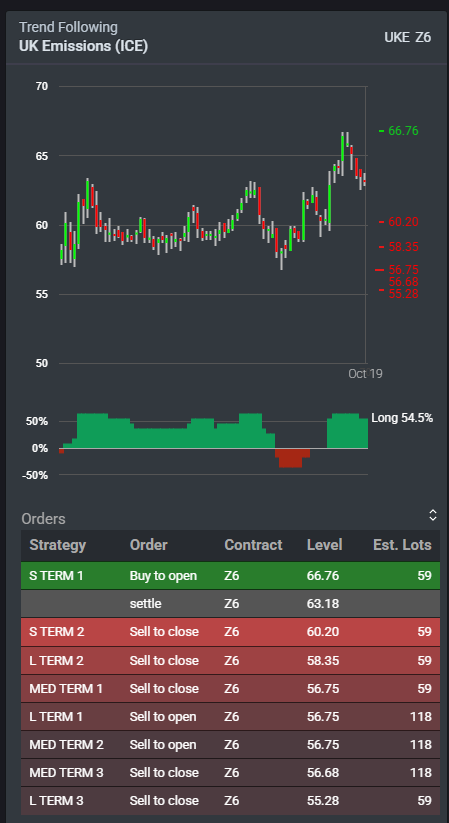
UKA is currently positioned (54.5% deployed, around £63/tonne as of Oct 19 2026). At maximum exposure both sides have lost money historically, but since September 2023 the long has been the side with room left to run. With price recovering off its lows, a fully long position still has price moves to capture after full deployment, while a fully short one now arrives with the fall already spent. Any single long exit still gives back part of its open gain, but recently the long has been the side where UKA’s price move continued, rather than the one where price was already exhausted.
Kpler Financial Flows (formerly Bridgeton Research Group), quantifies where algorithmic trading flows may accelerate or unwind, with multi asset coverage across agriculture, energy, metals, power, gas, softs and financials.
- Data back to 2014
- 400+ Market tickers
- 0.9+ Correlation to key benchmarks

See why the most successful traders and shipping experts use Kpler
Actionable insights into algorithmic trading behaviour