How Kpler can help track sulphur supply chain & associated market impacts
As of this writing, Sulphur crossings in the strait of Hormuz still remain significantly below pre-war pacing, despite a period of growth in June. The impact of this significant supply disruption is being felt throughout the globe. Prices are up significantly in correlation with the disruption to supply, at about 75%. Navigating this current situation requires an accurate, real-time view on granular events and trade flows.
Kpler can help market professionals navigate this volatile time with its suite of real-time data and analytics. Let’s take a look at how Kpler can illuminate this situation to provide important up-to-the-minute information for decision makers.
Sulphur exports through the Strait of Hormuz remain below pre-war pace
Sulphur exports that cross the Strait of Hormuz from March to September of this year are still about 55% of the pre-war pace. Kpler tracks vessel crossings in the Strait of Hormuz and other key chokepoints with additional verification methods such as satellite imagery and more - in order to provide accurate data regarding cargo flows. We can see below that Kpler shows that between March and September of this year, flows now have a 3 month moving average of 541kt - significantly lower than the months preceding March 2026 when the 3 month moving average was 1,351kt in February.
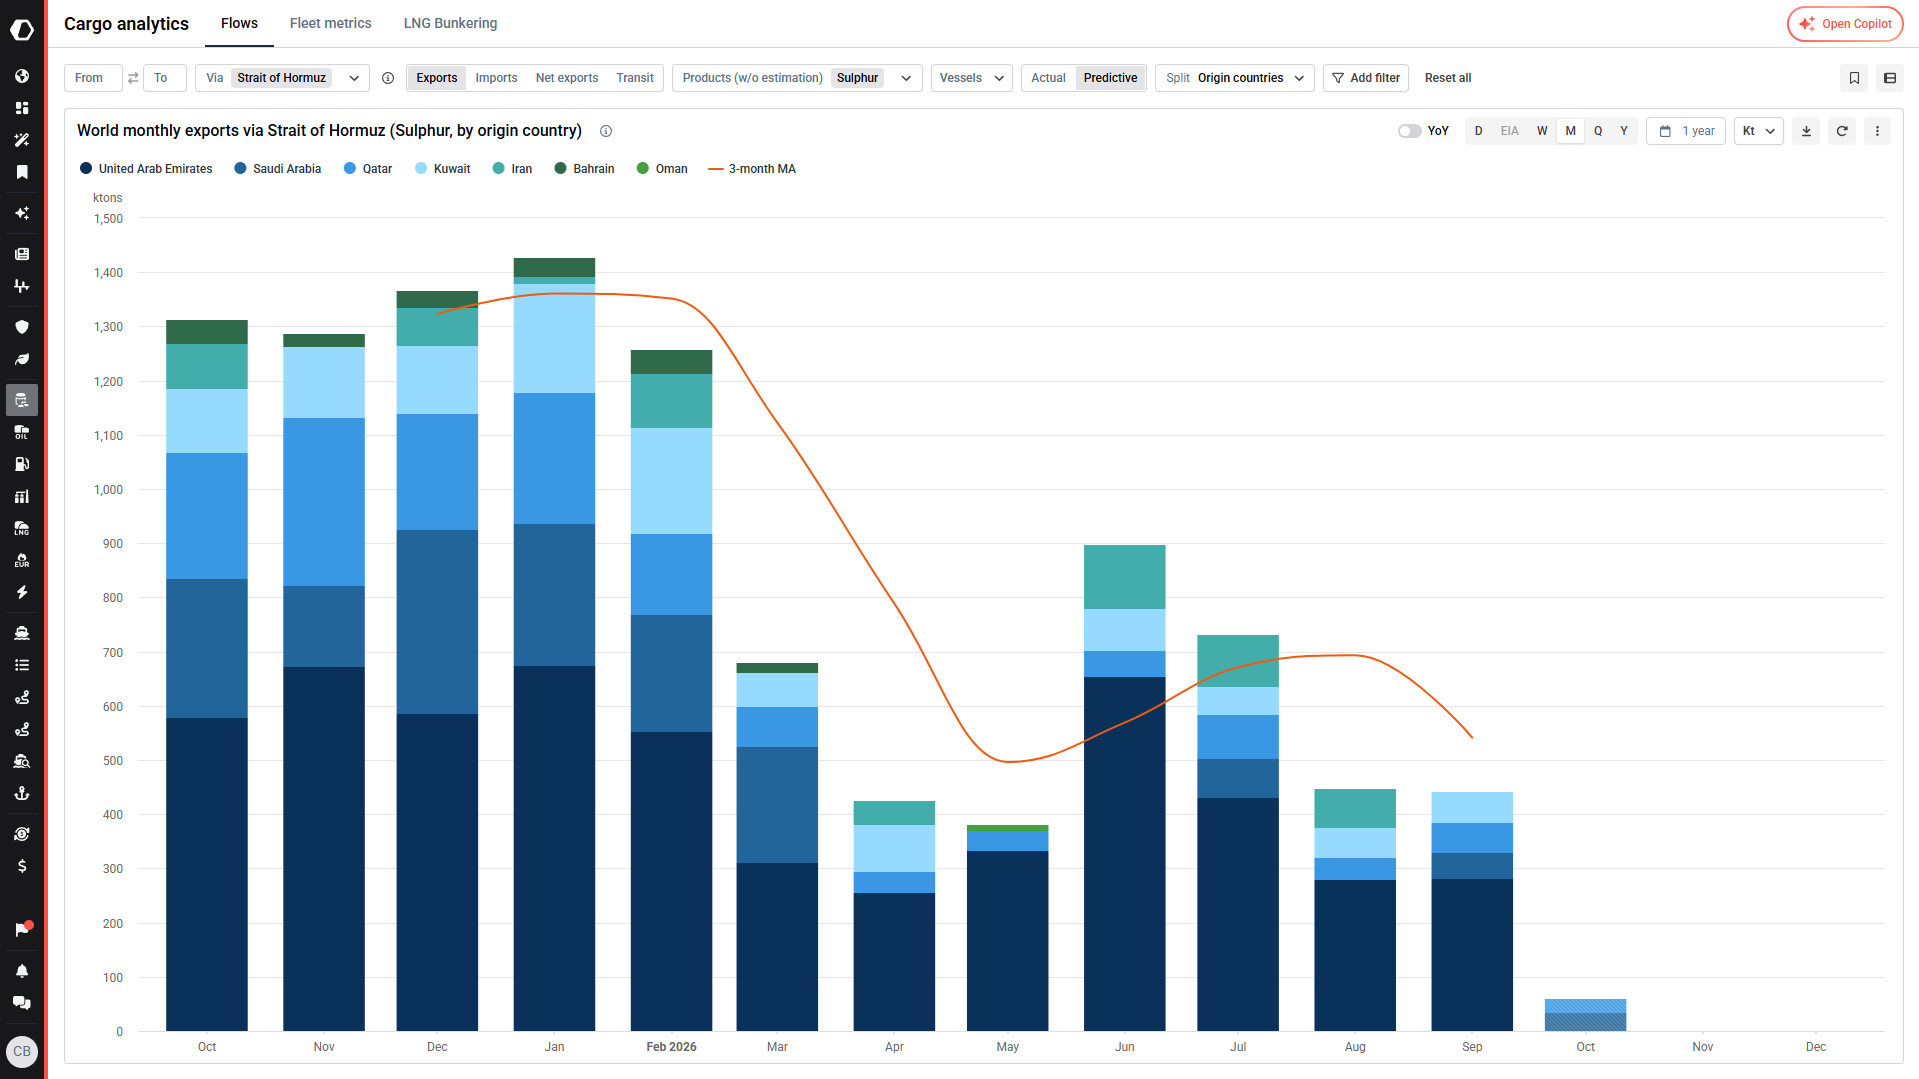
Gulf ports and installation-level sulphur export flows
Kpler is able to provide installation level intelligence for cargo flows to help pinpoint important secondary details regarding trade flows. Kpler is able to identify that ports inside the Gulf are two-thirds of pre war levels. Further, that these ports accounted for about half of the sulphur exports prior to the conflict - which can be seen in the graph below. Kpler provides a wide variety of useful filters for its data including ports and installations.
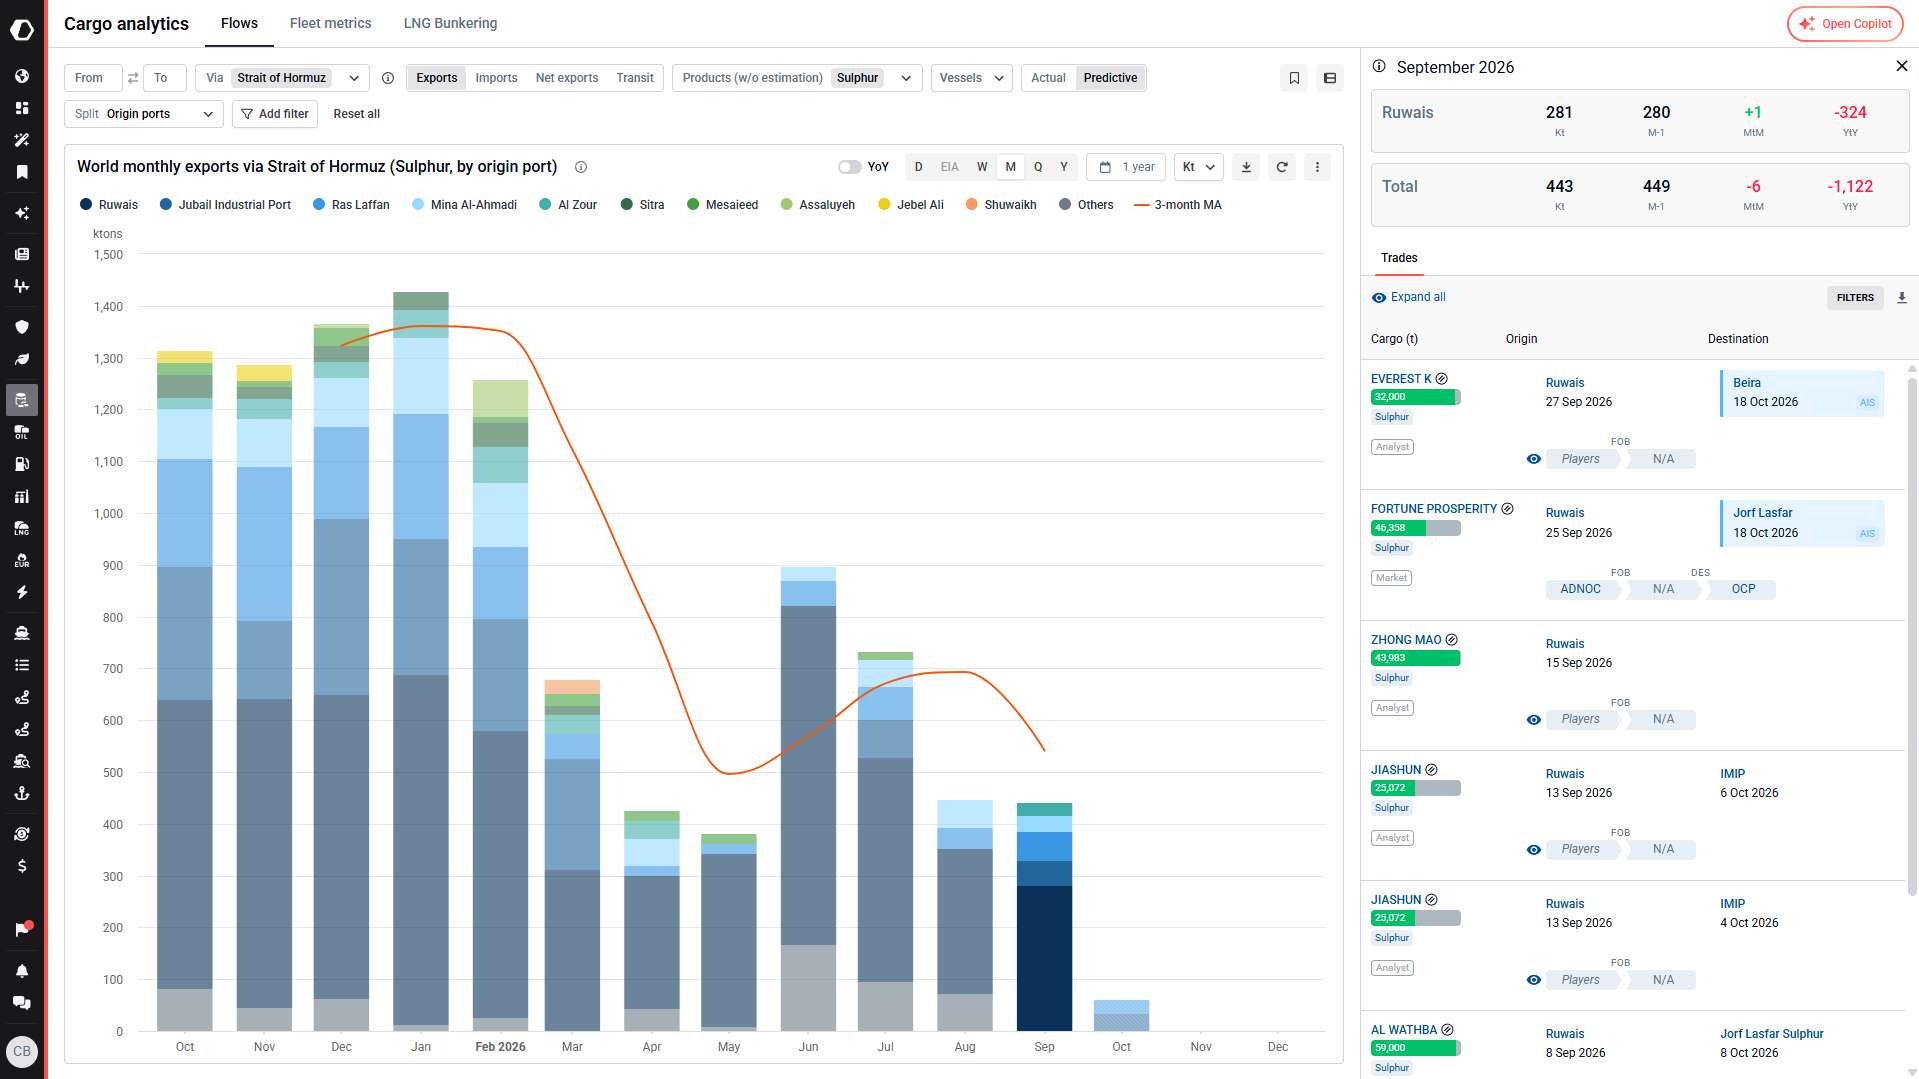
We can see from the data above as well that the majority of exports are now coming from Ruwais in the UAE.
US-Iran MoU lifts sulphur crossings without restoring loadings
When the MoU was signed earlier this year between the United States and Iran, crossings accelerated. As can be seen in the charts above, Kpler tracked an increase of 517kt of sulphur exported via the Strait of Hormuz between May and June this year. Kpler also tracks data on volumes of vessel crossings in straits globally, as well as enabling its users to filter cargo data across a wide range of splits in its terminal. Below we can see a sample of this data , showing an increase in frequency in June of 30% over pre-war levels.
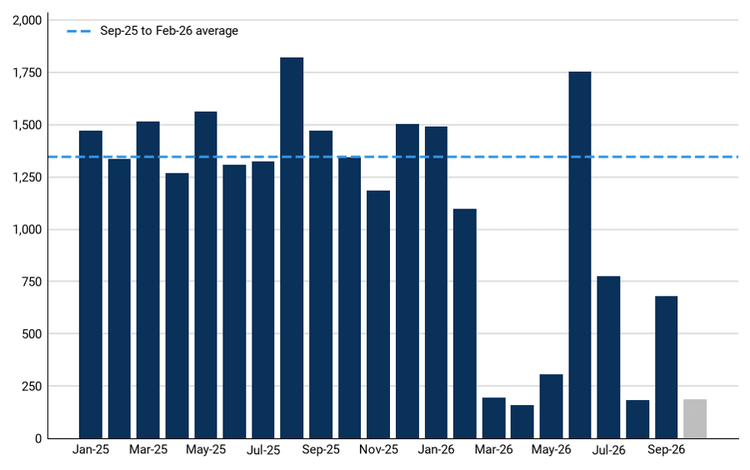
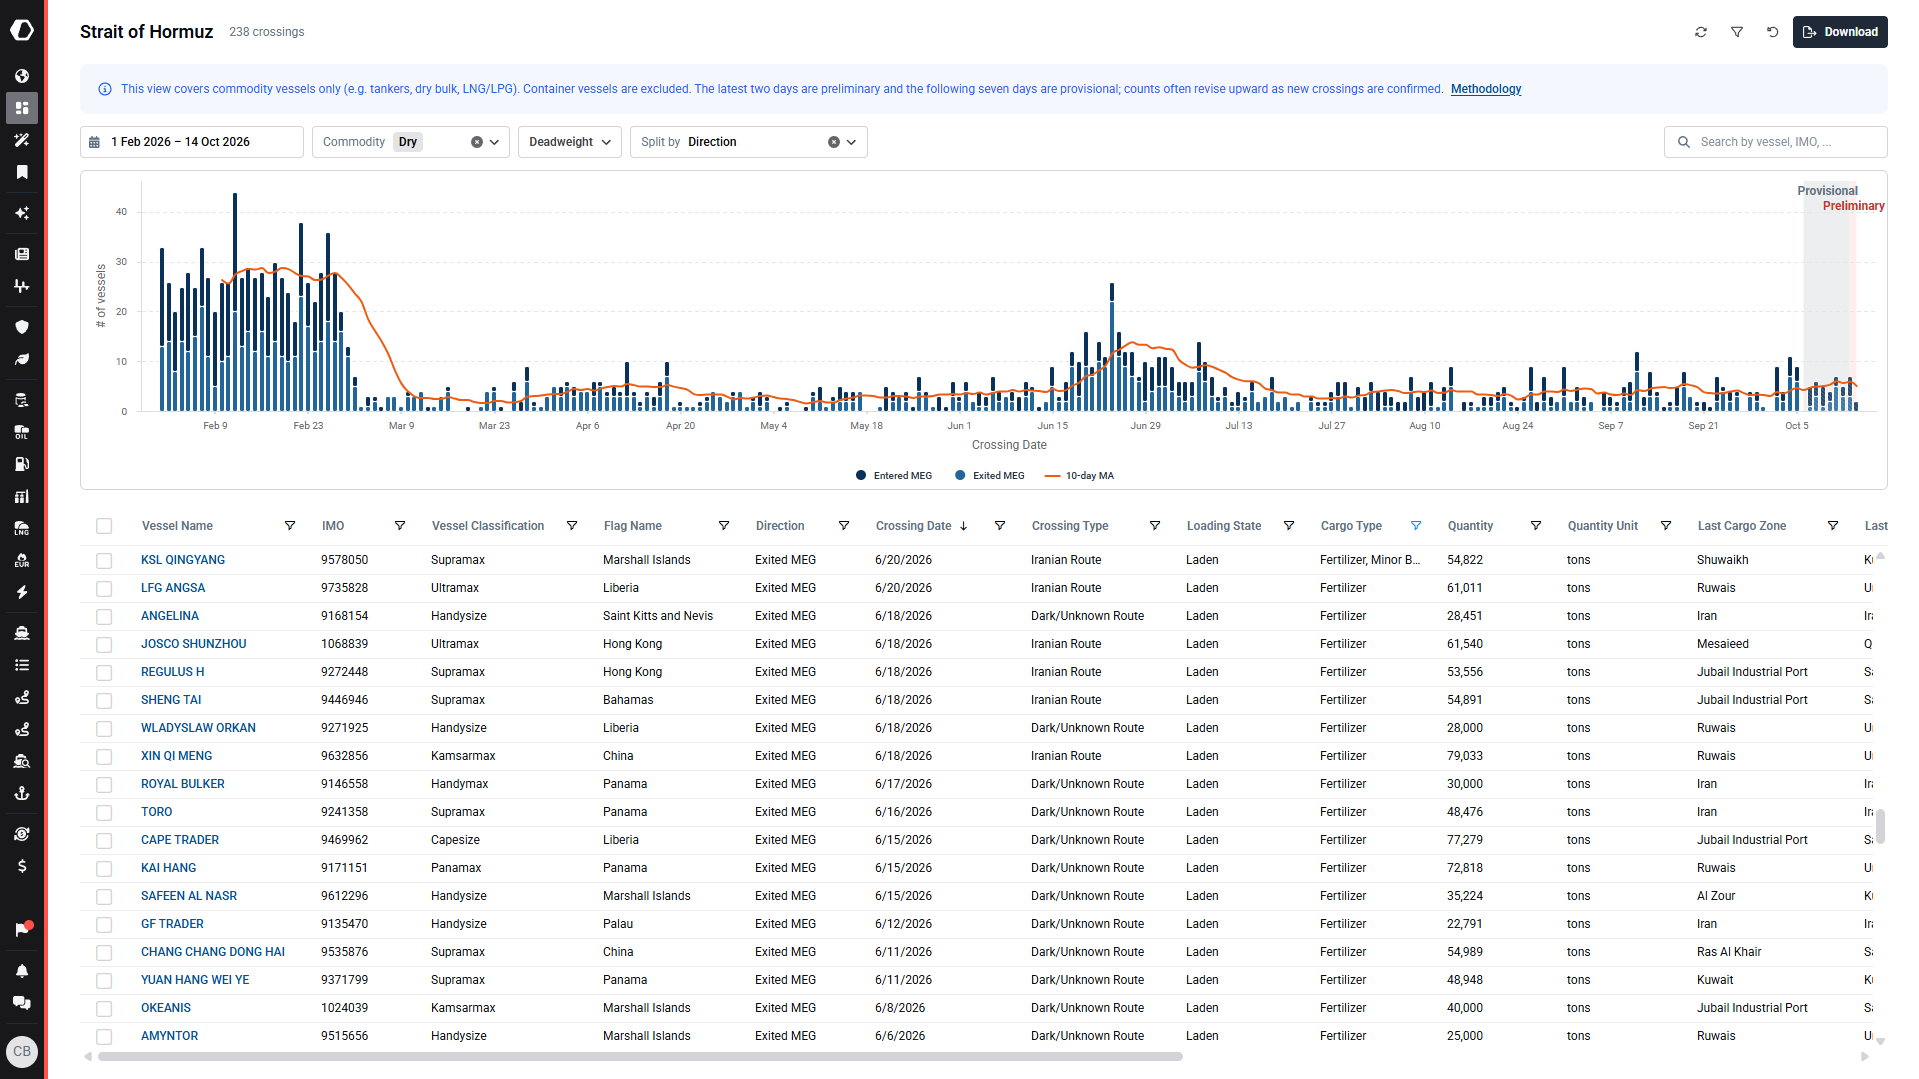
This surge is due to vessels that had been held since March that were ready to exit with cargo, not representative of renewed loading activity. Kpler is able to provide a vessel-by-vessel breakdown for crossings, to pinpoint critical details, evidenced below by the dashboard.
Laden vessel backlog builds in the Mideast Gulf
Important insight into the flow of volumes of product against when and where the vessels loaded that cargo can be tracked with Kpler. Using freight analytic data, we can visualize the laden sulphur vessels against the ballast vessels that could load sulphur in the Mideast Gulf region.
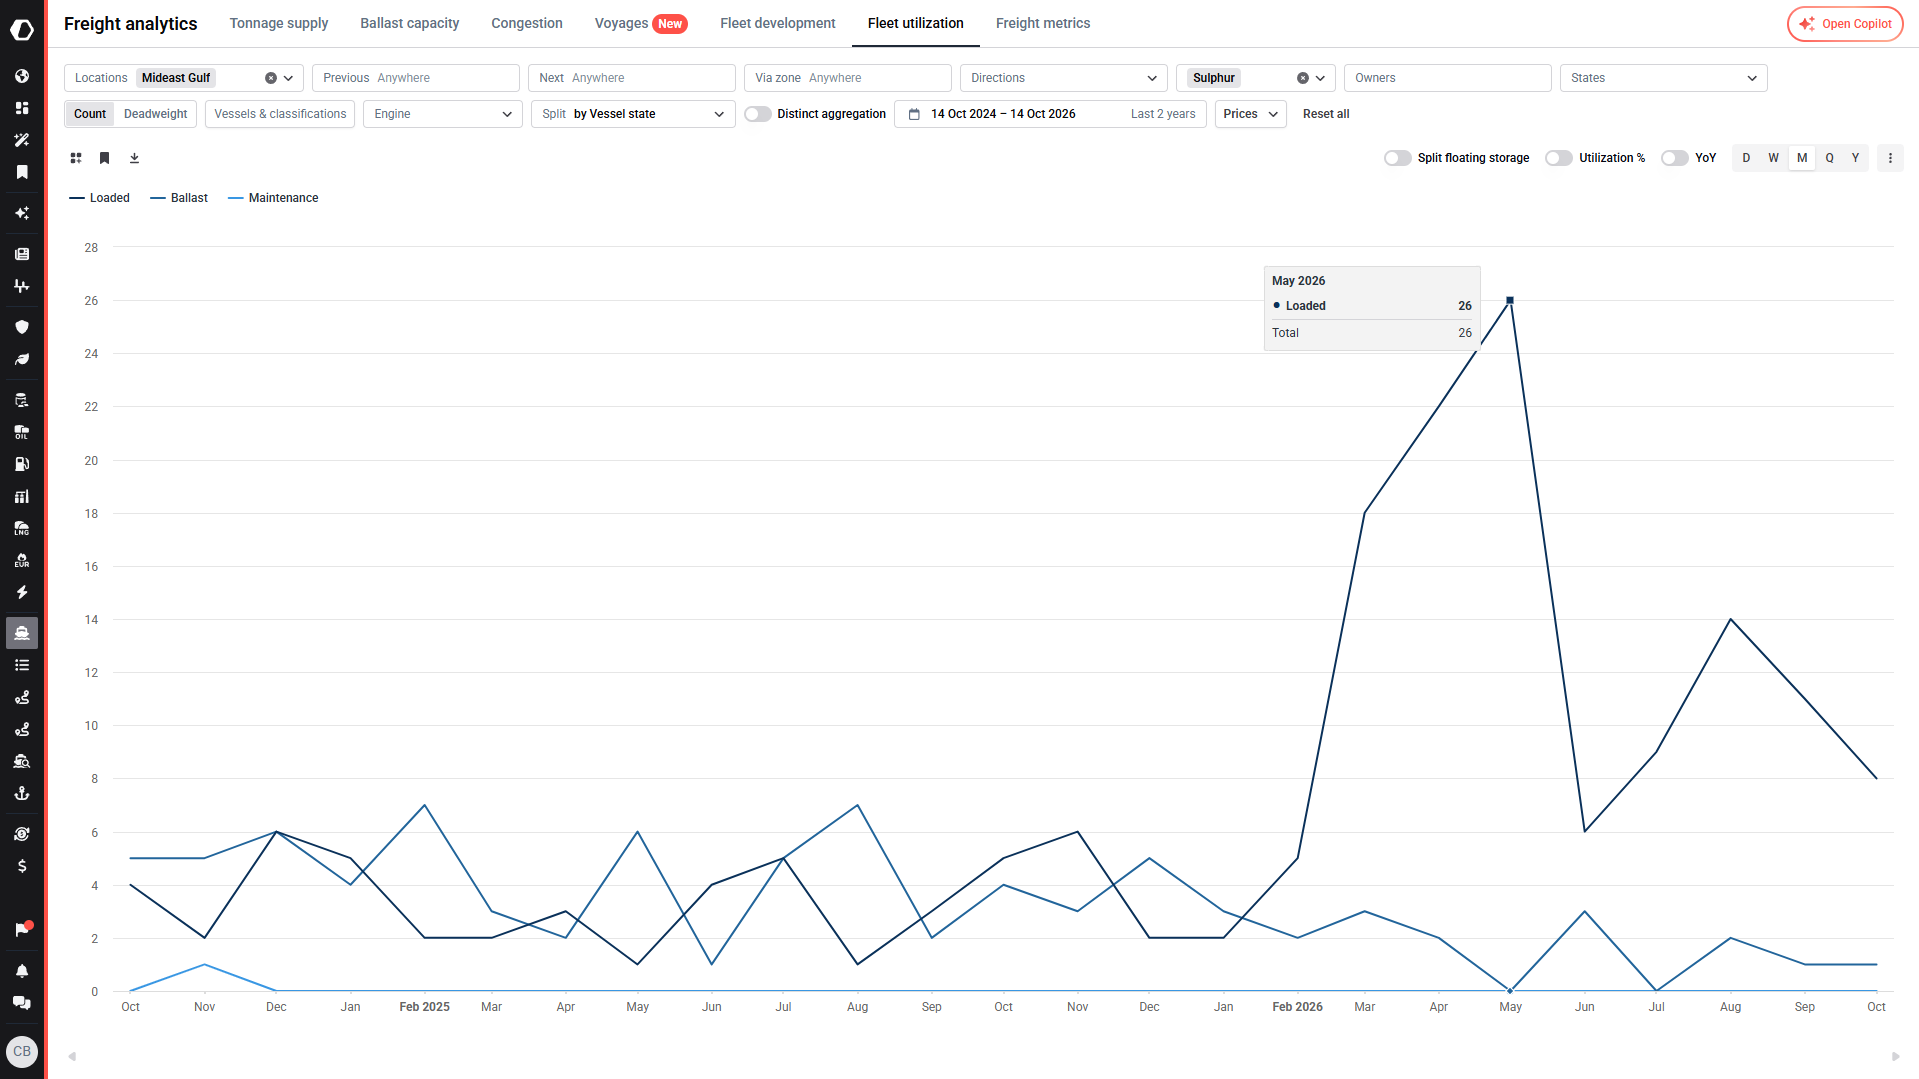
Sulphur vessel backlog builds in the Mideast Gulf
We can see that there was a laden vessel backup that grew beginning in March of this year and that it peaked in May with 0 vessels ballast in the region and 26 loaded. Once these vessels left the region the numbers of laden vessels began to climb again between July and August of this year but have fallen steadily since. The lack of ballast vessels in the region has limited the capacity for sulphur exporters to transport their cargo. As a result of the low ballast vessel count, the latest decline in the number of sulphur-loaded vessels in the Gulf is caused by fewer loadings, not because more vessels are leaving through the Strait of Hormuz.
Russia, Kazakhstan and India restrict global sulphur exports
Kpler tracks trade globally and for sulphur market professionals can provide important cross-regional trend analysis. If we look to other major sulphur exporting countries, we find that exports have also been limited. Russia has extended its ban on exports of liquid, granulated, and lump sulphur to 31 December 2026, with exemptions for members of the Eurasian Economic Union. Kazakhstan also suspended sulphur exports from 27 June, except shipments to Russian rail stations. India's sulphur exports also stopped from May to July.
When tracking Russian sulphur, Kpler observes that loadings decreased from the middle of the year declining to 0kt exported in July this year. To contextualize Russia’s share of the sulphur market, with Kpler’s platform we can easily look at global sulphur exports minus the contributions from the Mideast Gulf. We can see below that declining Russian exports have also contributed to a global slowdown of sulphur exports without the Mideast Gulf.
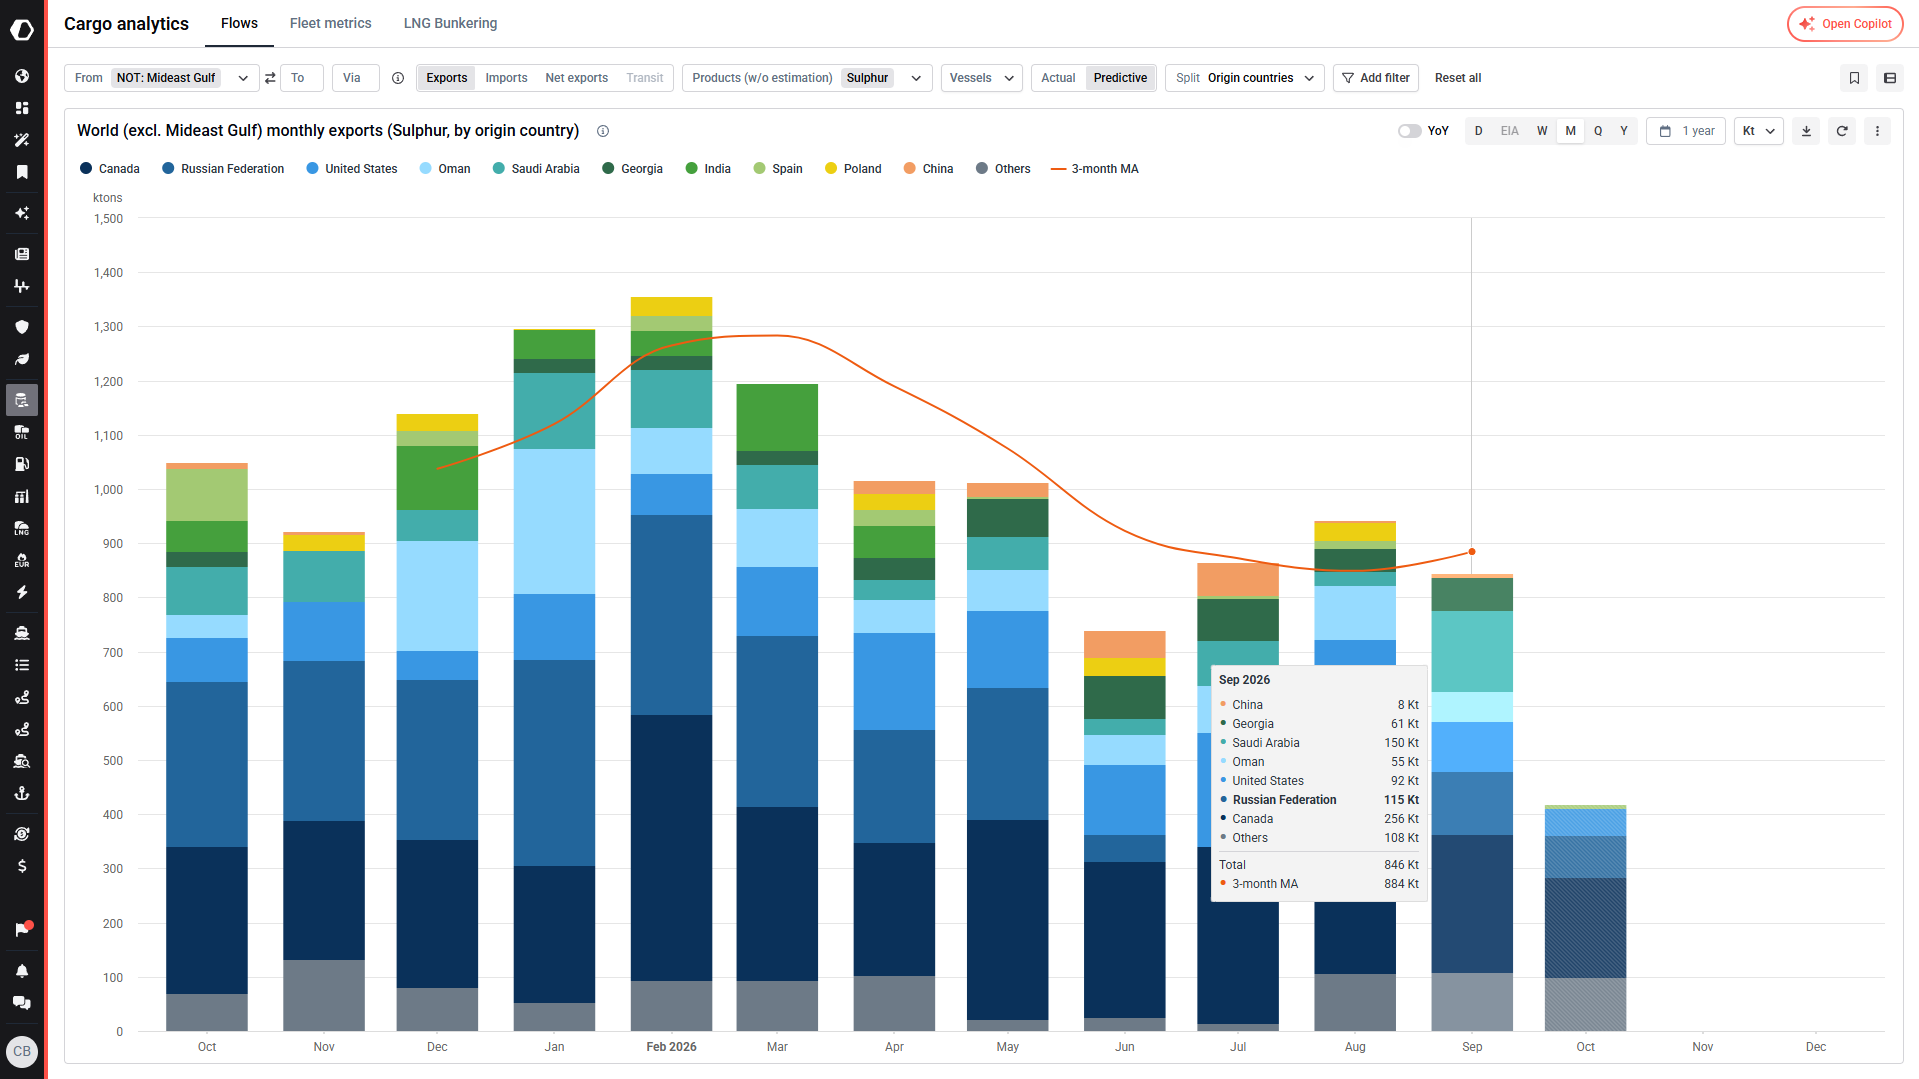
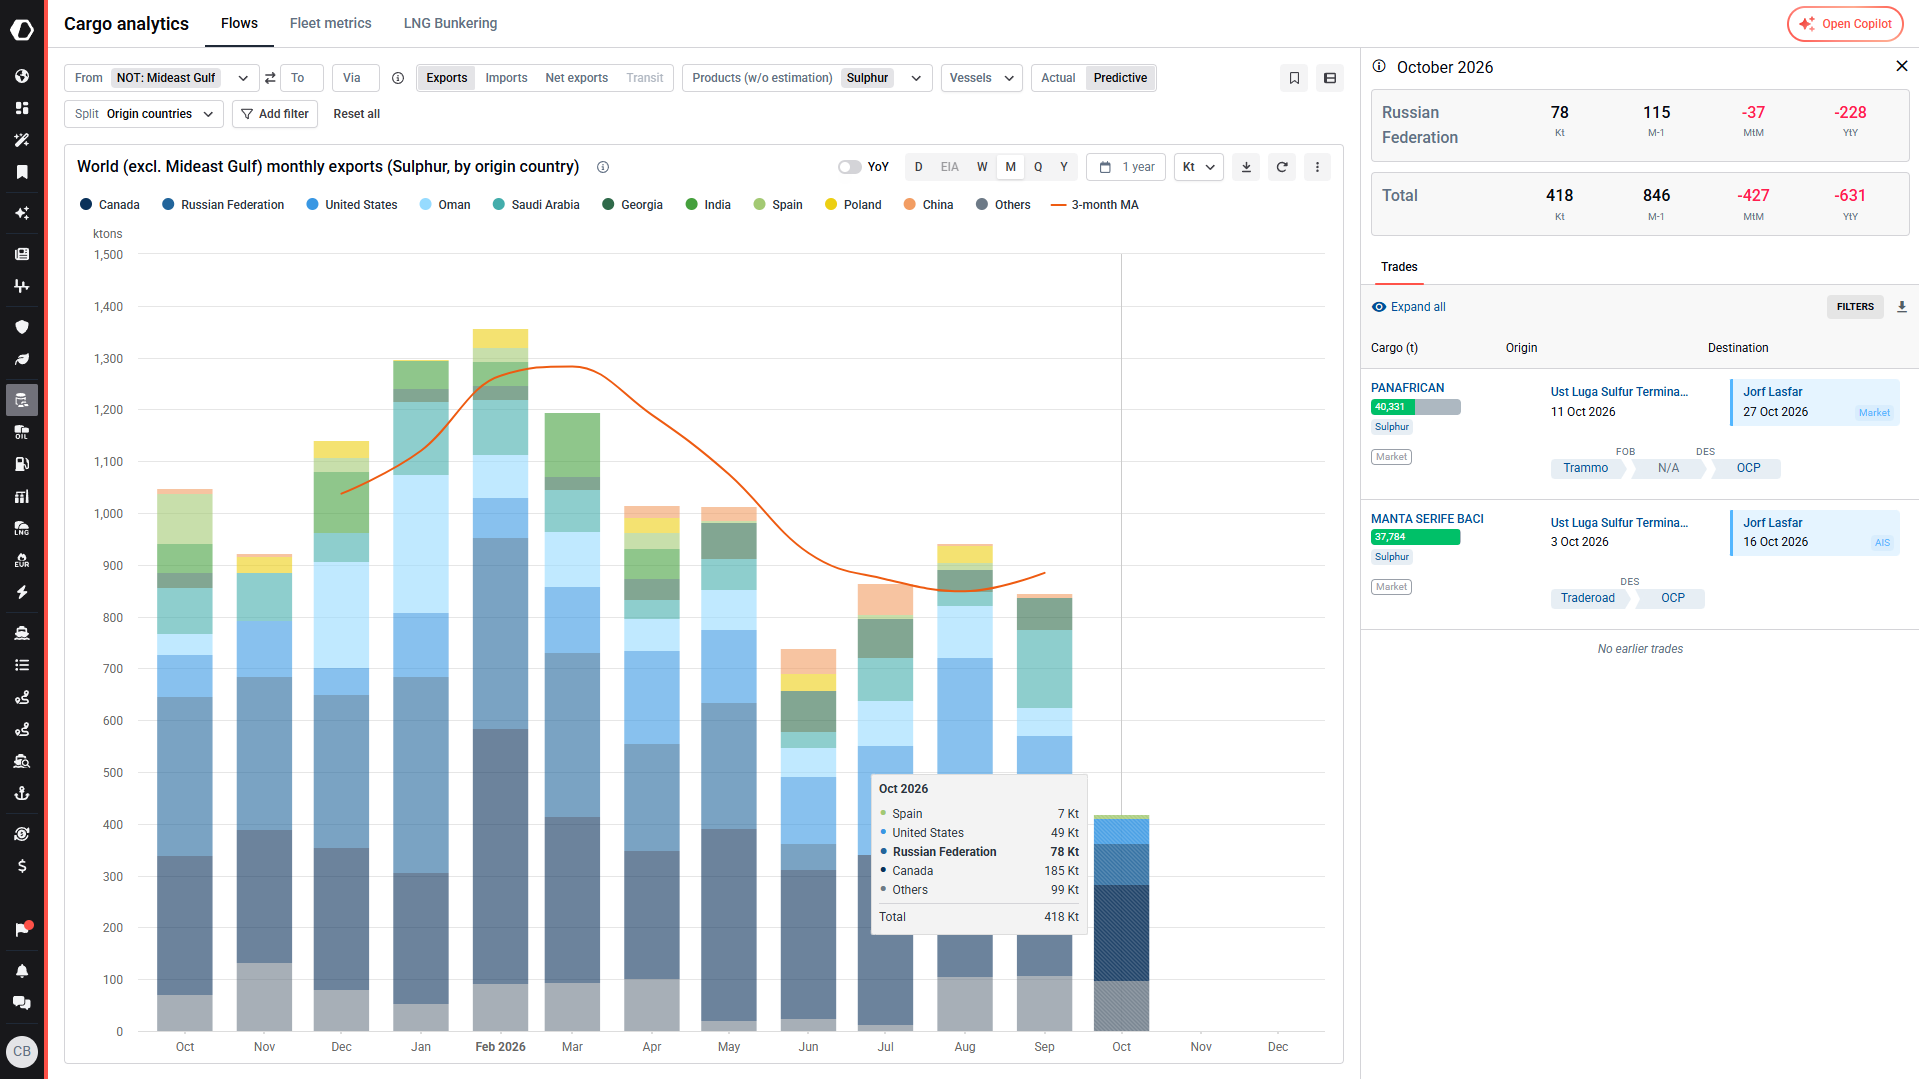
They have however begun to rebound as of September at 115kt. Kpler also enables its users to easily identify any vessels involved with data visualizations we can see below that and through October so far Kpler is tracking two loadings from Ust Luga to arrive at Jorf Lasfar this month. Ultimately however, Sulphur exports outside the Gulf are staying below the pre-war pace as well contributing to a supply deficiency.
China's sulphur imports fall sharply after the war began
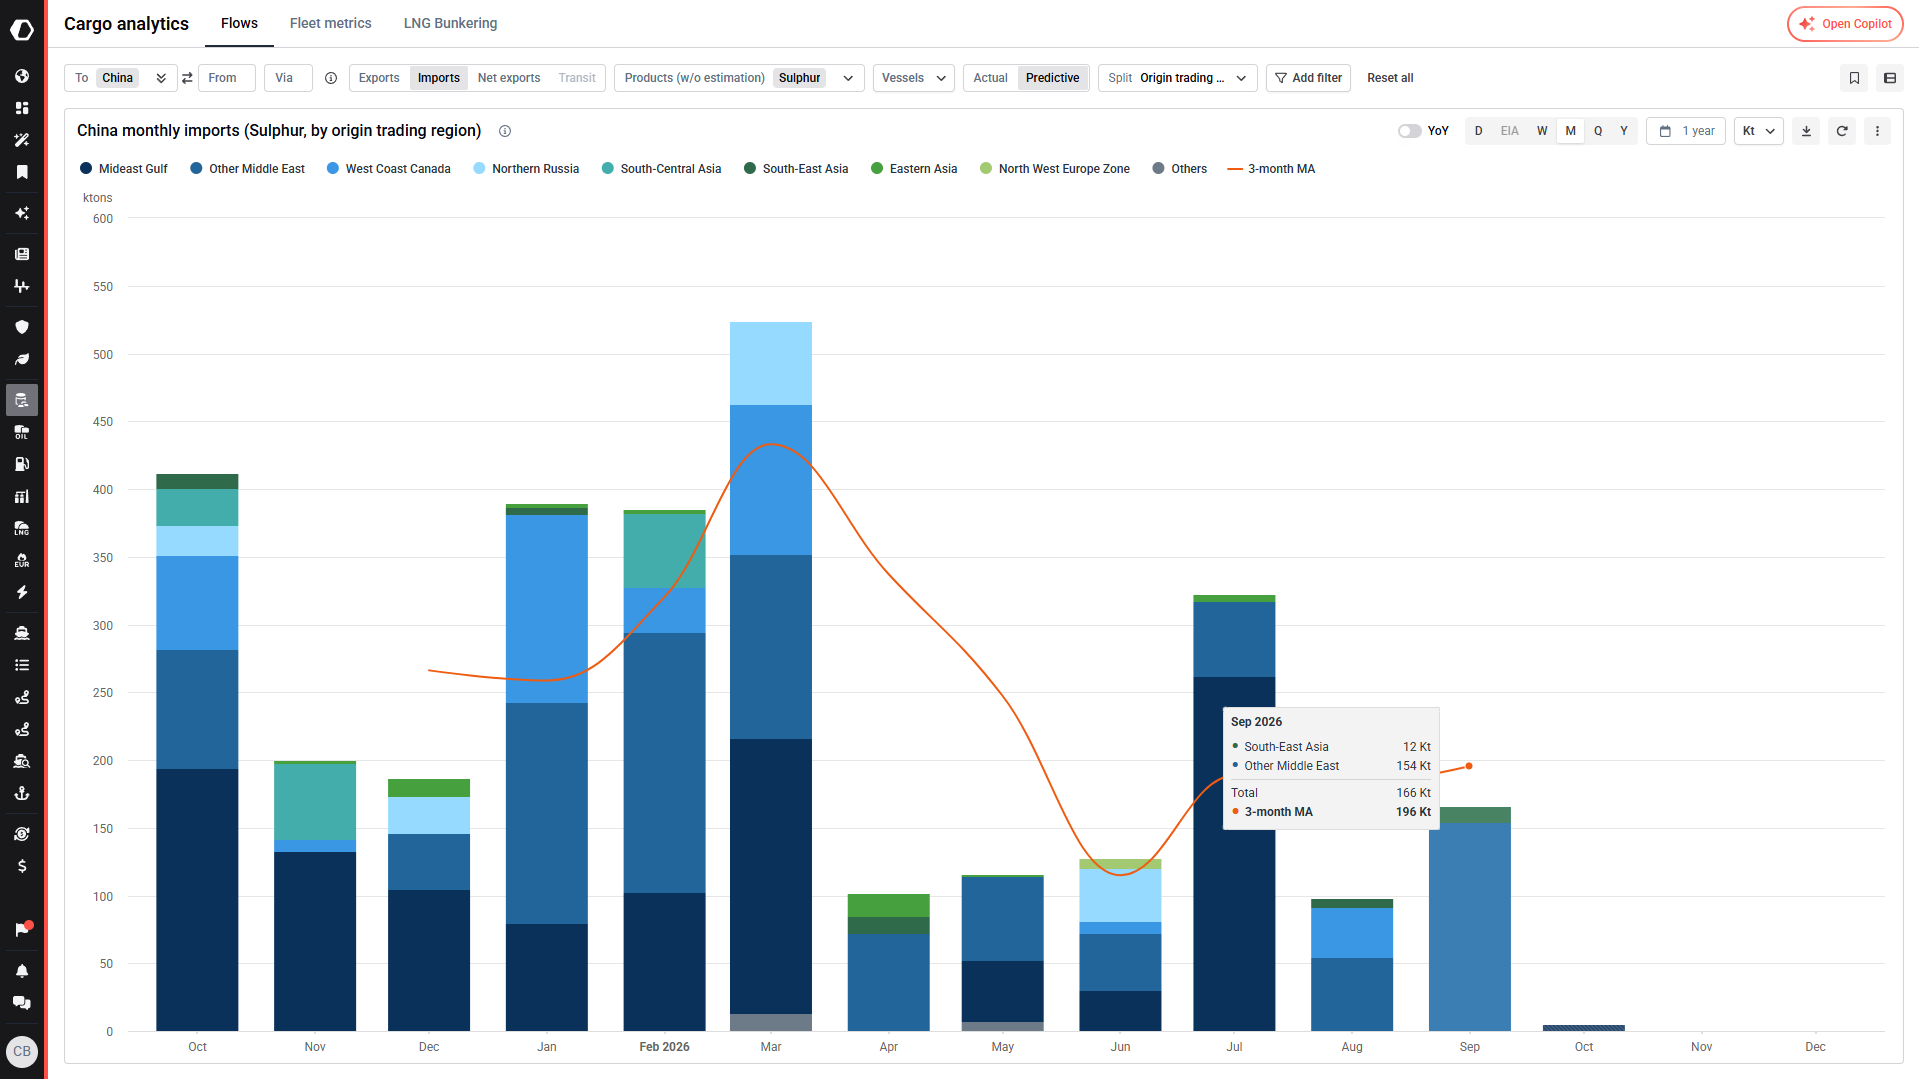
As a major importer of sulphur, market professionals must pay close attention to China’s activity. China’s imports of sulphur fell sharply after the war began. We can see in the graph below that the share of sulphur imports from Mideast Gulf was significant in February constituting the highest share among importing regions.
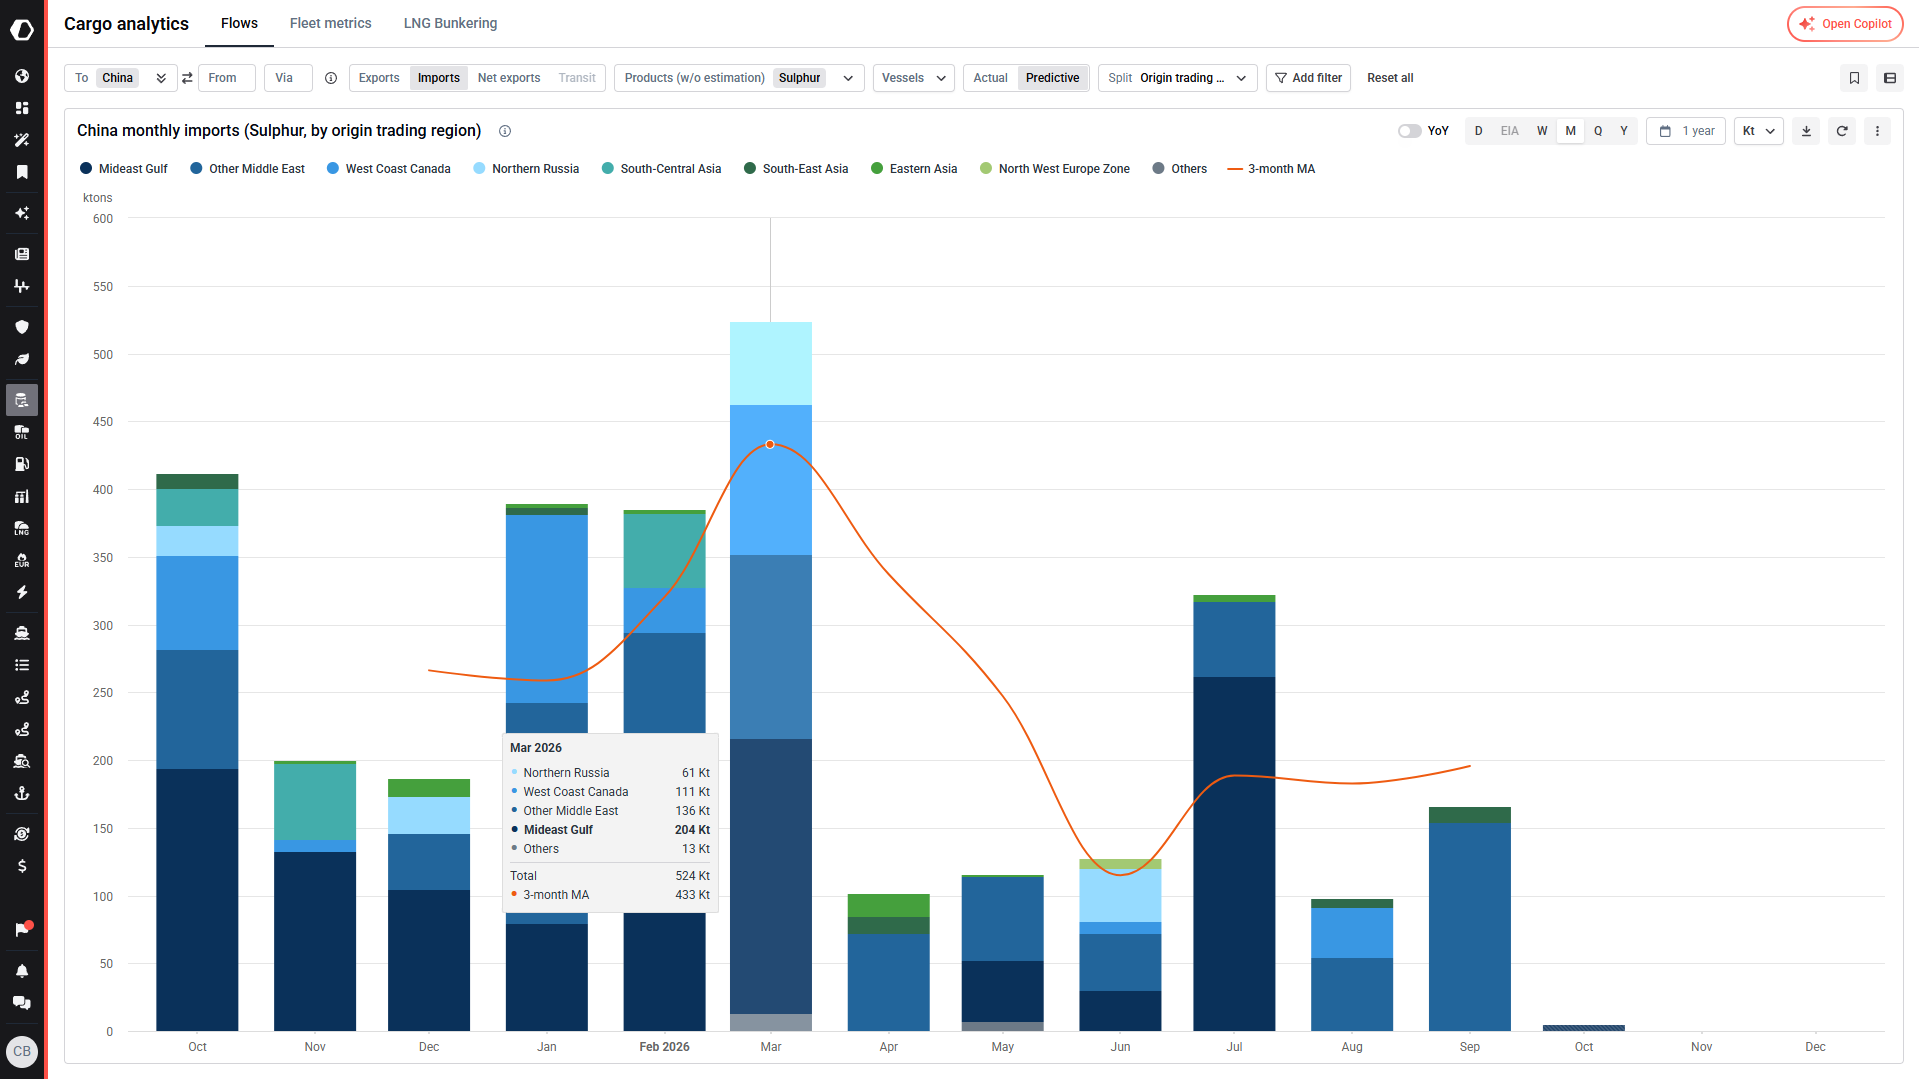
The following months, the moving average fell to a low of 115kt overall of sulphur imports to China with the figure as of last month at 196kt.
China's sulphuric acid exports stop and Chile turns to other suppliers
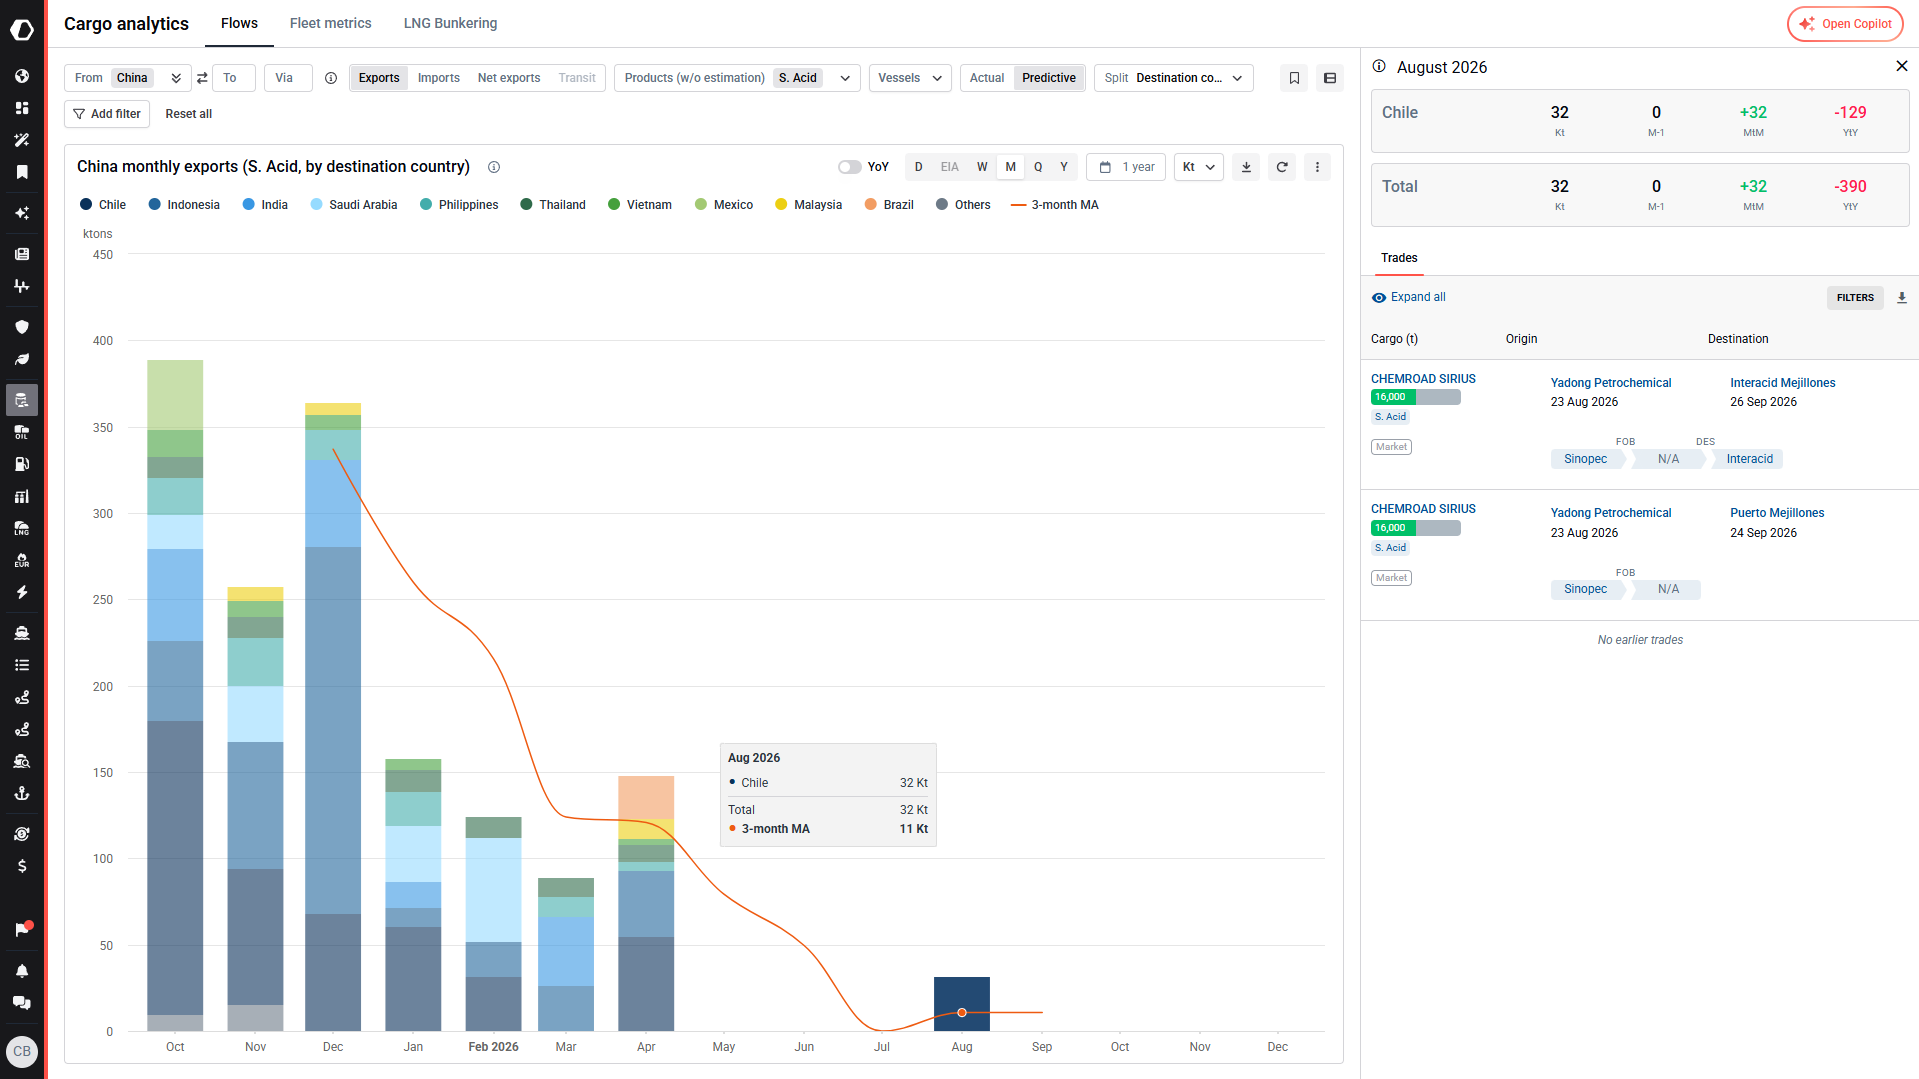
Additionally, China is the world's largest exporter of sulphuric acid. However, in May exports stopped. They have remained at 0 since, with one vessel heading to Chile between May and October.
Chile, a major importer of Chinese sulphuric acid for copper leaching, was importing 71kt, its second largest share, from China in February.
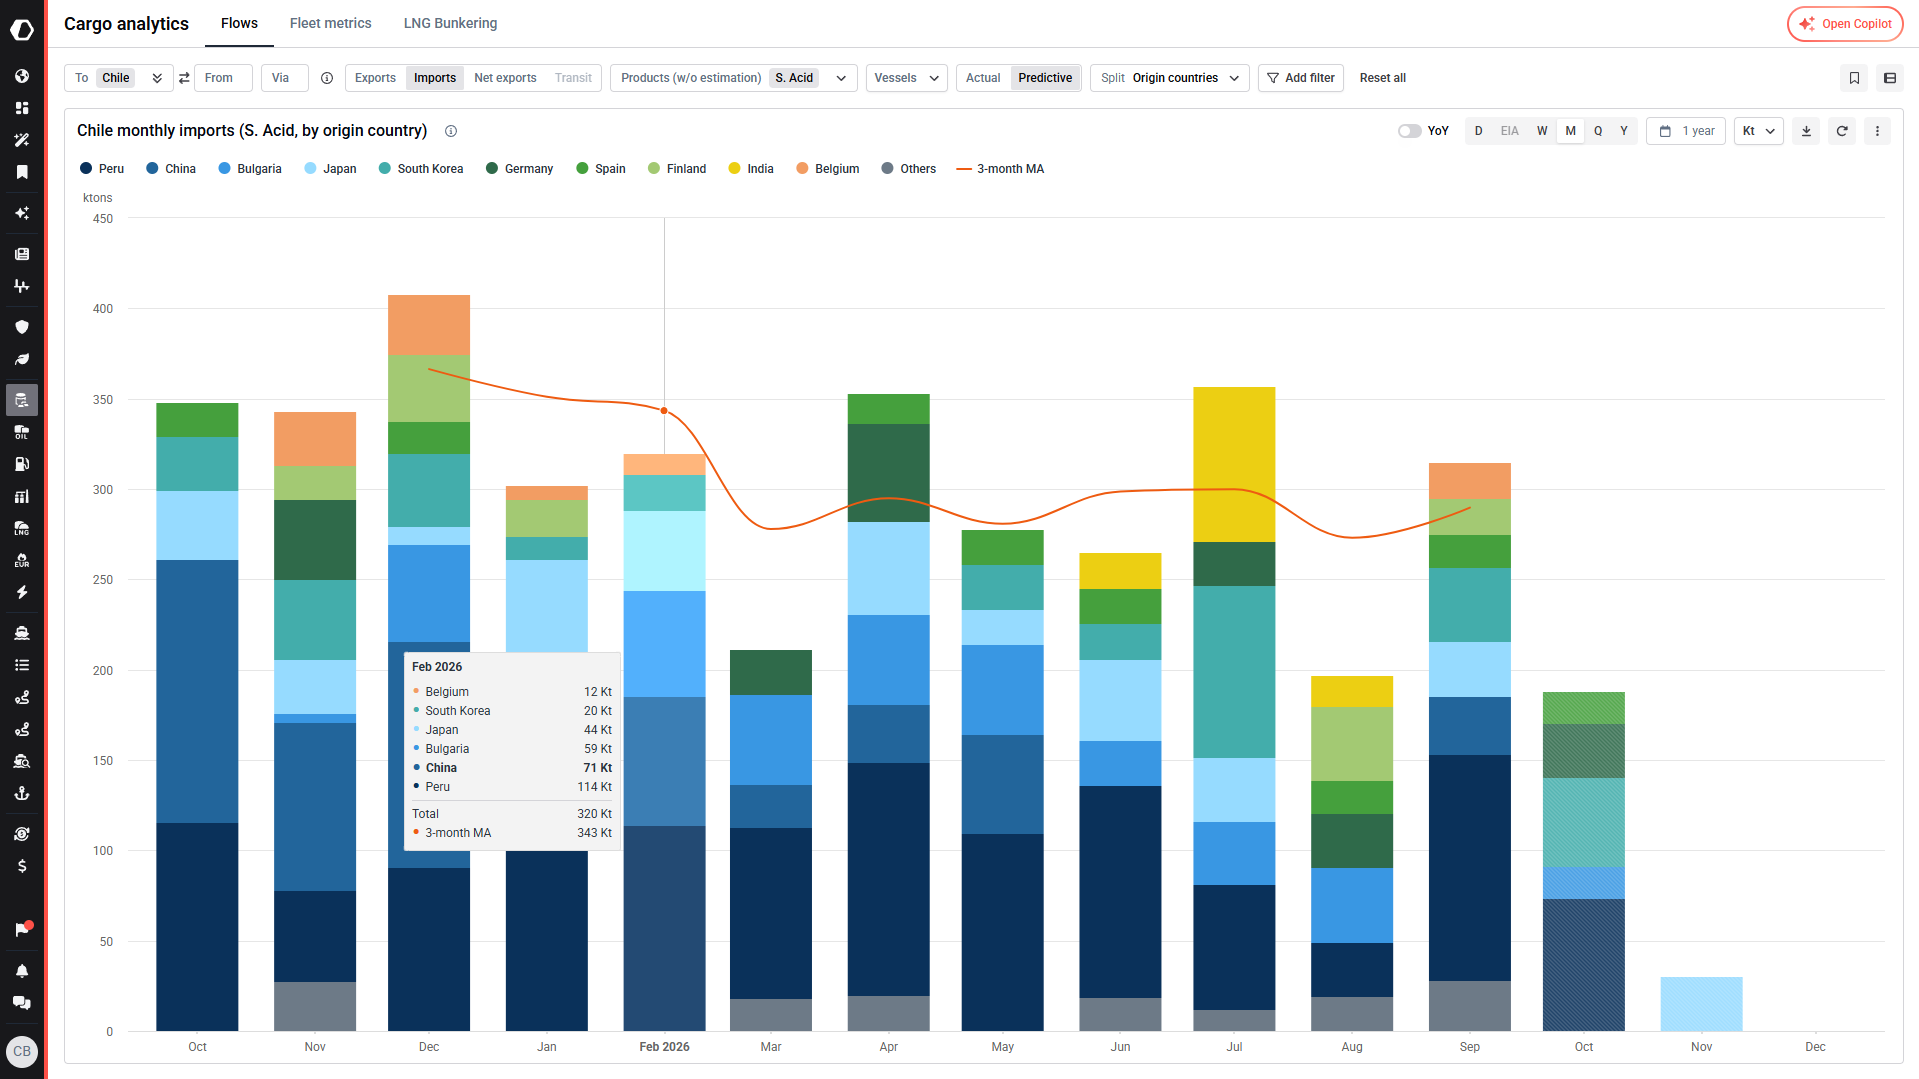
After the conflict began, and China ceased exporting in May, Chile was able to find acid exporters elsewhere in the world to fill this gap. The country imported from Peru as well as Japan, South Korea, and Bulgaria.
Morocco's phosphate exports hold up despite lower sulphur imports
Morocco is another major importer of Sulphur as it is a major exporter of phosphate fertiliser. Despite weaker sulphur imports, exports have held up this year. With the disruptions from the Sulphur imports dipped. The UAE, major sulphur trading partner for Morocco, almost stopped shipping between May and June. In the data below we can see that Russia, Georgia, the US, and Canada filled part of the gap until UAE cargoes returned in July.
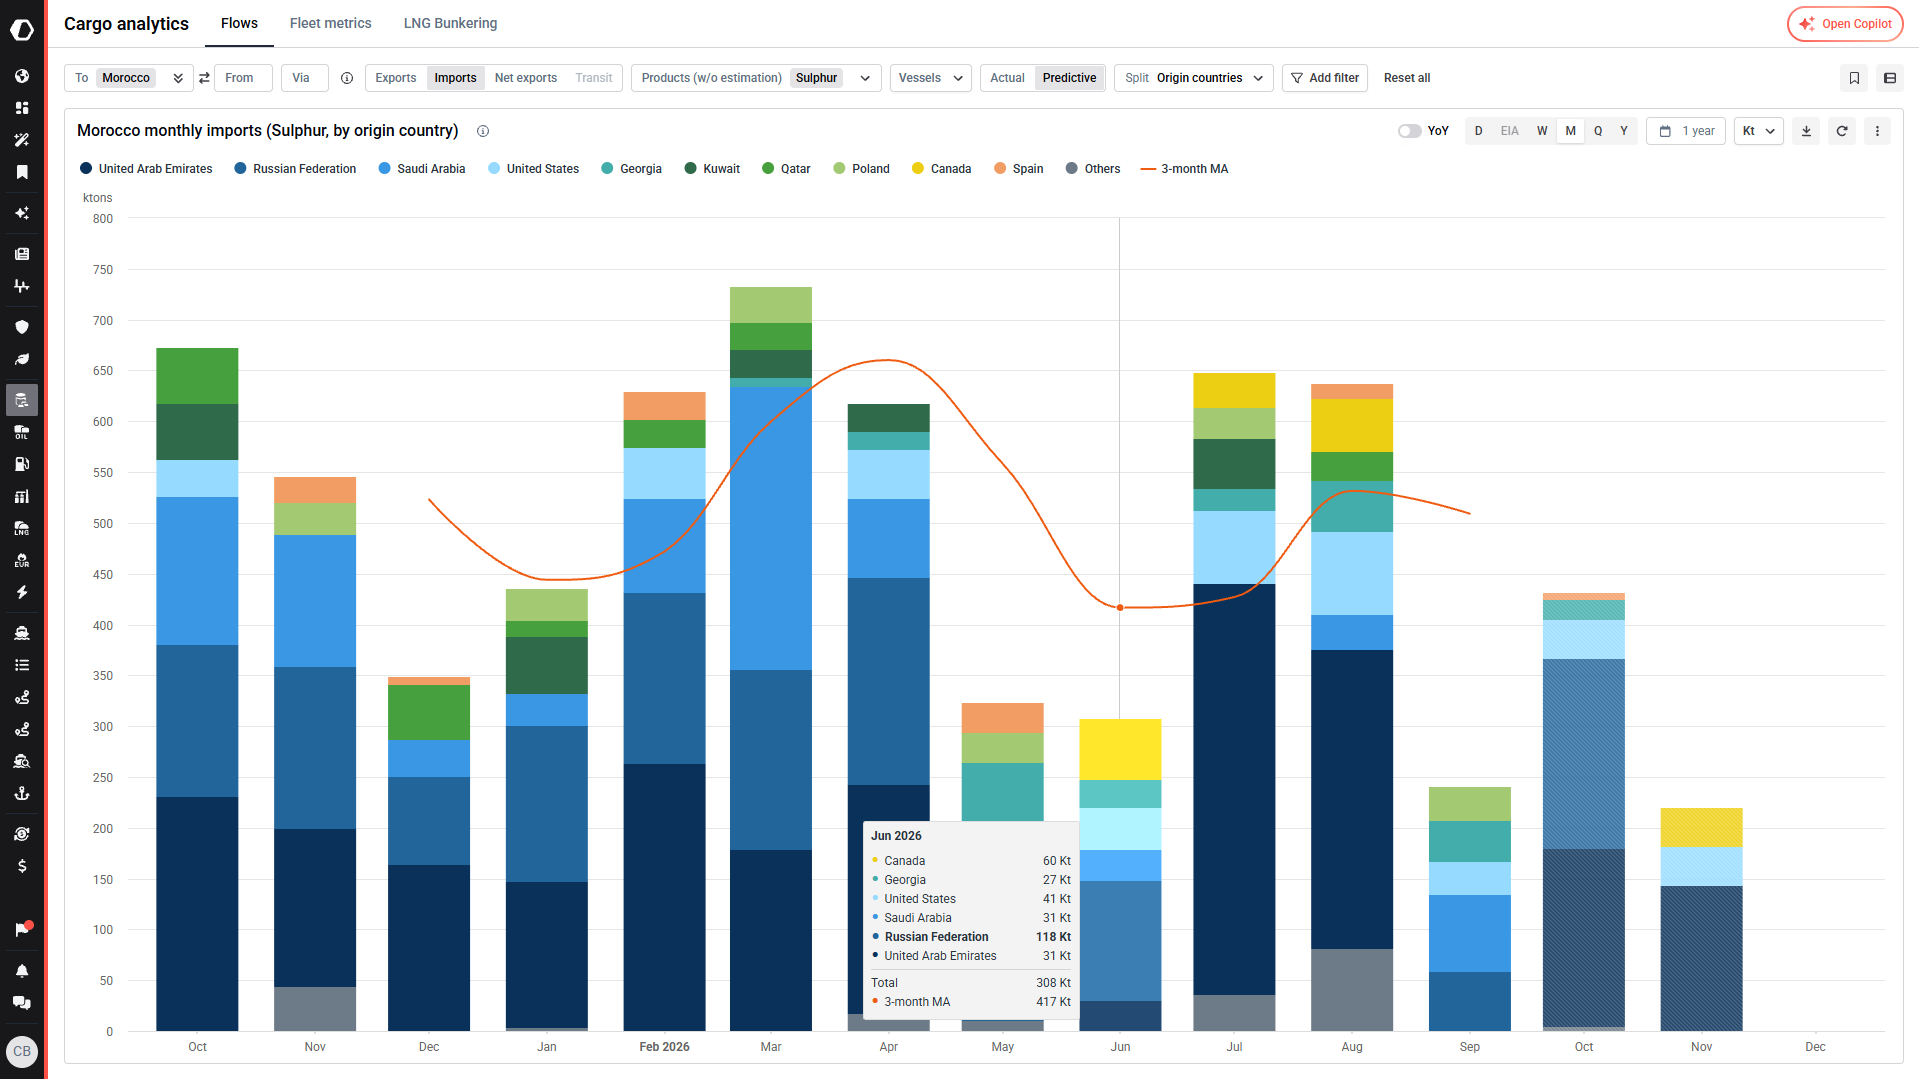
OCP, the main phosphate fertiliser producer in Morocco, brought forward maintenance and cut output by about 30% in the second quarter, and it returned to full output by the end of June. It also shifted towards triple superphosphate, which needs much less sulphur. We can see int he data below that exports dipped in May but were strong in June and September, even though sulphur imports were low. Producers can draw on stocks in the short term, so the pressure is more likely to show in costs and product mix than in volumes.

Indonesian nickel producers cut output as sulphuric acid imports fall
Importantly, sulphuric acid is used to extract metal from ore - as mentioned above - in leaching processes. Sulphur is burned to produce the acid. Countries that are large miners of nickel and cobalt require this sulphur in order to produce metal. Indonesia, a large nickel producer, is also typically a large importer of sulphuric acid for this reason. But the conflict has disrupted its typical flow. Below, we can see that imports fell at the beginning of the conflict and then spiked in July to one-year highs. However, they have fallen to very low levels in recent months.
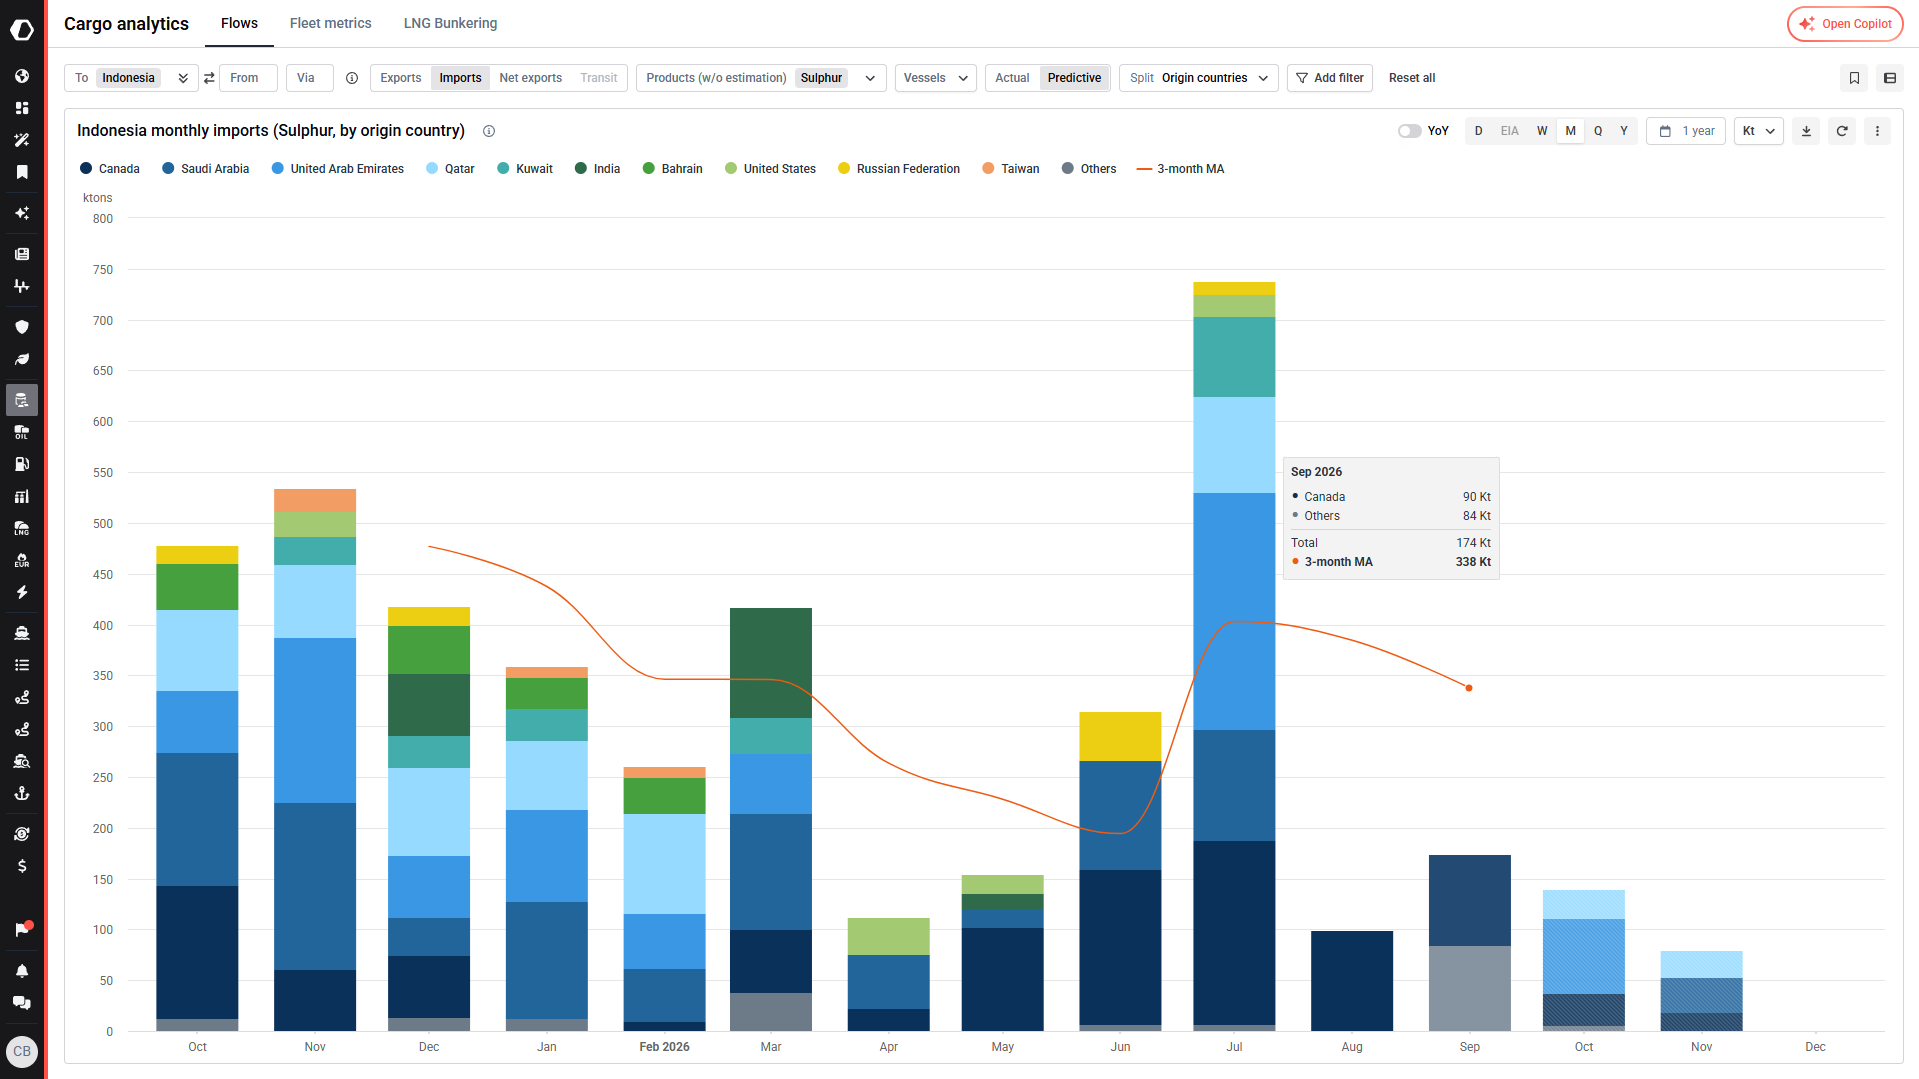
The decrease in imports that Kpler observes matches company reports. Huayou's Indonesian plant has halted production lines from 1 May, reducing capacity by about half, and other producers that rely on leaching processes have cut output. Kpler Insight - its research teams - offer guidance and analysis of pricing for users. Through Kpler Insight, we can identify that prices have traded above $800/t and that the government has cut the 2026 nickel ore quota to between 260 and 270 million wet tonnes from 379 million in 2025, having a big impact on metals markets.
African copper producers keep sulphur imports steady
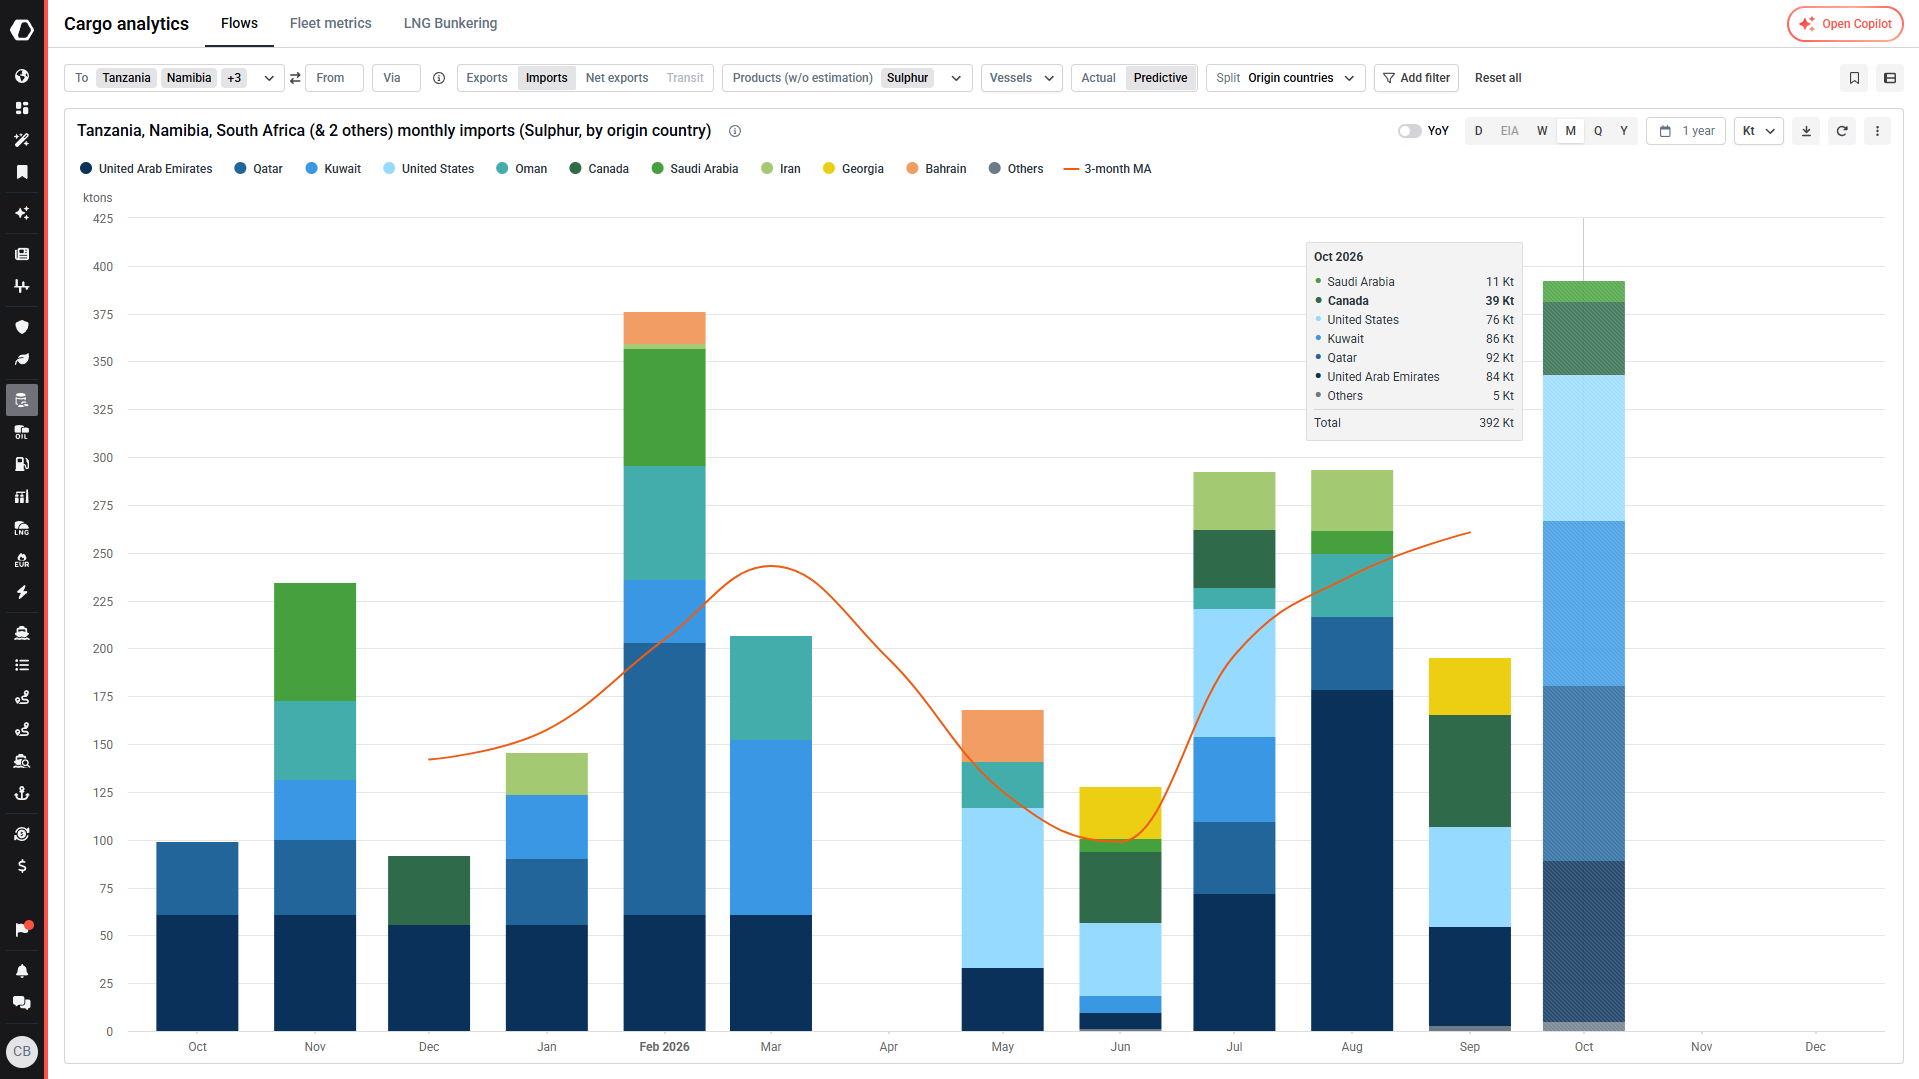
Copper producers, on the other hand, have kept their imports steady. Kpler is able to help identify important data that can be hard to find. Let’s take African copper production as an example. Zambia and the DRC receive sulphur through neighbouring ports. One can use neighboring countries, Tanzania, Namibia, South Africa, Angola, and Mozambique as a proxy for the sulphur that reaches Zambia and DRC operations. We can see in the graph below that imports are gaining pace and reaching pre-war levels.
Sulphur supply outlook: the market remains tight
Sulphur supply is still tight seven months into the war. Hormuz crossings remain well below pre-war levels, the truce in June and July released a backlog of cargo without restoring flows, and exporters elsewhere are restricting sales instead of replacing Gulf volumes. The effect differs by buyer. Copper producers have kept their imports steady, while Indonesian nickel producers have cut their buying sharply. A second backlog of loaded vessels is now building in the Gulf, and few ballast vessels are arriving to load.
Kpler keeps market professionals informed with accurate, real-time data on global trade flows of sulphur and other dry bulk commodities. Along with its team of seasoned market experts, Kpler provides hundreds of organizations with data and analytics that power every day decision making. Reach out to us below to learn more about how Kpler can help your business accelerate its success.

See why the most successful traders and shipping experts use Kpler

Track sulphuric acid flows with Kpler