
European carbon max exposure study
Systematic trend performance at max exposure
Traditional systematic trend following strategies progressively build exposure as a trend develops, adding length as prices move higher or short exposure as prices move lower. Once maximum deployment is reached, the strategy is fully positioned and the focus shifts to managing the trade through its stop logic.
Historically, performance at maximum exposure in EUA has differed significantly by direction:
- 100% long: +19% cumulative P&L
- 100% short: -8% cumulative P&L
Cumulative P&L at maximum exposure: long vs. short
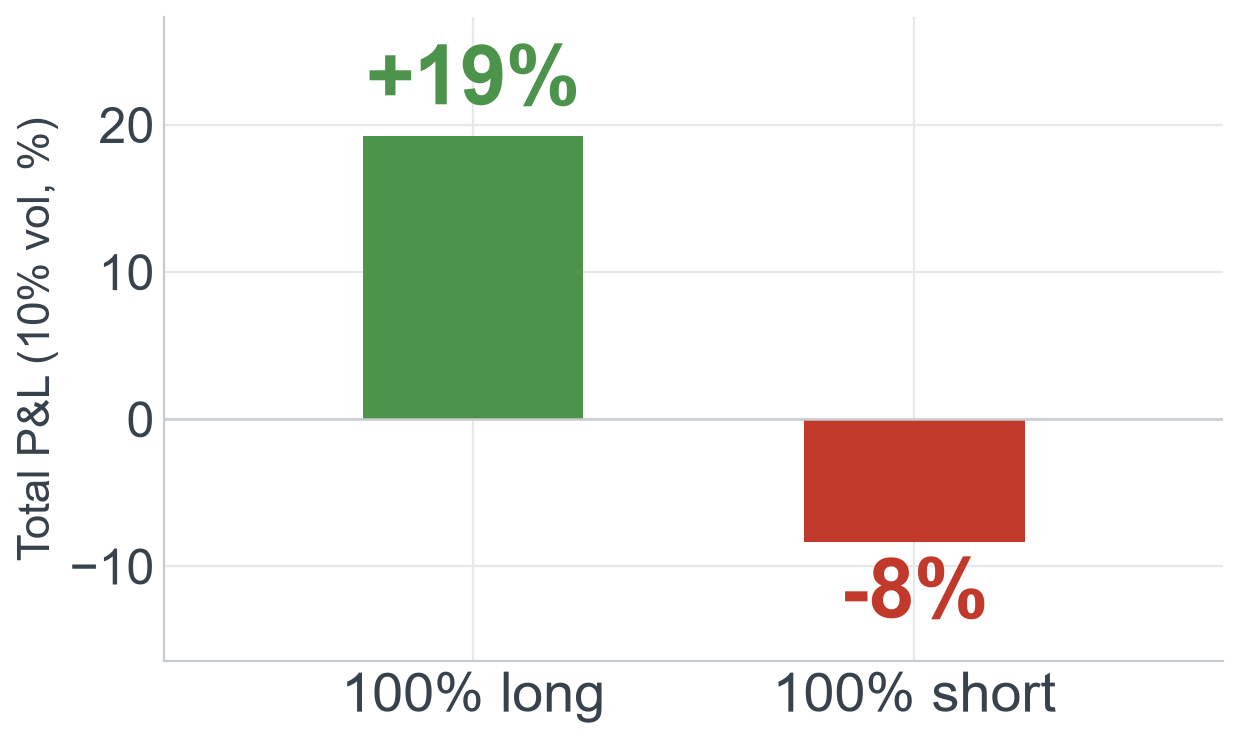
The data shows a clear contrast in EUA performance once the models reach 100% deployment. Fully deployed long positions generated positive P&L overall, while fully deployed short positions lost money. A closer look suggests that this difference is tied to how prices behave after full deployment: upward moves often continue after models reach maximum long exposure, while downward moves tend to be largely exhausted by the time they reach maximum short exposure.
P&L during maximum-short periods: peak vs. realized at full exit
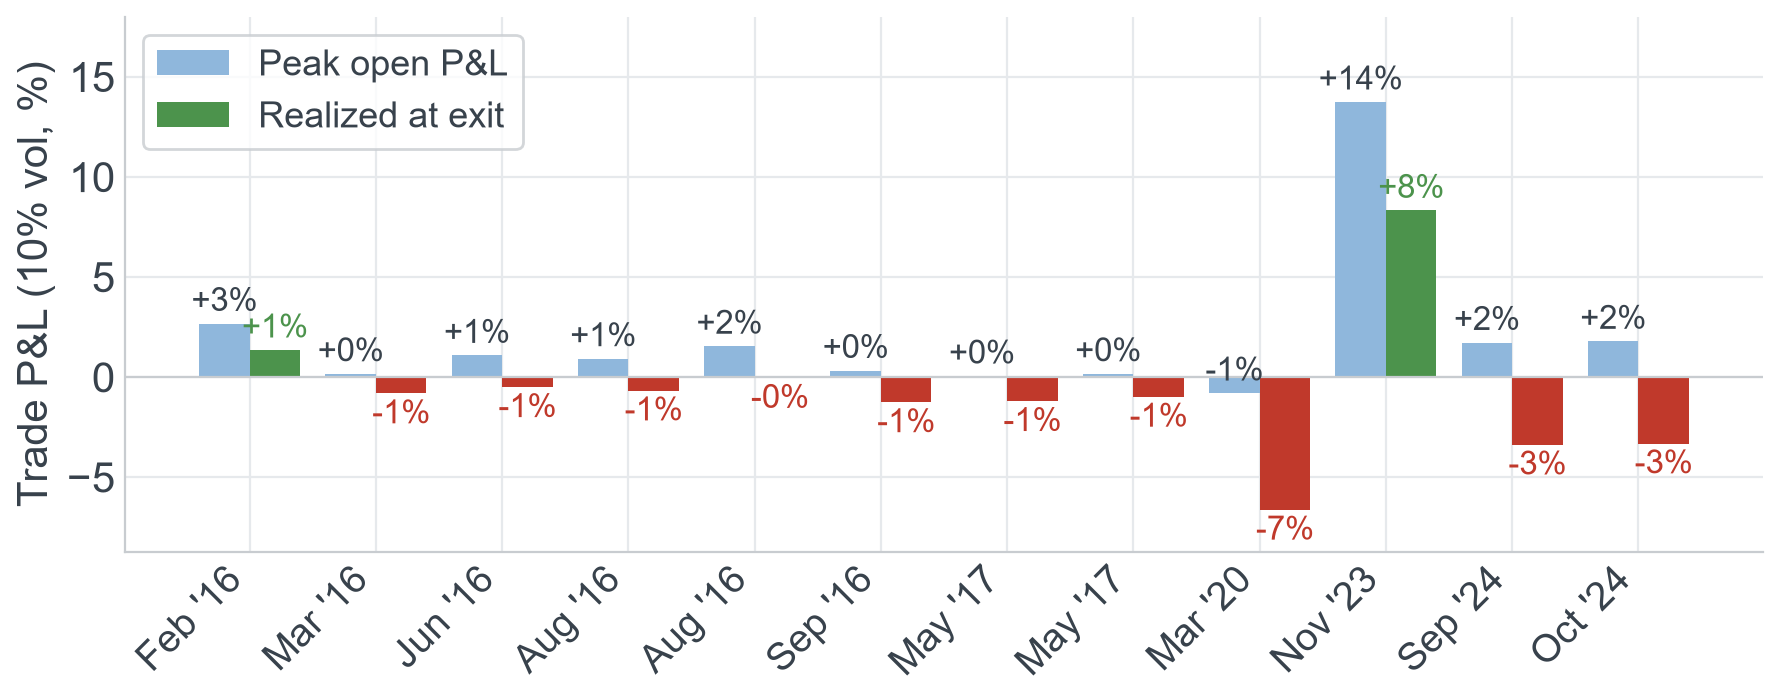
Individual max-short periods reach only small open gains after full deployment, and then give them back. Historically:
- Average peak open P&L: +1.9%
- Average realized P&L at exit: -0.8%
Once the models are fully short, price has rarely continued lower. The position is then held short into carbon's prevailing uptrend, so the modest open gain reverts into a net loss by the time it is cut.
P&L during maximum-long periods: peak vs. realized at full exit
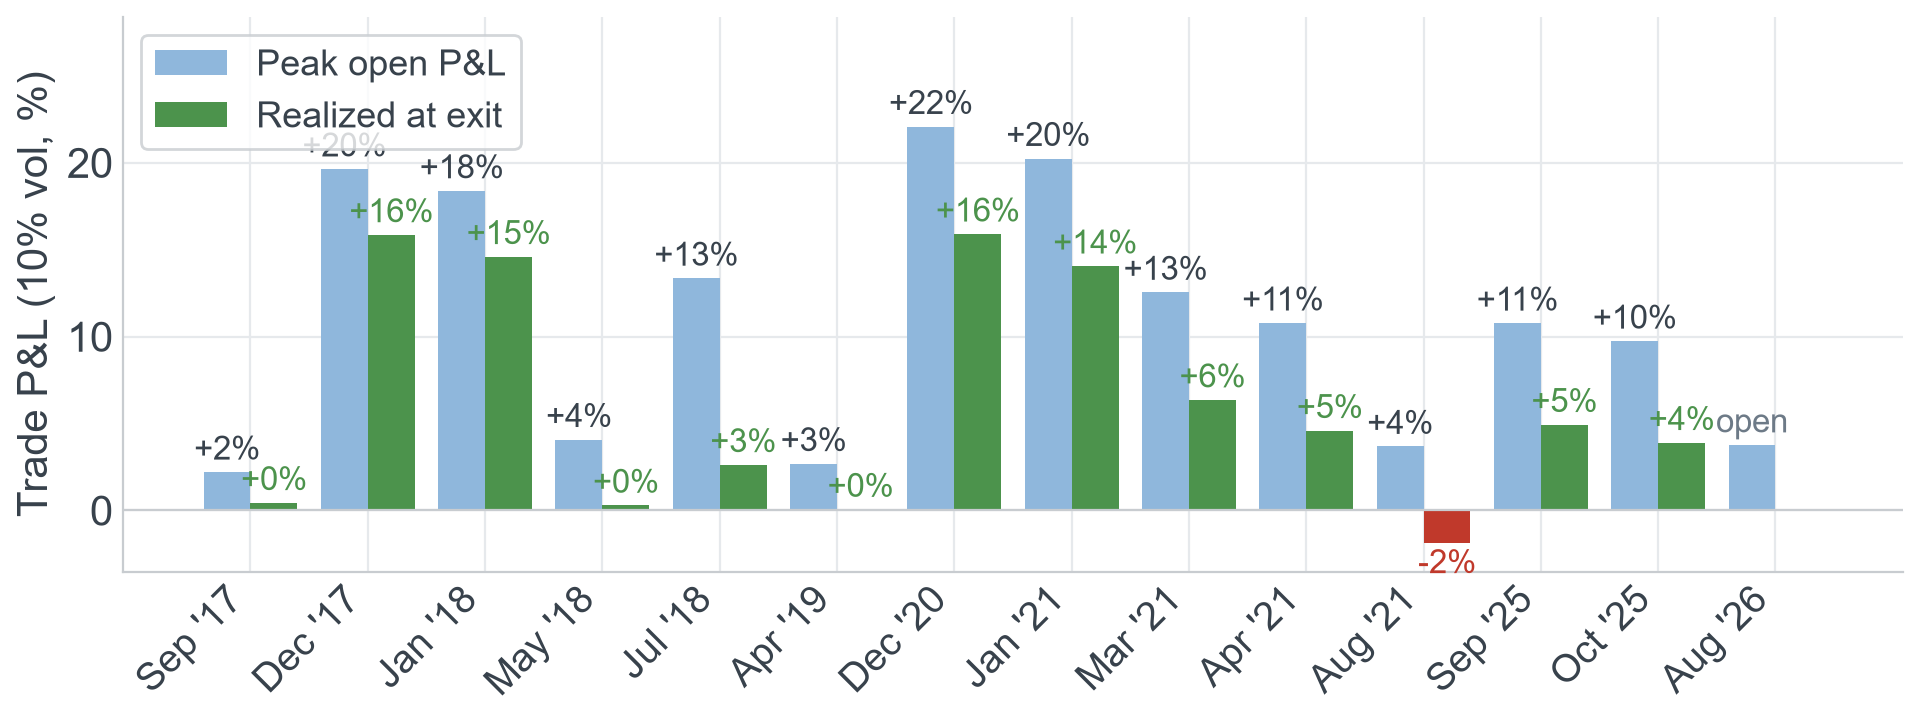
Maximum-Long periods show a materially different pattern:
- Average peak open P&L: +6.2%
- Average realized P&L at exit: +2.2%
Here price keeps running after full deployment, so the open gain builds to a much larger peak. The long gives back a large share of that peak at the exit, keeping only about 35%, but because the underlying price move was so large it still finishes firmly positive.
How much the trend had left at maximum exposure
To see why the peaks differ so sharply, we measure how much price moves in the trade's favour after the models reach full deployment: how much further carbon fell once fully short, and how much further it rose once fully long, as a percentage of the price at that point.
Additional price move after reaching full deployment
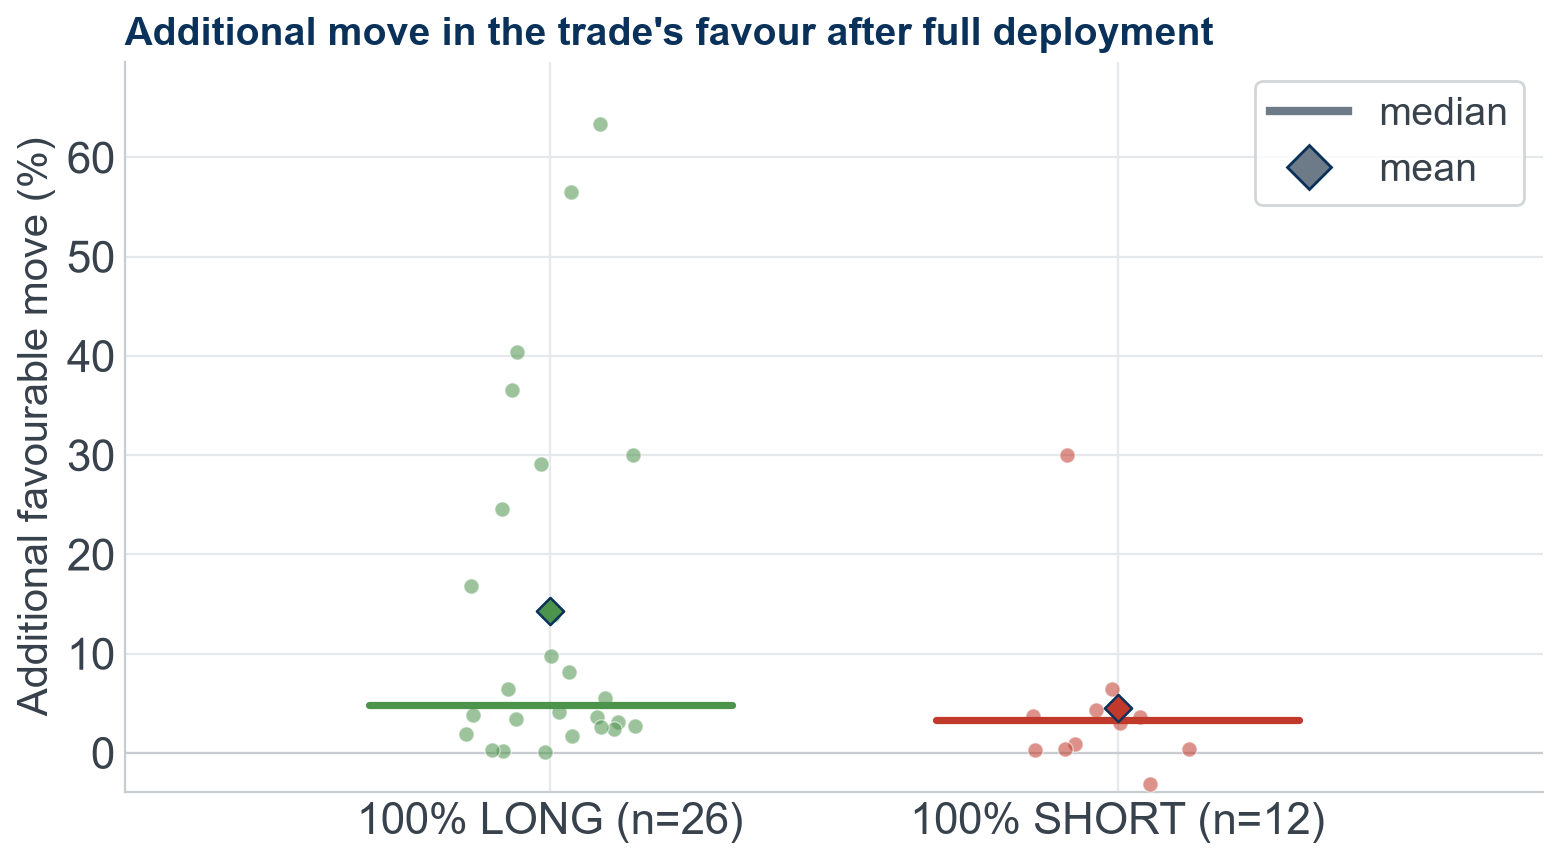
- Median additional move: +4.8% long vs +3.3% short
- Mean additional move: +14.3% long vs +4.5% short
- Large continuations: price ran at least 8% further in 11 of 26 max-long periods, but in only 1 of 12 max-short periods (late 2023)
The data shows a clear difference between long and short performance once the models reach 100% deployment in EUAs. Fully deployed long positions were profitable overall, with prices often continuing to rise after the models reached maximum exposure. On the short side, much of the downward move had already occurred by the time the models were fully deployed, leaving limited opportunity for further gains.
This suggests that the weaker short performance mainly reflects a lack of further price declines, rather than profits being given back while waiting for stops to trigger. Long positions generally benefited from continued price momentum after full deployment, while short positions tended to reach that point as the move was running out of steam.
Current EUA trend positioning
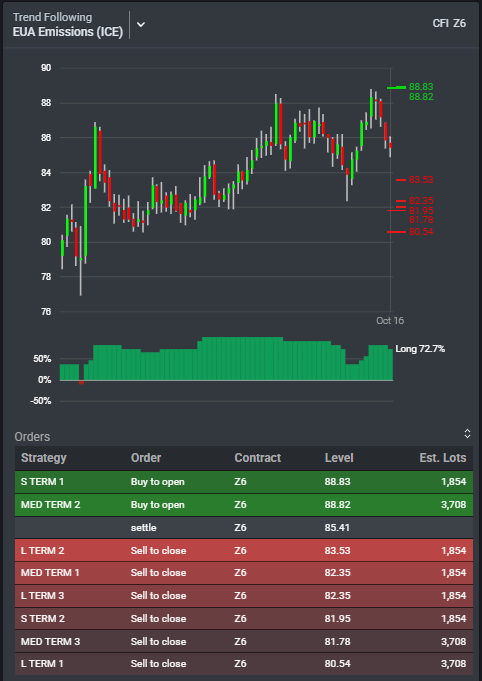
EUA is currently positioned long (73% deployed, around €85/tonne as of Oct 19 2026). This is the side that has historically had the most room left to run after maximum exposure. Any single long exit still gives back part of its open gain, but the long side has been the one where carbon's price move continued, rather than the one where price was already exhausted.
Kpler Financial Flows (formerly Bridgeton Research Group), quantifies where algorithmic trading flows may accelerate or unwind, with multi asset coverage across agriculture, energy, metals, power, gas, softs and financials.
- Data back to 2014
- 400+ Market tickers
- 0.9+ Correlation to key benchmarks

See why the most successful traders and shipping experts use Kpler
Algorithmic trading behavior insights