What port calls reveal about the LNG fleet
The transition to alternative marine fuels is usually measured by fleet orderbooks and annual bunker volumes, showing what's been built and how much fuel delivered. But a less visible question sits between them: where are LNG-capable vessels actually becoming part of routine port activity?
Fleet presence isn't even. A ship built for LNG may spend years on routes where it's unavailable or uneconomic. A port may install bunkering capacity and see little recurring demand. Others attract a growing, varied population of LNG-capable ships before the wider market notices.
Barcelona shows this shift in layers, not a single milestone:
- Cruise ships and ferries returning on regular schedules
- Container vessels entering long-haul services
- Car carriers beginning to bunker
- A supply system moving from occasional operations to an established pattern
Together, these show a fuel transition becoming embedded in an operating network, not just a collection of announcements.
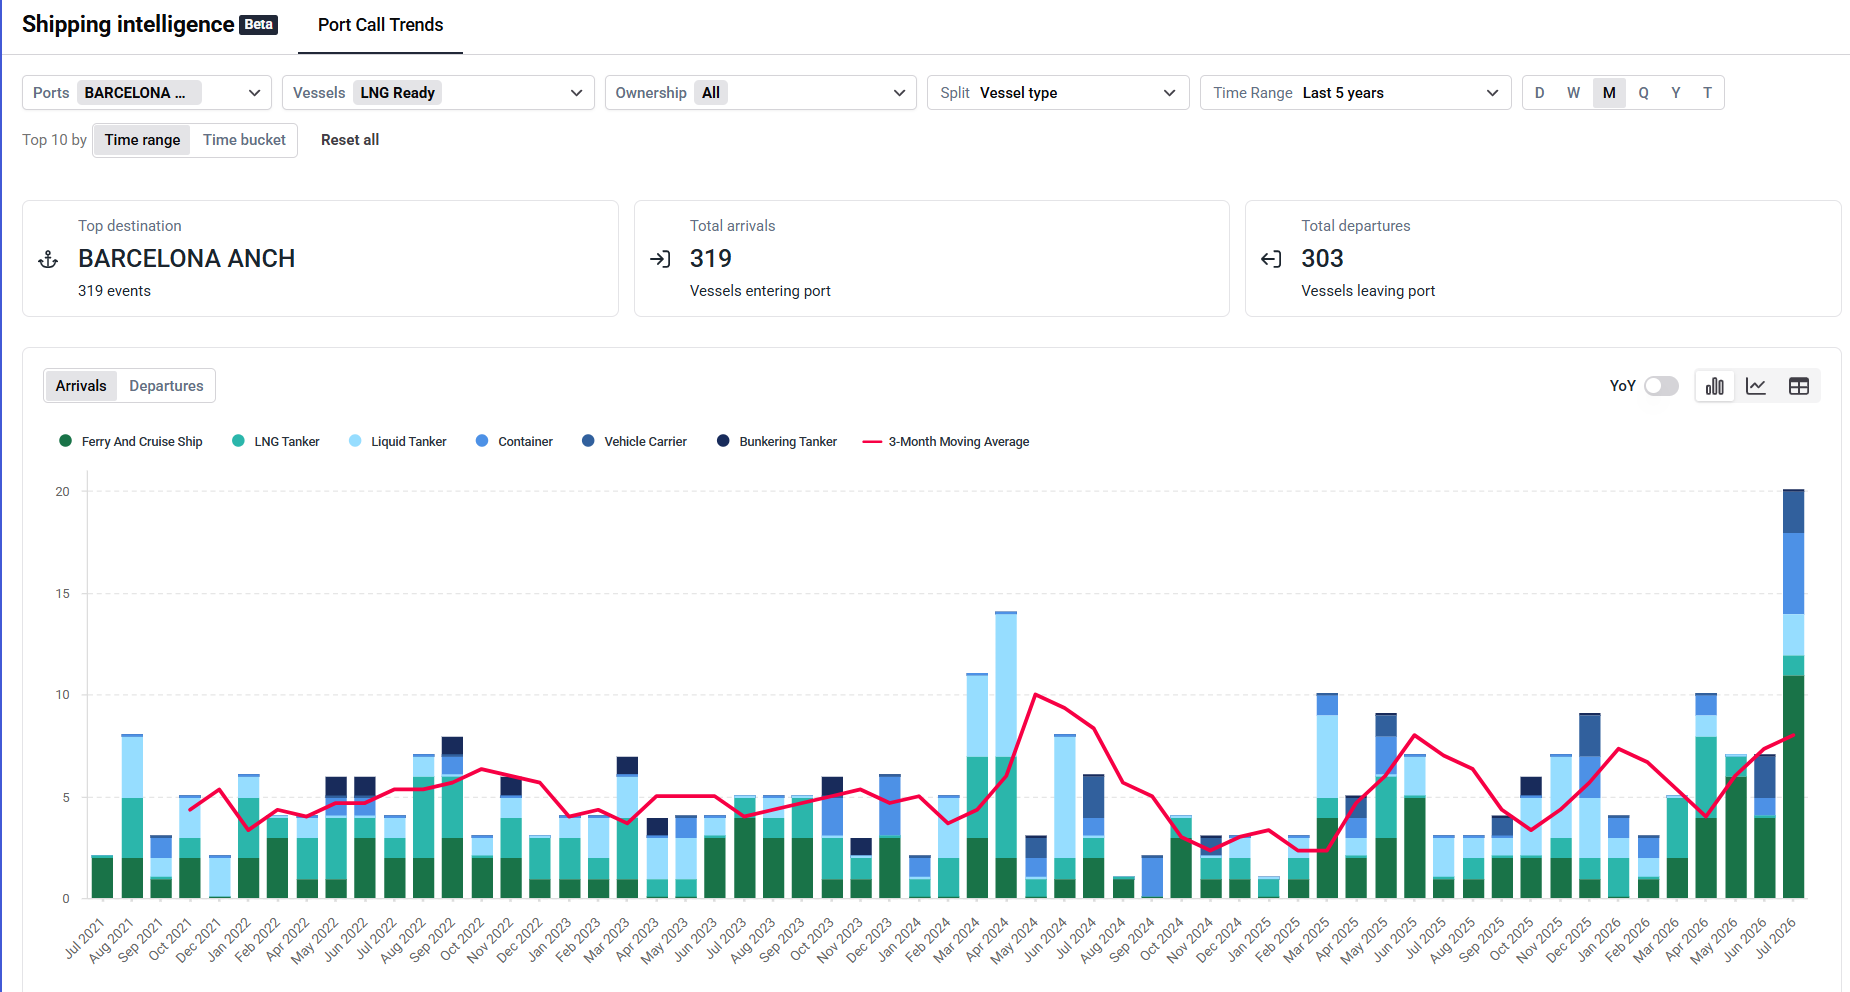
From demonstration to recurring port call data
The Port Call Trends chart shows Barcelona was bunkering LNG well before this acceleration. In 2019, the port completed 18 ship-to-ship operations, supplying about 37,200 cubic metres — proof the service worked, but on a market too narrow to be routine.
By 2023, the picture had changed. The Port of Barcelona reported:
- 618 calls by LNG-powered vessels, twice 2022's figure and roughly 7% of all vessel calls that year
- 199 LNG bunkering operations completed
- Approximately 143,000 cubic metres of LNG supplied
The port highlighted regular calls from major LNG-powered vessels, including the 400-metre CMA CGM Palais Royal, which made its first call at the BEST container terminal in December 2023.
The significance here lies less in any single total than in the recurrence. Six hundred-plus calls can't be explained by a trial, a publicity event, or a few repositioning voyages — LNG-powered ships were appearing repeatedly across the year, and the port was becoming part of their normal service pattern.
2024 reinforced that shift. Barcelona reported:
- 229,751 cubic metres of LNG supplied, up 60.5% on 2023
- 822 LNG-powered vessel calls, close to one in ten of all calls at the port
- Five car carriers receiving LNG across ten bunkering operations
- The dual-fuel fast ferry Margarita Salas entering service between Barcelona and the Balearic Islands
Cruise ships and ferries still mattered, but the operating base was no longer confined to one or two segments.
This progression is what turns a fuel story into a deployment story: not just more LNG delivered, but more LNG-capable vessels returning, more vessel types participating, and infrastructure used across a wider set of commercial services.
What annual fuel figures leave unresolved
Annual bunker volumes are essential for measuring realised demand — they show how much LNG was supplied and, where tracked, how. Barcelona's 2024 figures split 45,427 cubic metres delivered by tanker truck from 184,324 by barge, showing the scale and maturity of the supply operation.
But volume totals don't describe the fleet behind them. A few large deliveries can generate substantial volume, while many smaller calls may signal a more diverse fleet. Two ports can report similar annual volumes while sitting in very different positions in the network — one serving a concentrated group of deep-sea vessels, the other supporting ferries, cruise ships, car carriers and liner services at different frequencies.
The same limit applies to bunkering events themselves: confirmed deliveries show where LNG was supplied, not every call by an LNG-capable vessel, since some call without bunkering. Those calls still matter — they show where the capable fleet operates and how often it returns.
This is the extra perspective port-call history provides. Instead of treating each bunkering operation as an isolated transaction, it lets analysts examine the vessel population around it:
- Is the port attracting more LNG-capable ships over time?
- Are calls becoming more regular?
- Is growth concentrated in one segment, or spreading into others?
- Are the same operators returning, or is the market broadening?
Barcelona's public figures already point to a widening base. The rise from 618 calls in 2023 to 822 in 2024 came with new services and vessel categories entering the mix. A trend view built from MarineTraffic port-call history places those milestones in a continuous series, showing whether the change built steadily, arrived in steps, or was driven by seasonal peaks.
The difference between a capable fleet and a fuel market
A vessel's technical capability and its fuel use are related but not interchangeable. Dual-fuel vessels switch between LNG and conventional fuel depending on price, availability, contracts and voyage economics. An LNG-capable vessel calling at Barcelona is evidence of deployment, not proof LNG was consumed that call.
That distinction doesn't weaken the signal — it changes the question being answered. Fuel transaction data measures realised consumption; port-call history shows the network where future consumption could occur, revealing the population passing through a port even when only part of it currently bunkers there.
Kpler's analysis of the global LNG bunkering market shows why this matters. Reviewing 500+ dual-fuel vessels across 2024-2025, it found actual LNG demand was only about 35% of the fleet's theoretical potential — passenger vessels used a much higher share, while many container ships and tankers ran conventional fuel for large portions of their voyages, a gap driven by economics and bunkering infrastructure as much as vessel availability.
A port-call trend can't predict how much latent demand converts to consumption, but it shows where the relevant vessels already operate — useful when the market moves faster than annual reports. A port may see LNG-capable calls concentrate before bunker volumes rise: no guarantee of future demand, but evidence the conditions are forming.
Barcelona fits this pattern. Supply volumes rose strongly, but the deeper story is capable vessels integrating into regular services: ferry schedules create repeated demand, cruise itineraries bring large ships back seasonally, container services link the port to long-haul networks, and car-carrier bunkering, introduced in 2024, adds a segment with its own routes and fuel needs.
Seeing the shape of adoption in port call performance
The most revealing feature of a deployment trend is its shape. A sudden spike may reflect a temporary schedule change or one large service launching. A gradual rise over several years suggests something different: more vessels entering service, more operators adopting the technology, more routes becoming compatible.
Seasonality changes the read too. Barcelona's cruise activity naturally rises and falls — if LNG-capable calls spike only in summer, the demand profile is uneven even if the market is substantial. Ferry and liner services create a steadier pattern, and car carriers add another layer tied to vehicle trade flows.
A historical view separates these effects without cataloguing every movement. The point is identifying whether the capable fleet is becoming more frequent, diverse and persistent — not reproducing every fluctuation. Barcelona's shift from 7% of all calls in 2023 to almost 10% in 2024 shows LNG-powered vessels weren't just growing in absolute terms, but taking a larger share of overall traffic.
New vessel segments reinforce that. Car carriers bunkering for the first time in 2024 shows adoption moving beyond the cruise and ferry base. The Margarita Salas adds a recurring high-speed passenger service; CMA CGM Palais Royal places Barcelona inside the network of one of the world's largest LNG-powered container ships. Each event matters alone, but together they show the port serving a broader range of vessels shaped by different markets.
This is the kind of change traditional reporting struggles to capture. News stories focus on firsts and records. Annual statistics compress a year into one total. Fleet databases show which vessels exist, not how their port presence evolves. A port-call trend connects those fragments into a timeline.
Why the port network matters
No vessel operates in one port alone. LNG adoption depends on a network of locations where ships can bunker, call reliably and maintain commercially viable schedules. A strong position at Barcelona therefore carries meaning beyond the port boundary — it places Barcelona within Mediterranean and European service patterns that include other bunkering hubs, destination ports and turnaround locations.
The growth of LNG-capable calls can help reveal how that network is taking shape. If the same vessel classes appear more frequently at several ports along a service corridor, that points to deeper fleet integration. If one port's activity rises while nearby locations stay flat, the difference may reflect infrastructure, supplier availability, berth compatibility, pricing, or the routing decisions of a small number of operators.
This is where a port-level trend becomes more than a local traffic count. It can show whether adoption is concentrated or distributed, whether a port is becoming a recurring node in a wider network, and whether new vessel segments are extending the market beyond its original base.
Barcelona's reported activity already shows several layers of that network effect:
- Cruise ships connect it to Mediterranean itineraries;
- Ferries link it to the Balearic Islands and other regional destinations;
- Container ships place it within global liner loops;
- Car carriers connect it to vehicle logistics chains;
- Barcelona's LNG market is therefore not one market, but an intersection of several operating systems, each with its own cadence and commercial drivers.
A more complete reading using port call data
The maritime fuel transition won't be understood through one dataset. For example:
- Orderbooks show the fleet that may enter service.
- Technical specifications identify what those vessels can use.
- Bunkering records and fuel volumes show realised demand.
- Port-call history shows where the capable fleet is actually operating and whether its presence is becoming established.
Barcelona shows why that layer deserves attention. Between 2019 and 2024, the port moved from a handful of ship-to-ship operations to over eight hundred annual calls by LNG-powered vessels and record supply volumes, with wider participation across cruise, ferry, container and car-carrier segments. That's not infrastructure waiting for demand — it's a port becoming embedded in the operating geography of an alternative-fuel fleet.
A rising number of LNG-capable calls doesn't prove every vessel bunkered, nor guarantee demand follows a straight line. Fuel economics can shift, regulations change incentives, and operators can redistribute activity between ports.
Yet that uncertainty makes the deployment view more useful, not less — it's why analysts need to see how the fleet behaves, not just rely on plans or annual totals. A recurring port presence is one of the clearest signs a technical capability is becoming commercial practice.
In Barcelona, that shift shows in the move from isolated operations to repeated calls, from a limited set of users to a broader vessel mix, and from proof of feasibility to routine activity. Fuel volumes confirm LNG is being consumed; the port-call pattern shows the market around that consumption taking shape.

See why the most successful traders and shipping experts use Kpler
The leading indicator for trade and supply
.jpeg)