

Why the carrier with the shortest terminal wait isn’t always the fastest option
Peak season volume has to land somewhere. The usual inputs to that decision are cost, space, and a general sense of which carrier “runs well” on a given route. Reliability gets discussed, but rarely checked against anything concrete, because container terminal performance data has not been easily compiled across carriers at the same set of ports.
Here’s what happens once it is.
The questions behind every port congestion decision
A BCO deciding which carrier should absorb extra peak season volume is asking two distinct questions at once.
- How often is this carrier delayed getting into berth at the ports I care about?
- Once it’s alongside, how long does it take before the vessel sails again?
Most routing conversations only ever look at the first question, usually filtered through reputation rather than a number. The second question barely surfaces at all, even though it matters just as much for container shipping schedule reliability.
An example in Terminal Activity
Using the Terminal Activity workspace in Container Intelligence, we can take four carrier groups calling San Pedro, Seattle, and Tacoma on vessels above 5,000 TEU, benchmarked against each other from January through September 2026:
- MSC
- CMA CGM
- China COSCO Shipping
- Hapag-Lloyd
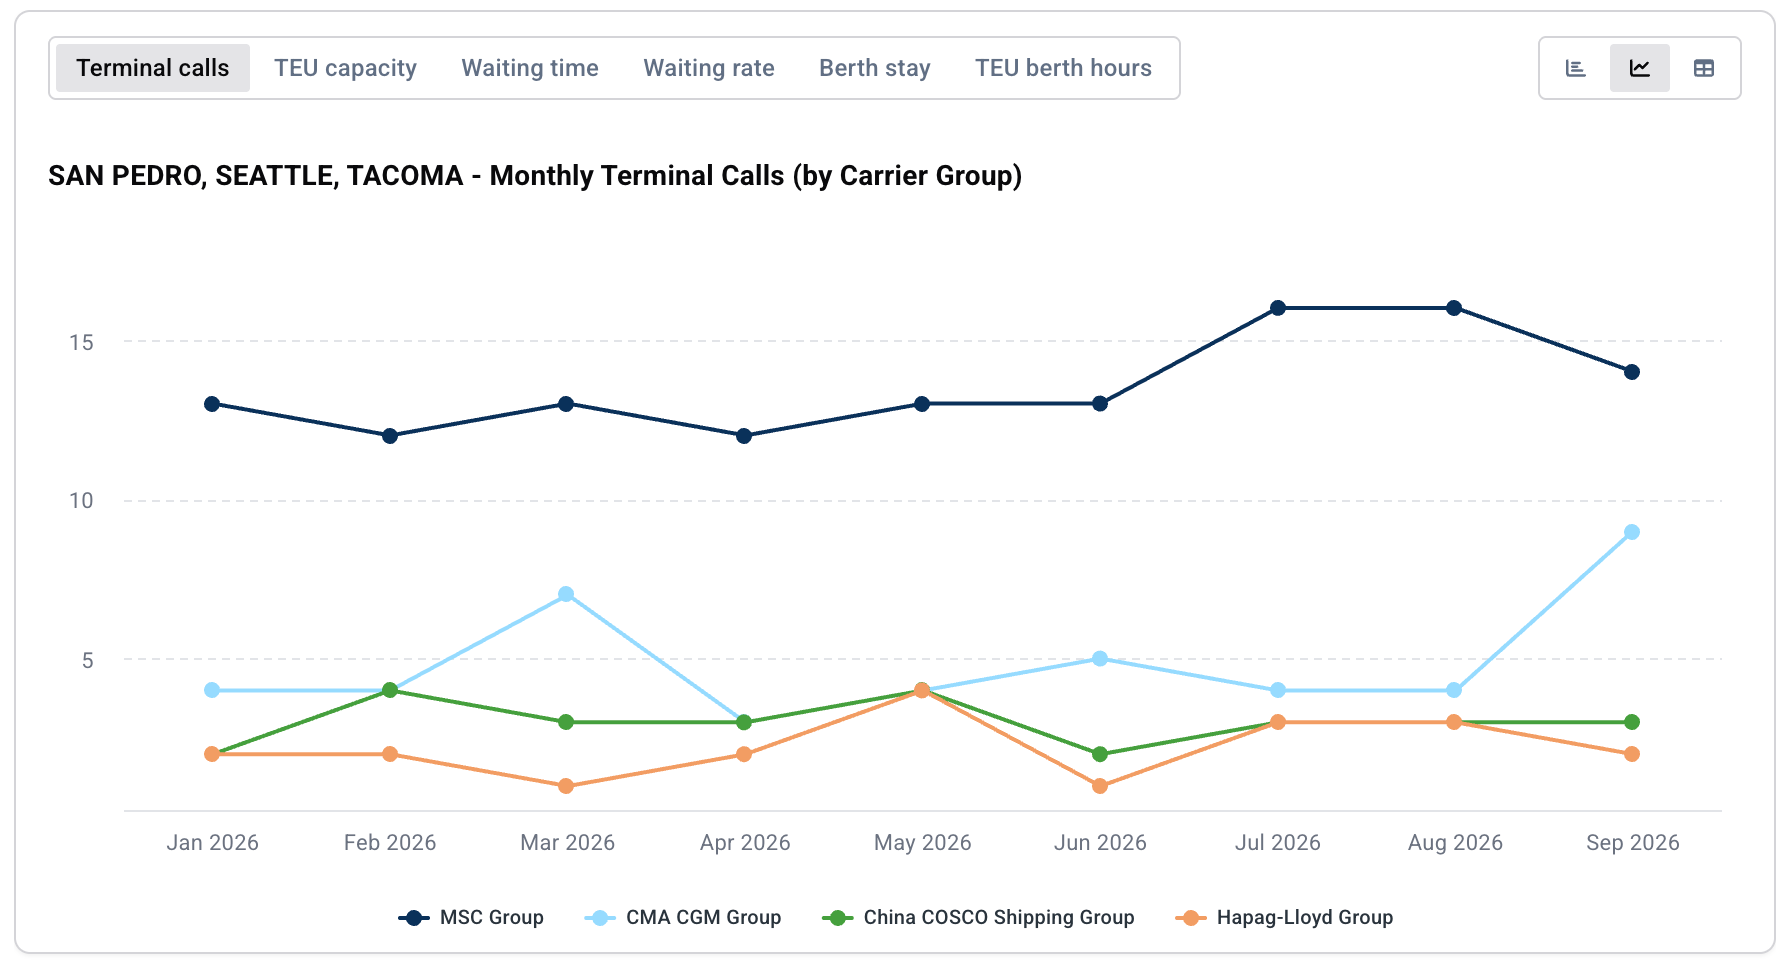
MSC is the dominant carrier at these ports by volume, with 122 terminal calls across the period, more than the other three carrier groups combined. CMA CGM runs 44 calls, China COSCO Shipping 27, and Hapag-Lloyd the fewest at 20.
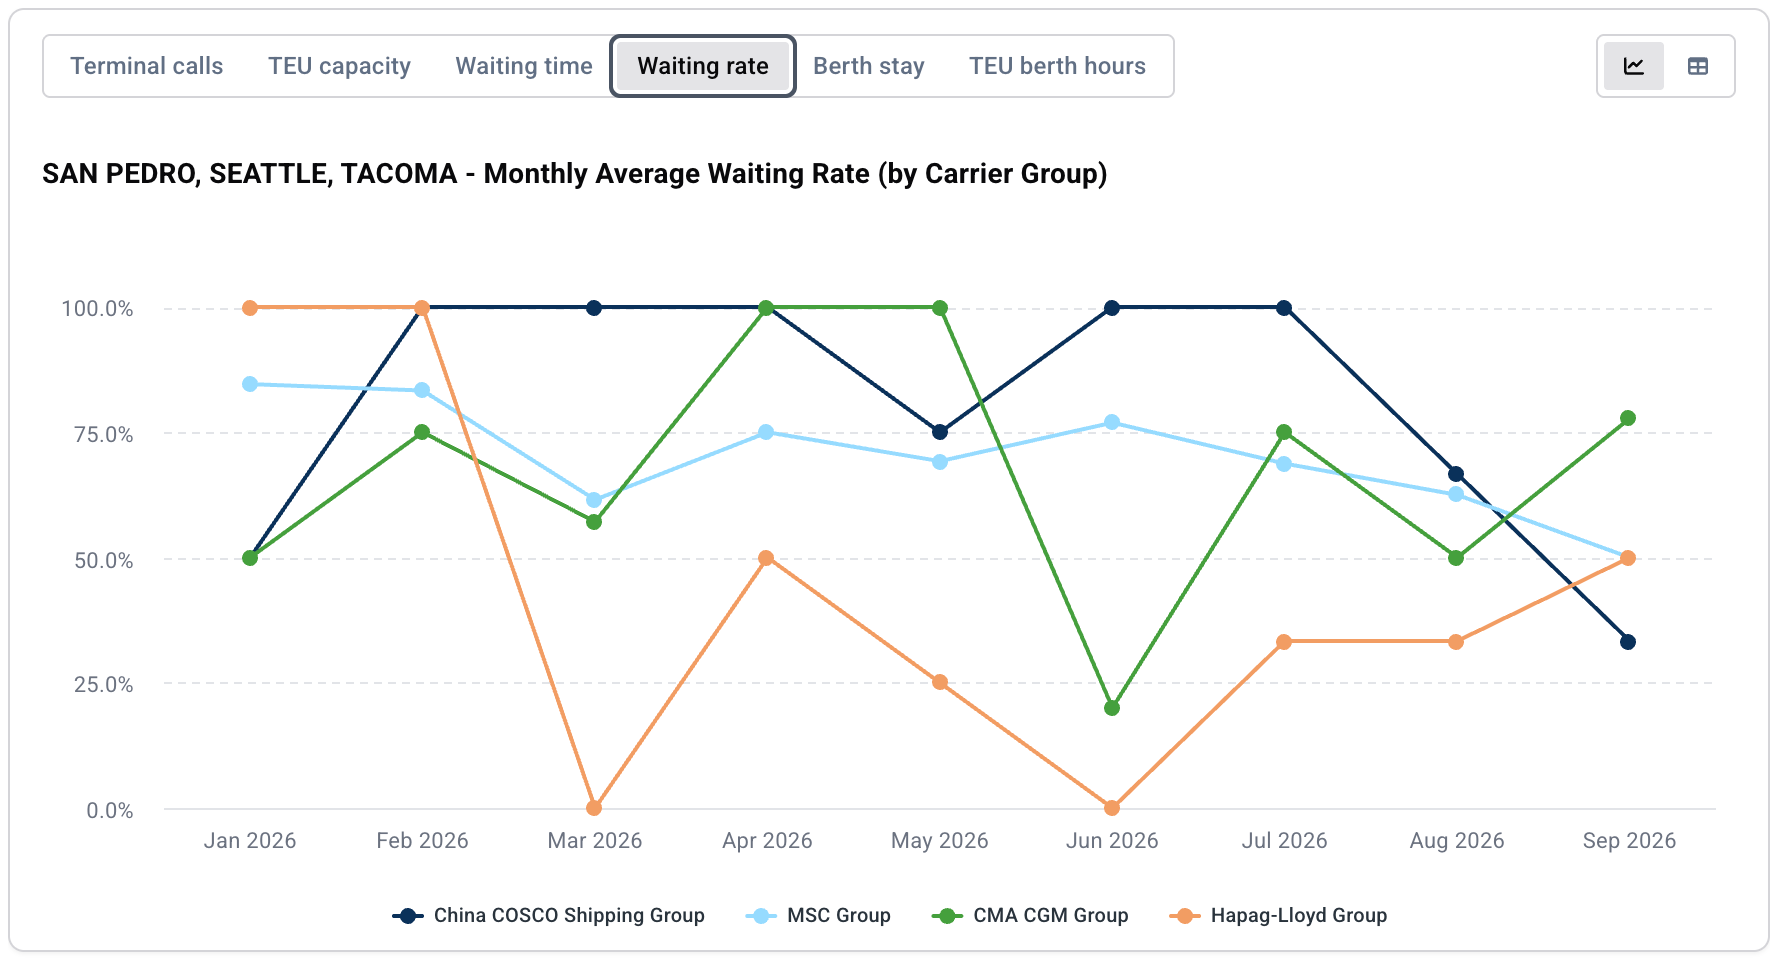
Looking at waiting rate alone, Hapag-Lloyd looks like the standout for the share of calls that experienced any wait at all. It averages 43.5% across the nine months, well below the other three. China COSCO Shipping sits at the other end, averaging 80.6%, the highest of the group. MSC and CMA CGM land in between, at 70.2% and 67.2%.
Average waiting time per call tells a similar story on the surface. Hapag-Lloyd averages just 3.3 hours of waiting per call across the period, the lowest of the four. China COSCO Shipping averages 6.4 hours, CMA CGM 8.3 hours, and MSC the highest at 13.0 hours.
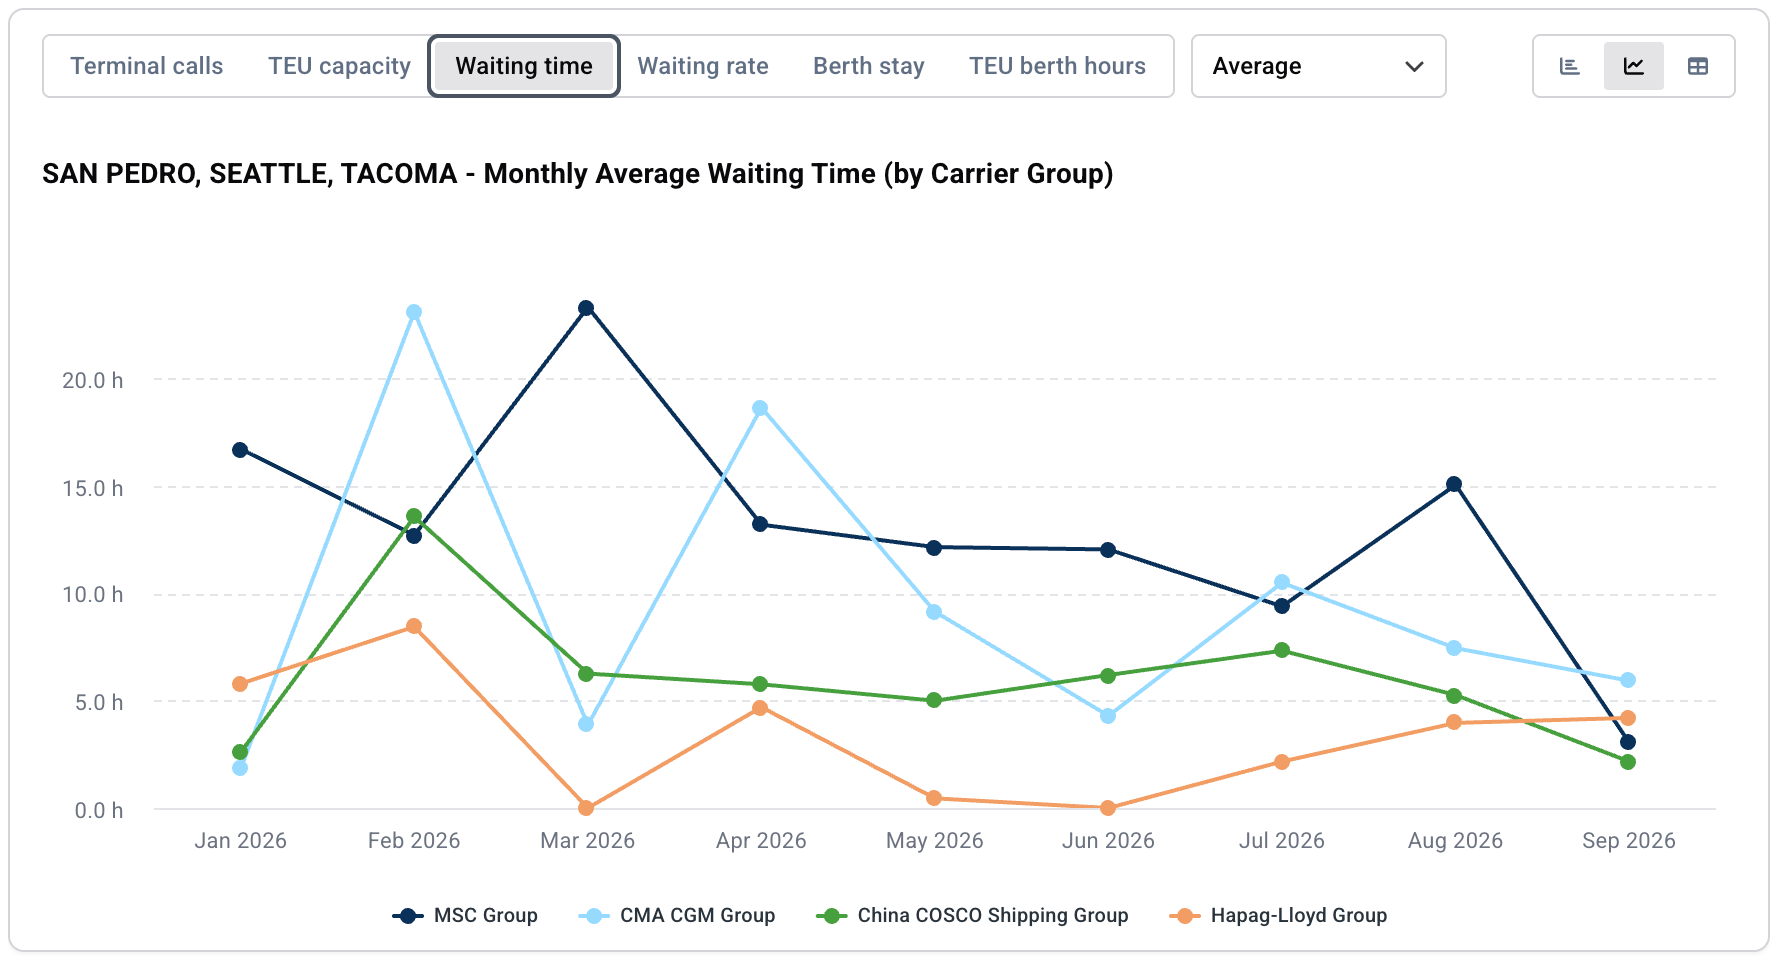
On those two metrics alone, Hapag-Lloyd reads as the carrier least likely to sit waiting for a berth at these ports. While a useful finding, it’s not the whole picture of container port performance at these three gateways.
The port call figures that change the answer
Waiting rate and waiting time only measure one part of a vessel’s time at port, the part before it reaches berth. What happens once it’s alongside is a separate question, and it’s where the picture flips.
Hapag-Lloyd’s average berth stay across the nine months runs to 112.8 hours. It shows up consistently, every month from January through September, running noticeably longer than any of the other three carrier groups, which range from roughly 36 to 62 hours on average.
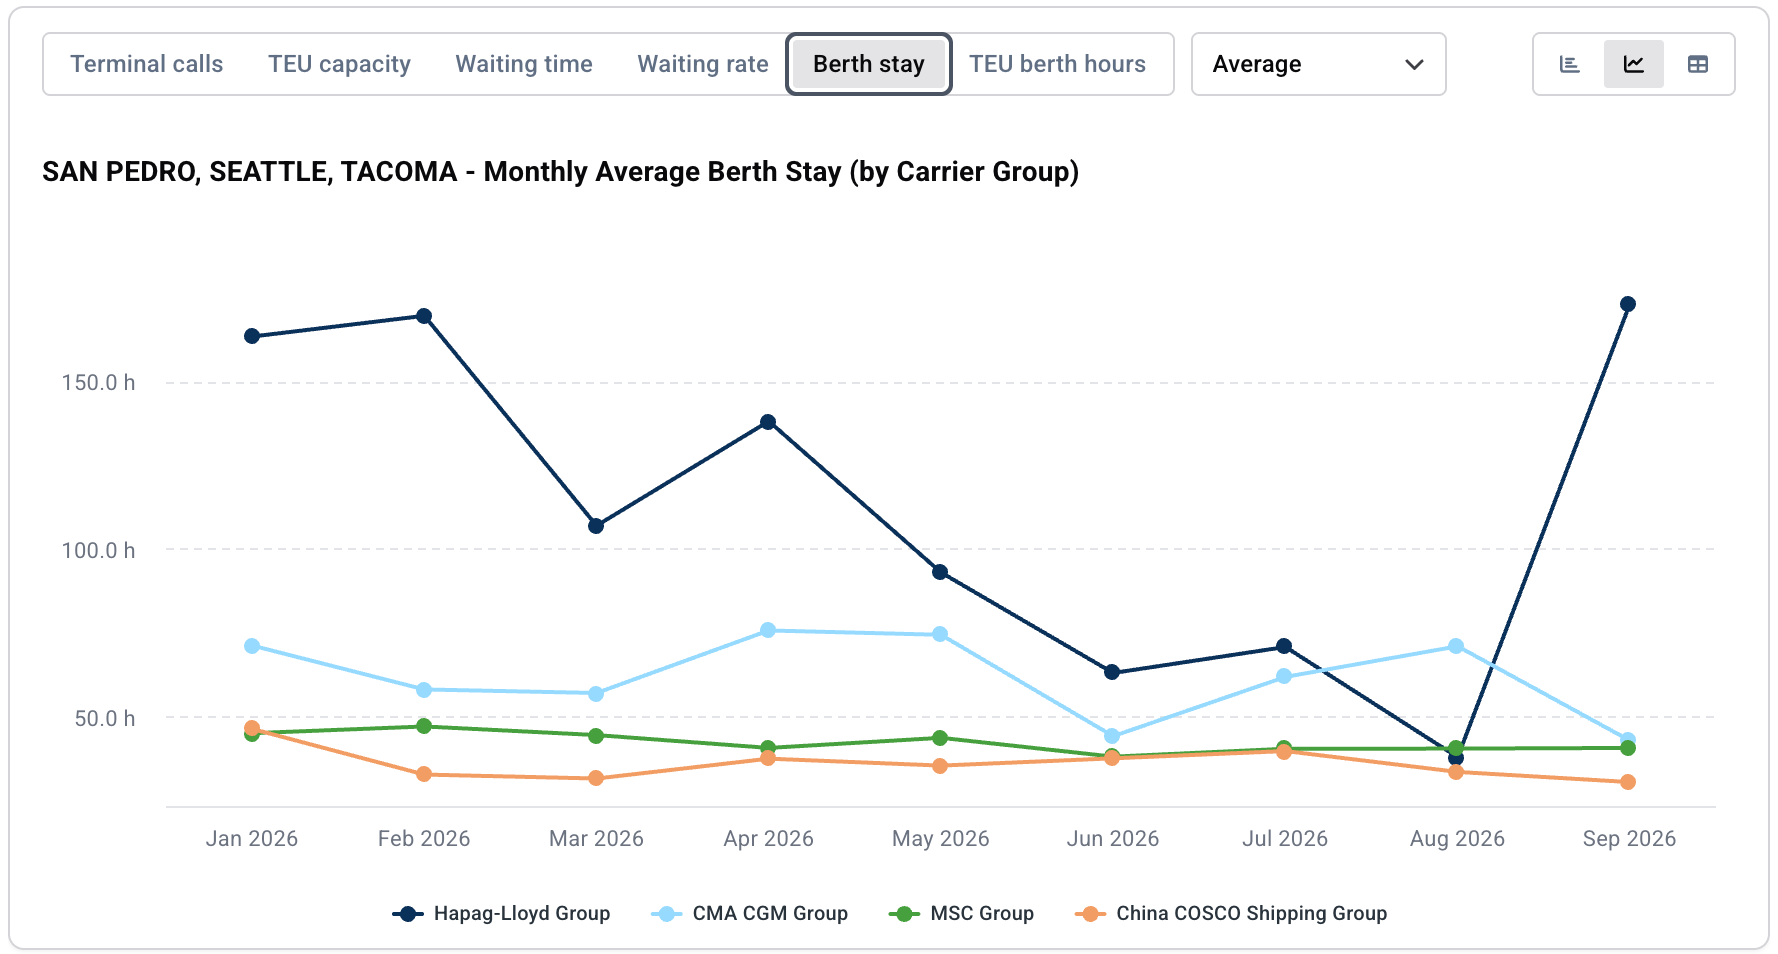
Put the two halves of the port call together, the wait to get to berth and the stay once there, and the ranking that looked settled a moment ago reverses. This is container terminal benchmarking at its most useful, two metrics that individually point one way and combine to point the other:
- Hapag-Lloyd: 3.3 hours waiting plus 112.8 hours at berth, a total of roughly 116 hours per call.
- CMA CGM: 8.3 hours waiting plus 61.7 hours at berth, roughly 70 hours per call.
- MSC: 13.0 hours waiting plus 42.1 hours at berth, roughly 55 hours per call.
- China COSCO Shipping: 6.4 hours waiting plus 35.9 hours at berth, roughly 42 hours per call, the shortest total of the four.
The carrier with the best waiting numbers has, by a wide margin, the longest total time in port once berth stay is counted. The carrier with the worst waiting rate, China COSCO Shipping, where 8 in 10 calls experience some wait, comes out with the shortest combined cycle, because both its waits and its berth stays run short.
None of that is a claim about why Hapag-Lloyd’s berth stays run long, whether it’s vessel size, cargo mix, terminal handling priority, or something else entirely. The data doesn’t say. It does however show that a carrier can look clearly best on one measure of container terminal performance and clearly worst on another, and a routing decision made on only one of those measures would have missed the part that matters for schedule reliability.
The call volume caveat
Call volume differs a lot across these four carrier groups, and that matters for how much weight any single month’s number should carry in a container terminal benchmarking exercise.
In some months, Hapag-Lloyd’s call count drops to just one. A one-call month that happens to post a 0% waiting rate, as Hapag-Lloyd does in March and June, is a real data point, but it’s not the same kind of evidence as MSC’s waiting rate in the same month, built from 13 calls. The nine-month average smooths this out somewhat, but a BCO using this data to shape an actual peak season decision should look at the call volume behind each number, not just the number itself.
What this changes about the port routing decision
A routing decision made on waiting rate or waiting time alone would have pointed toward Hapag-Lloyd. A decision made on total time in port, which is arguably the number that determines container shipping schedule reliability, points toward China COSCO Shipping instead, at least across this period and this set of ports.
That’s not a recommendation to pick one carrier over another in general. It’s a demonstration of why the question “which carrier should absorb our peak season volume” doesn’t have a single right metric to check it against, and why container port performance needs more than one lens before a decision gets made.
A few things follow from having both halves of the picture available at once:
- Waiting rate and waiting time answer how predictable it is to get into berth. Berth stay answers how long cargo actually sits once it's there. A peak season decision needs both, not one standing in for the other.
- Volume matters alongside the averages. A carrier running 122 calls in a period, as MSC does here, is a different kind of data point than one running 20, even when both produce a clean average.
- The best carrier depends on where the risk sits. Specifically, which part of the port call threatens the schedule commitment, getting delayed before berth, or getting delayed at berth.
Where this leaves a BCO planning around terminal congestion
This comparison has historically been hard to put together across several carriers and ports at once, which is why it gets skipped. But with container terminal performance data, that comparison is no longer something a BCO has to take on faith.
Here are three things worth checking before locking in a routing decision:
- Look at waiting rate and waiting time alongside berth stay, not instead of it. One half tells you how predictable it is to get into berth, the other tells you how long cargo sits once it's there, and a routing decision needs the full port call in view, not just the part that's easiest to find.
- Check berth stay before treating strong waiting numbers as proof of a faster overall port call. A carrier that waits the least to get to berth can still have the longest total time in port.
- Weigh every monthly figure against the call volume behind it. A carrier running a handful of calls a month and one running more than a dozen aren’t offering the same strength of evidence, even when their averages land on the same chart.
The carrier that ends up absorbing peak season volume should be the one that performs best on whichever part of the port call actually drives the commitment being made, not the one with the single most flattering number on the first chart pulled up.

See why the most successful traders and shipping experts use Kpler

See berth stay and waiting time together