The terminal congestion data nobody brought to the negotiation
Carriers enter into rotation negotiations with a waiting time number. The terminal walks in with a different number. Neither was built to stand up from the scrutiny of the other side.
That's not a failure of either party, but rather a description of how terminal performance data has traditionally worked. Each side measures its own vessels, at its own terminal, using its own definitions, and brings that number to a conversation where the other party has every reason to dispute it. Nobody's lying, but nobody's numbers are neutral either.
Where shared terminal performance data helps
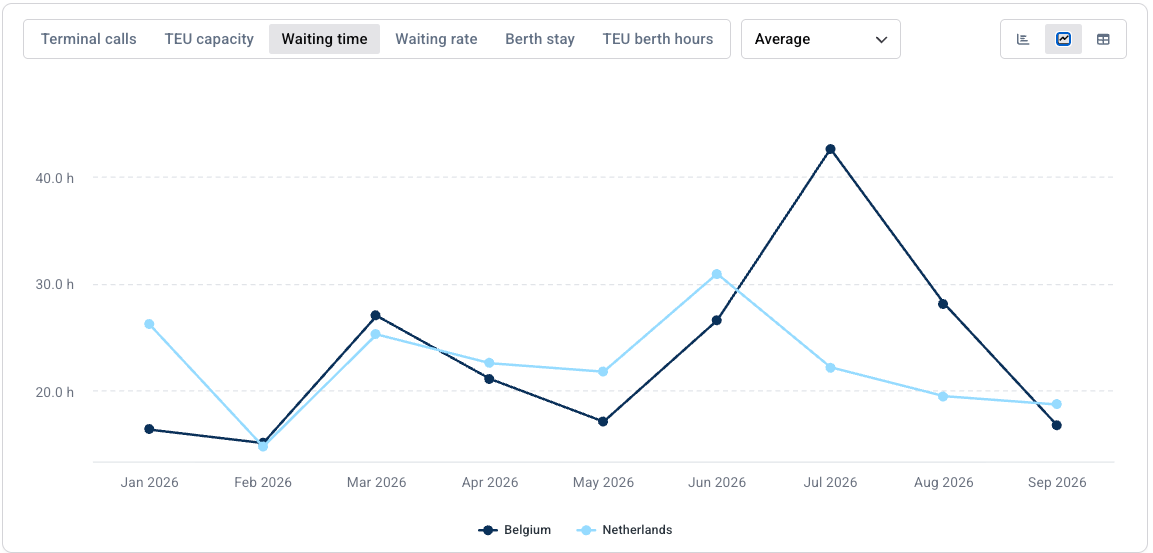
Take two competing ports in the Netherlands and Belgium, benchmarked against each other over a trailing 12 month period for vessels above 5,000 TEU. The comparison spans 2,731 terminal calls across 647 distinct vessels using Terminal Activity data.
Pull the monthly average waiting time for both ports from January through September 2026, and the first thing that stands out isn't a rivalry. It's how close the two run for most of the year.
Netherlands averages 22.5 hours across the nine months. Belgium averages 23.4 hours. On a full-year basis, the two ports look close to interchangeable, and a carrier arguing "our terminal is simply better" on the strength of that average alone wouldn't have much of a case.
One month breaks the pattern. In July, Belgium jumped to 42.6 hours, nearly double its own June figure of 26.6 hours, and the single highest reading either port posts in the nine months. Netherlands, over that same month, sits at 22.2 hours, almost exactly its yearly average.
That's a materially different claim than "Belgium is a worse port." The full-year numbers don't support a broad statement like that. Instead, they support a narrower claim that something specific happened at the Belgian port in July, and that's precisely the kind of claim a rotation or SLA conversation can act on, because it points both sides at the underlying calls instead of at each other.
The terminal activity data hiding inside one month
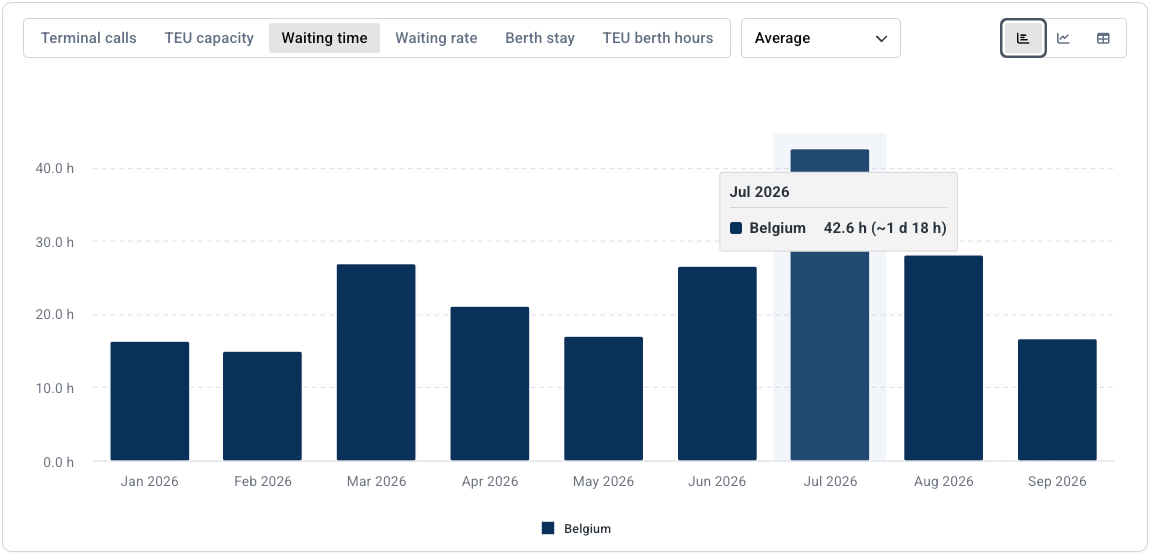
Clicking into July for the Belgian side, filtered to Panamax, Neo-Panamax, and ULCV vessel classes, surfaces 174 individual terminal calls across the ports of Antwerp and Zeebrugge, each with vessel name, terminal, berth, exact TEU capacity, waiting time, length of stay, departure, and carrier. That's what the 42.6 hour average is built from, and it isn't evenly spread.
A few things become visible once the calls are broken out individually:
- The spike is concentrated at two terminals, not the whole port: Antwerp Gateway DP World Terminal and MSC PSA Delwaidedok Terminal average roughly 78 to 79 hours of waiting across their July calls. Zeebrugge's own terminal averages 20.7 hours over the same month, a figure closer to a normal month elsewhere in the dataset.
- A handful of calls carry a disproportionate share of the total wait: The longest individual waits in the month run well past 150 hours, and one call clears 245 hours, roughly ten days.
- The carrier breakdown matters, and so does sample size: ONE Holdings shows the highest average wait in the month, but across only four calls, too small a sample to generalize from confidently. MSC Group, with 67 calls in the same month, the largest carrier sample by far, averages 38 hours. CMA CGM Group, across 20 calls, averages roughly 63 hours.
- The pattern holds at the alliance level: Premier Alliance shows the highest average, from only eight calls. Ocean Alliance, with a much larger sample of 44 calls, sits at a lower and more representative 64 hours.
That's the difference between an aggregated monthly number and the calls underneath it. The chart says Belgium had a rough July. The calls say two specific terminals, and a small set of carriers on a limited number of calls, are doing most of the work to produce that number. That's information a monthly average alone can't provide, and it's information a single carrier's own operational log, covering only its own vessels, was never positioned to provide either.
Why independent terminal performance data changes the negotiation
Bring this into an SLA or rotation conversation and the shape of the discussion changes in a specific way.
Instead of the carrier's log against the terminal's log, both sides are looking at the same underlying calls, measured the same way, for every vessel that crossed through either port in the period under discussion. That doesn't resolve every disagreement, but it removes a layer of disagreement that used to eat up most of the meeting, whether the starting number itself can be trusted at all.
A few things follow from that:
- Congestion patterns become visible at the terminal level, not just at the level of one carrier's own experience of it.
- Seasonal effects can be isolated and compared year over year, rather than argued about from memory.
- A pricing or capex conversation can start from a shared reference point instead of two competing ones.
In the Netherlands and Belgium example, that's the difference between a rotation conversation that opens with a blanket claim about one port underperforming the other, and one that opens with two named terminals and a specific set of carrier calls in a specific month, which is a conversation that can actually be resolved rather than argued indefinitely.
What consistent terminal performance data changes
A rotation or SLA negotiation grounded in one independently built record of terminal performance, viewable all the way down to the individual call, doesn't remove the disagreement. It changes what the disagreement is about.
Instead of spending the first half of the meeting establishing whose number is credible, both sides start from the same terminal-call record and argue about what it means for the rotation, the SLA, or the price. That's a shorter path to a resolution either side can actually act on, and it's a materially different negotiation than one built entirely on two operational logs that were never designed to be compared against each other in the first place.

See why the most successful traders and shipping experts use Kpler
A neutral benchmark for terminal performance