


Stronger June power-sector gas burn lifts Taiwan LNG demand despite Q4 coal recovery
Stronger-than-expected gas-for-power demand in June prompts Kpler Insight to raise its 2026 Taiwan LNG demand forecast by 0.1 mt to 24.2 mt. Lower coal-fired generation and weaker coal imports increased reliance on gas, outweighing the expected drag from stronger solar output in September–October and higher coal utilisation in Q4. The modest LNG demand upgrade adds limited support to Asian spot LNG prices. For 2027, stronger renewable utilisation and a slower coal phase-down reduce the LNG demand forecast by 0.2 mt to 25.4 mt.
Market & Trading Calls
- Taiwan LNG demand: Slightly higher. Kpler Insight raises its 2026 forecast by 0.1 mt to 24.2 mt, as stronger-than-expected gas-for-power demand more than offsets stronger solar output in late Q3 and early Q4 and higher coal utilisation in Q4. The 2027 forecast decreases by 0.2 mt to 25.4 mt, reflecting stronger renewable utilisation and a slower coal phase-down.
- Asian LNG prices: Stable. The 0.1 mt increase in Taiwan’s 2026 LNG requirement, equivalent to around 1–2 cargoes, provides limited support to regional prices.
Taiwan Ministry of Economic Affairs data for June 2026 showed total gas consumption rising to 2.76 bcm, up 0.05 bcm y/y, supported by stronger gas-for-power demand. Power-sector gas consumption increased by 0.07 bcm y/y to 2.26 bcm, more than offsetting a 0.02 bcm decline in non-power demand to 0.51 bcm.
The generation mix reinforced the increase in gas demand. Gas-fired output rose by 0.37 TWh y/y to 12.76 TWh, while coal-fired generation fell by 0.74 TWh to 9.14 TWh. Weekly coal imports into Taichung averaged around 0.19 mt in June, down from 0.20 mt a year earlier, before easing further into July. Lower coal availability and utilisation increased reliance on gas-fired generation, pushing June power-sector gas burn above expectations.
Weather and renewable generation provide a mixed signal for gas demand over the coming months. The latest ECMWF seasonal outlook points to higher near-term precipitation, which should temper cooling demand while also weighing on solar generation. These offsetting effects leave the net impact on gas burn broadly balanced. By September–October, stronger solar output is expected to modestly displace thermal generation, putting some downward pressure on gas-fired power demand.
Coal should provide a second source of displacement in Q4. Kpler Insight expects coal utilisation to strengthen as Taipower rebuilds coal availability following the weaker mid-year procurement profile. Recent procurement activity supports firmer coal burn through October–November, prompting Kpler Insight to raise its Q4 coal-utilisation assumptions. Coal-fired generation is nevertheless expected to remain slightly below year-ago levels.
The combination of stronger renewable output and higher coal utilisation should reduce gas-fired generation requirements through late 2026, but not enough to offset the stronger-than-expected June gas burn. Kpler Insight consequently raises its 2026 Taiwan LNG demand forecast by 0.1 mt to 24.2 mt. The revision is modest in the context of the wider Asian LNG market and should provide only limited incremental support to prompt prices.
The outlook weakens in 2027. Stronger renewable utilisation and a slower coal phase-down reduce gas-fired generation requirements, prompting Kpler Insight to cut its 2027 LNG demand forecast by 0.2 mt to 25.4 mt.
Historical and projected power generation y/y changes by fuel type (TWh)
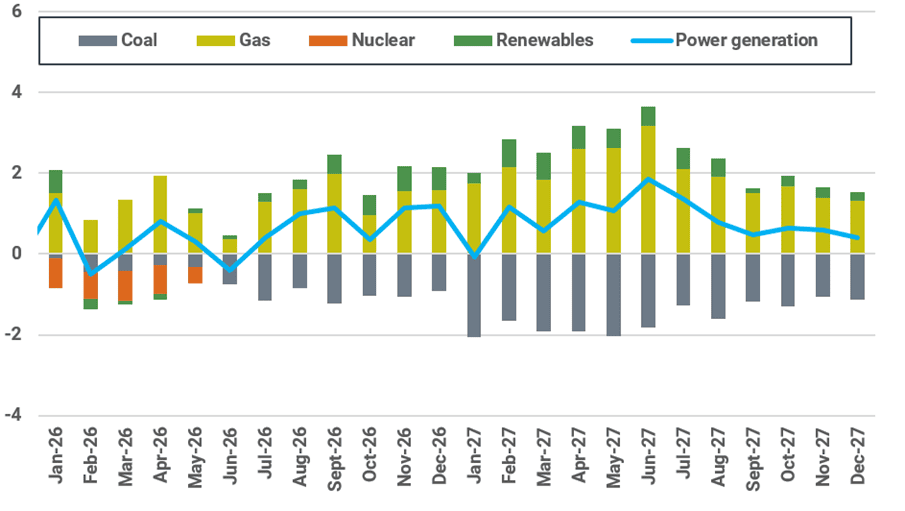
Source: MOEA, Taipower, Kpler Insight. Note: Taipower real-time data is used for July 2026. Kpler Insight forecast data starts from Augut 2026.
Historical and projected installed capacity y/y changes by fuel type (GW)
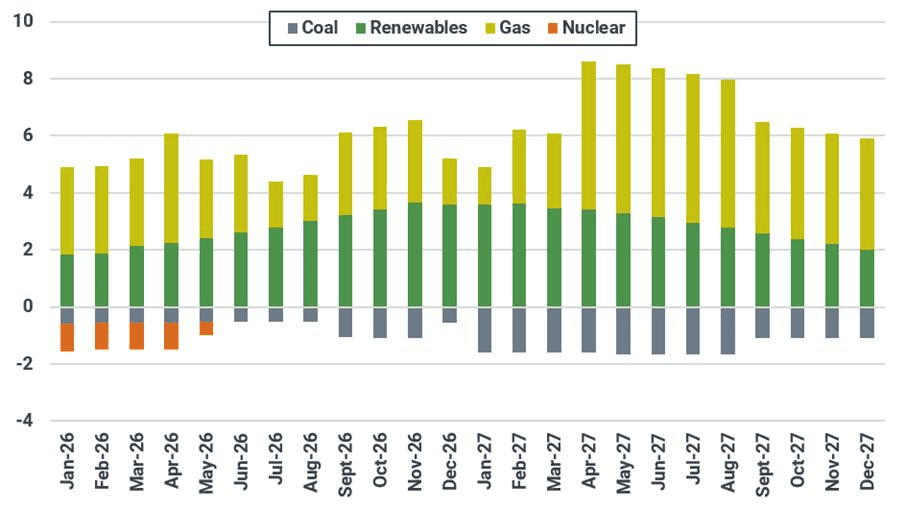
Source: MOEA, Taipower, Kpler Insight.
Historical monthly average utilisation by fuel type (%)
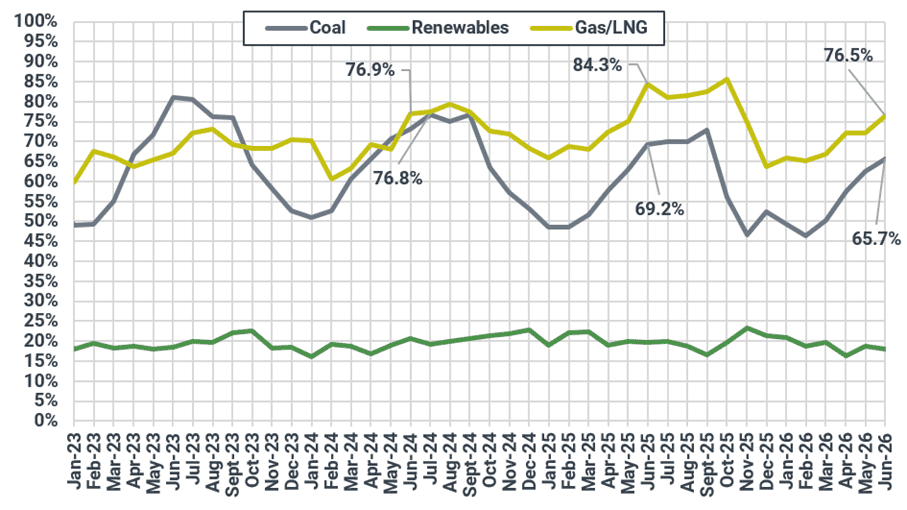
Source: MOEA, Kpler Insight
Weekly coal consumption at Taichung coal-fired plants (mt)
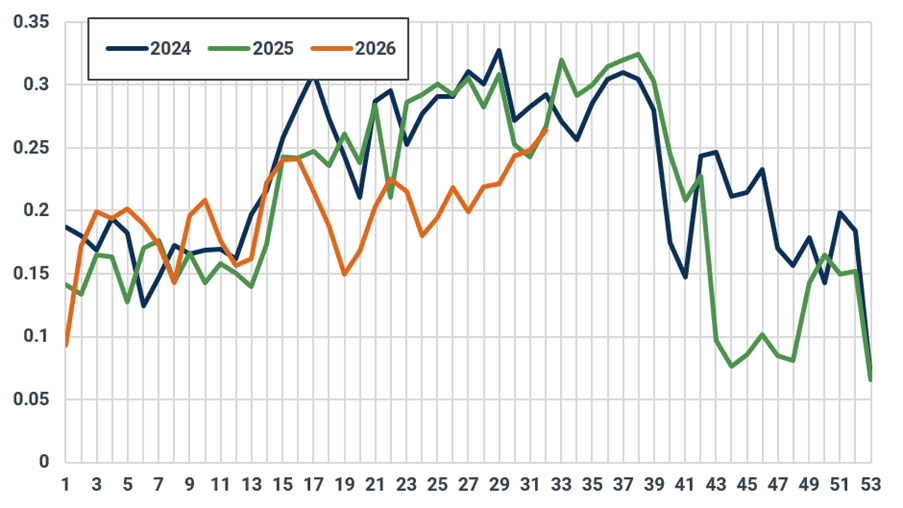
Source: Taipower, Kpler Insight
Taiwan’s population-weighted Cooling Degree Days (CDD)
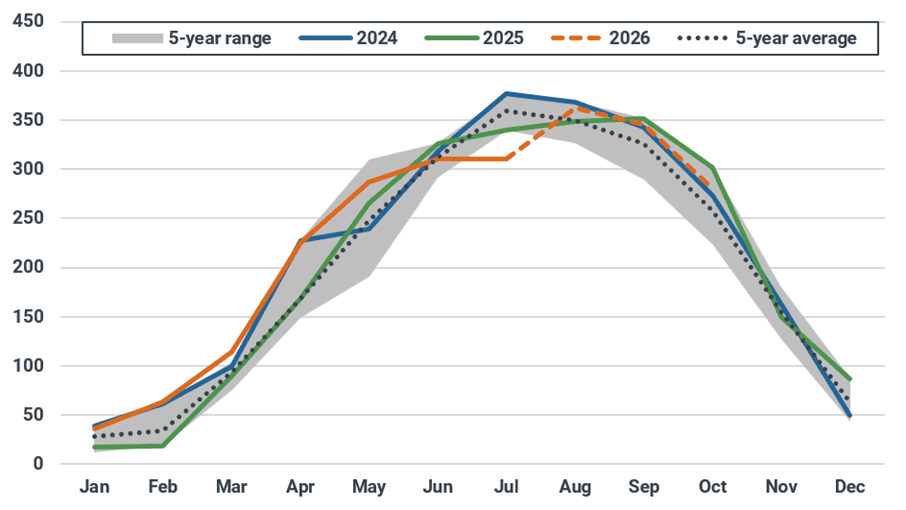
Source: Meteostat, Kpler Insight. Note: Population-weighted CDD of selected major cities across Taiwan is shown for both historical and forecast.
Taiwan’s LNG imports versus regasification limit (mt)
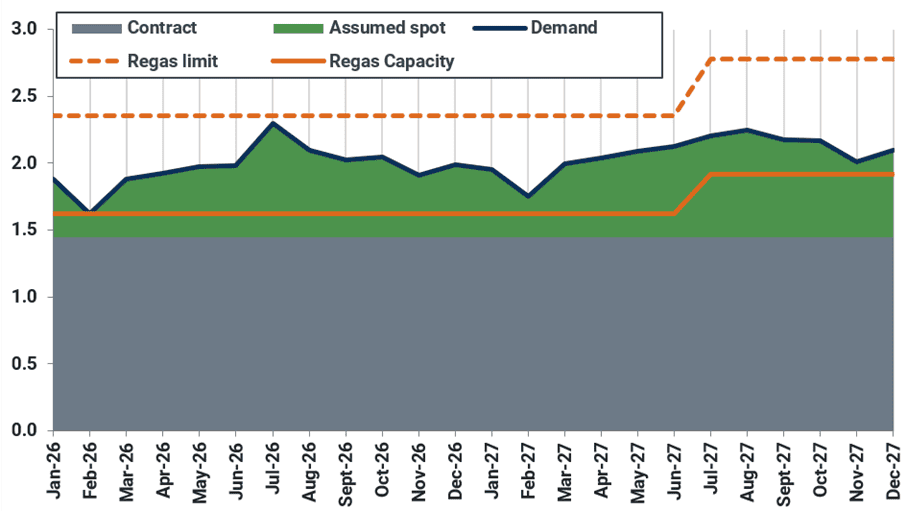
Source: MOEA, Kpler Insight. Note: Regas limit is assumed as 145% of regas capacity.

See why the most successful traders and shipping experts use Kpler






