Turn historical port call activity into actionable market and commercial intelligence. See where trade, supply, and demand are going before the market catches up.


5 yrs
35+
Global
Port Call Trends turns five years of vessel arrivals and departures into a clear view of maritime trade, so you can see where demand is shifting, how your port or accounts compare, and where to act next.
Read port calls as a leading indicator of trade, supply and demand, at scale.
Spot regional demand shifts and LNG-ready or dual-fuel vessel clustering before they show up in commodity prices.
Compare year-on-year activity to separate seasonality from real change.
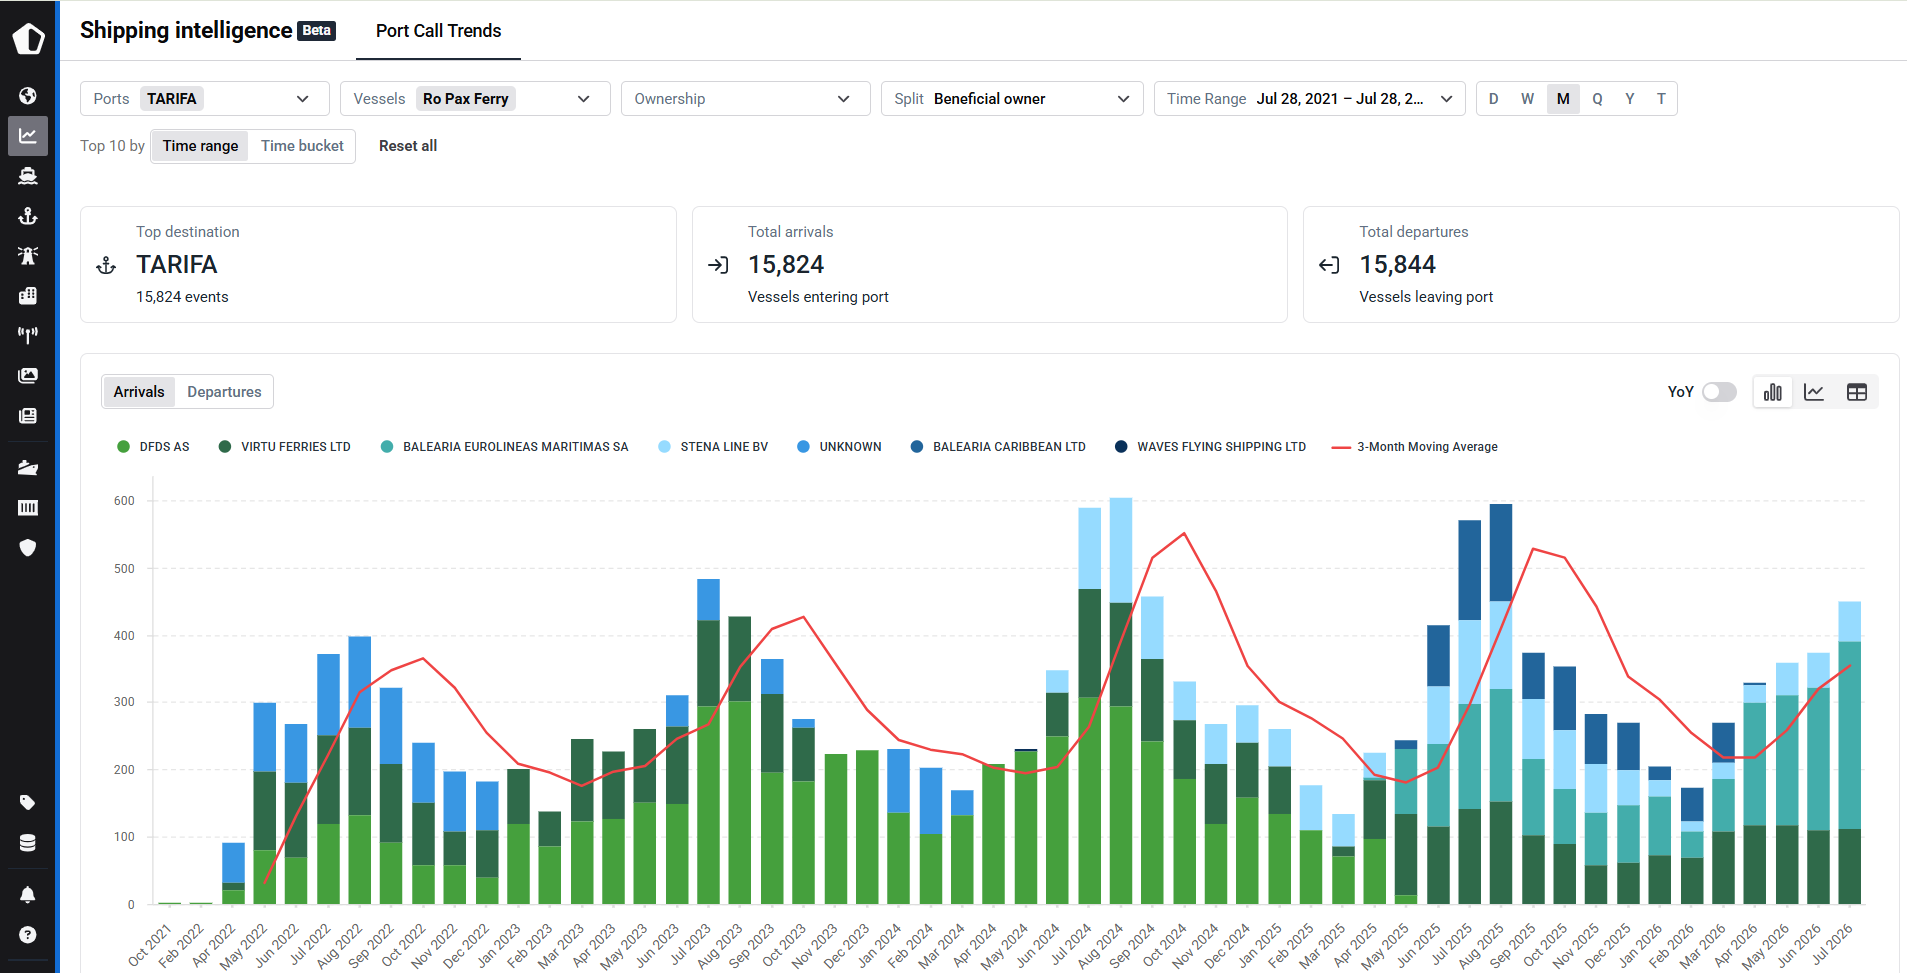
See who's calling, who's growing and where the opportunity is.
Benchmark your port's traffic and vessel mix against competing ports.
Track carrier, operator and ownership activity to spot share shifts early and prospect growth accounts you don't yet serve.
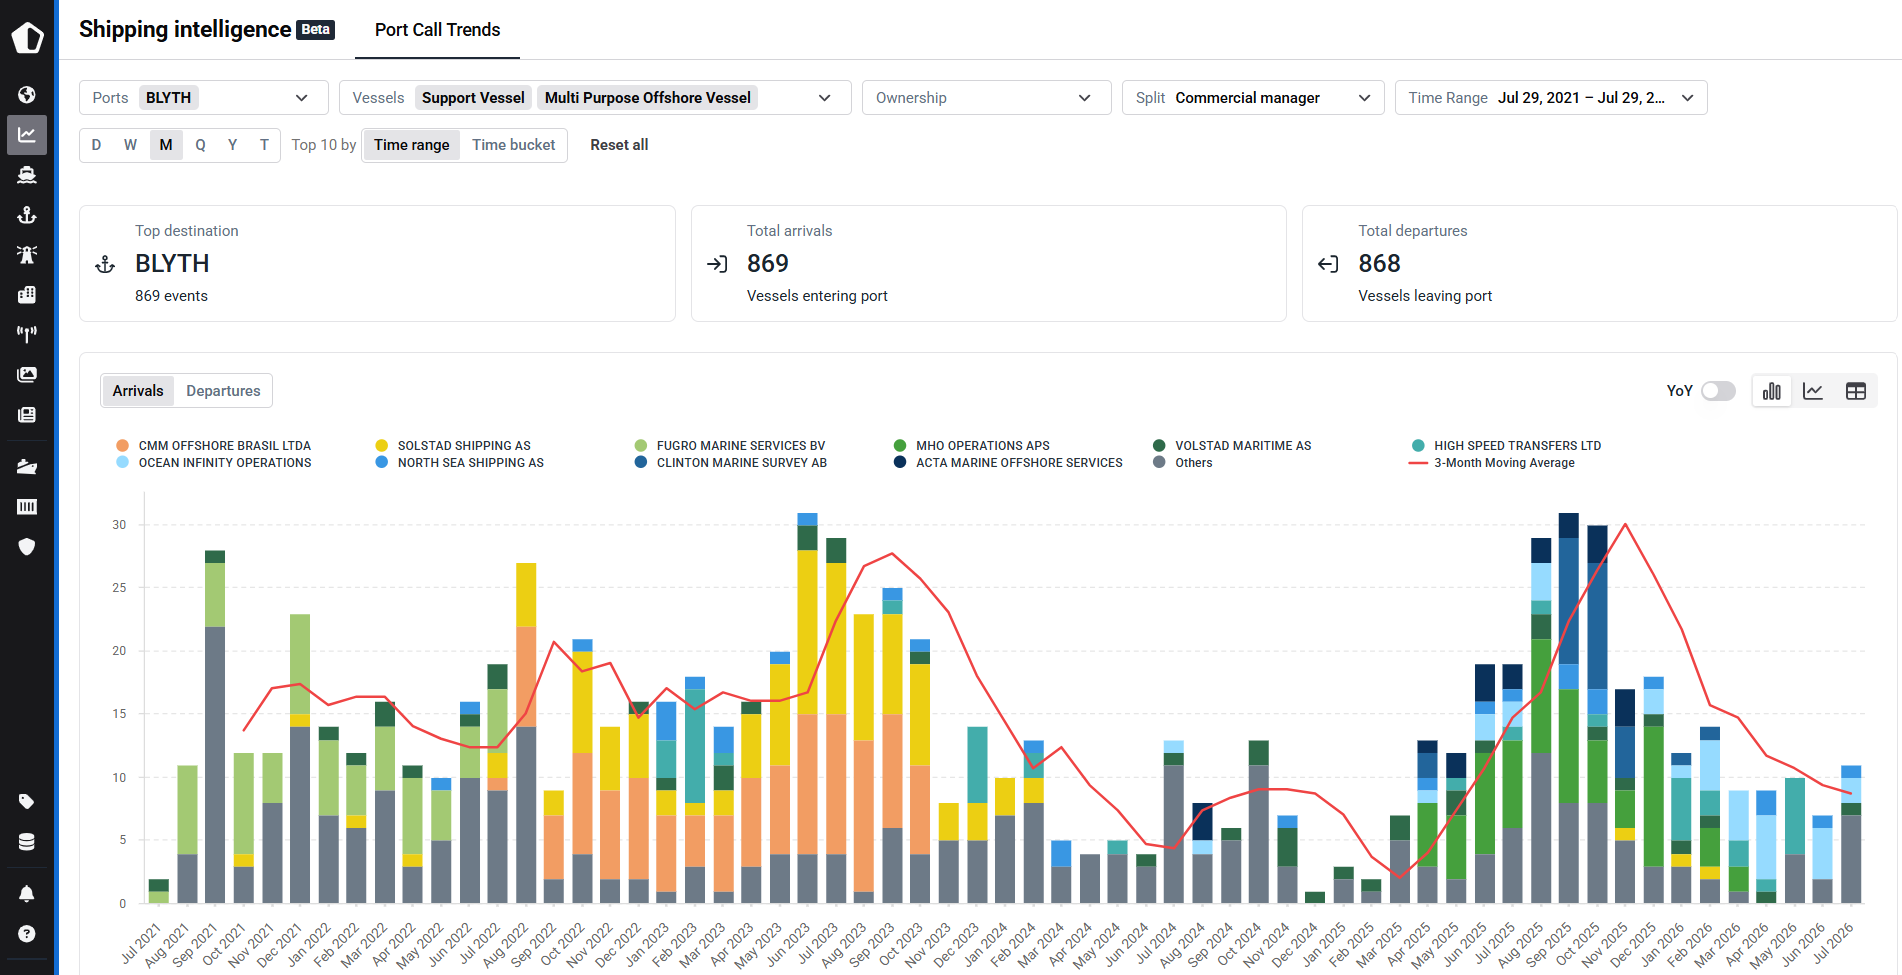
Build analyses around your own questions, not fixed reports.
Filter by port, country, vessel type, flag, DWT and fuel readiness, the headline filter for bunker and alternative fuel demand.
Split by owner, operator or commercial manager to size accounts and territories, then drill from chart to underlying rows without leaving the workspace.

Query up to five years of port call history on demand.
Replace manual exports and one-off analyst requests with a live view.
Separate signal from noise using moving averages at monthly, quarterly or yearly granularity.

The same vessel, port, and ownership data your team already trusts, in one workspace.
Move from the trend view to the underlying port call records without leaving the platform.
Vessel particulars and ownership data already validated.

“We have managed to streamline the way we work, and MarineTraffic has definitely supported that.”





FAQ
Port call data is a record of vessel arrivals and departures at a port or terminal, capturing details like the vessel's identity, arrival and departure timestamps, port and berth, flag, vessel type, and ownership or operator — typically derived from AIS tracking of vessel position and movement. Because it reflects real vessel and cargo activity rather than reported figures, port call data acts as a leading indicator of trade, supply, and demand, often signaling regional shifts before they show up in commodity prices or official trade statistics.
Port congestion occurs when the number of vessels seeking to call at a port exceeds the port’s capacity to process them efficiently. Ships queue at anchorage waiting for a berth, which delays schedules and increases demurrage and detention costs. Congestion can also build on land, when cargo cannot leave the terminal quickly enough.
The clearest sign is a vessel count at anchor well above the port’s normal level. Other signals are rising berth waiting times, longer vessel turnaround, and declining carrier schedule reliability. Port call trends add a longer view by showing whether arrivals at a port are running above their seasonal and historical range.
Port call data shows arrivals and departures over time, split by vessel type, size, flag, owner and operator. Used this way, it shows how traffic and vessel mix are changing at a port and lets you benchmark against competing ports.
It depends on vessel type, size and cargo, so there is no universal figure. Container vessels that normally complete port calls in 24–36 hours but begin taking 48–72 hours or more point to capacity constraints, according to Kpler’s guide. The most useful comparison is a port’s own historical baseline for the same vessel segment.
Port Call Trends is a dashboard within Shipping Intelligence, a workspace inside MarineTraffic Enterprise that turns historical vessel arrivals and departures into market and commercial intelligence. It helps users read port call activity as a signal of trade, supply, and demand, and as a way to benchmark ports, track carrier and operator activity, and identify growth accounts.
Economists and macro strategists, commodity and trade-flow desks, port authorities benchmarking against competing ports, terminal operators tracking carrier and operator mix, port services and agents prospecting new accounts, bunker suppliers sizing alternative fuel demand, shipowners and fleet managers, and financial and government researchers.