

Belgium breaches 1,000 €/MWh as low wind and heatwave spikes evening peak
Belgian day-ahead prices hit 1,038 €/MWh for the 24 June 20:45 CET product, smashing the 15-minute record of 658 €/MWh set the day before. A European wind drought, fuelled by the heatwave, hitting a Belgian stack short 2.3 GW of nuclear capacity due to long-term outages, has driven prices to record highs.
Executive Summary
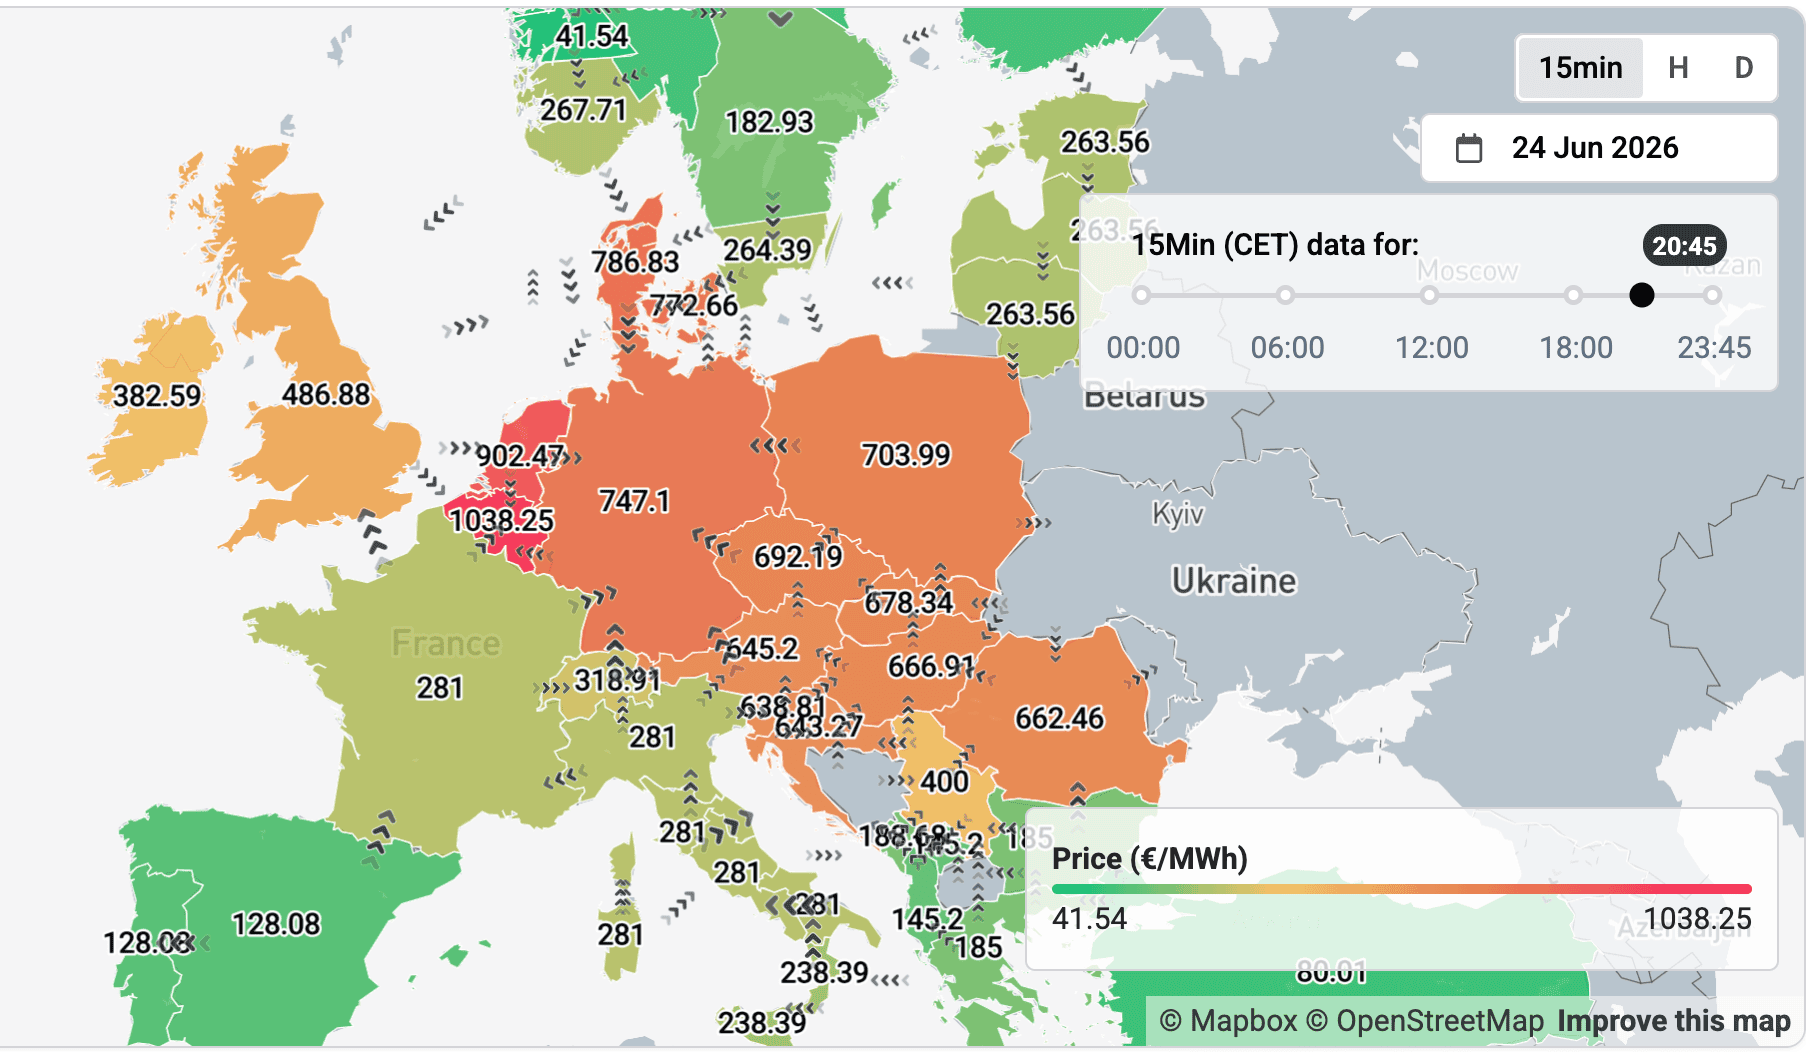
- CWE saw high price levels for the 20:45 CET block on 23 and 24 June, with Germany, the Netherlands, Belgium and DK1 all clearing above 600 €/MWh. On 24 June, Belgium cleared at 1,038 €/MWh, breaking 1,000 €/MWh for the first time since 15-minute trading begun in September 2025.
- Low seasonal wind across Europe has left residual demand extremely tight at 20:45 as solar generation dwindles. However, Belgium spikes hardest because of extended nuclear outages. The 8-month nuclear outage removing 2.3 GW of baseload through October leaves Belgium with little flexibility during the evening ramp.
- Prices reached a level where supply liquidity was breaking down: supply was just 3 MWh from the 4,000 €/MWh DA market cap, and just 5.3MWh from potential market splitting.
- Northern Europe isn't demand-responsive to heat; the South is. Italy (+1.3 GW/°C, R² 0.51) and Spain show clean evening sensitivity, but both were cheapest in Western Europe on June 23, with Italy at 260 €/MWh and Iberia at 150 €/MWh, because ample gas capacity covered the evening ramp without scarcity.
The second heatwave of 2026 is sweeping Europe, with French temperatures reaching 41-44°C and Germany 40°C during Week 25.
Germany, the Netherlands, Belgium and both Danish zones all cleared above 600 €/MWh in the 20:45 CET block on 23 June, with Belgian prices hitting 658.09 €/MWh, the highest recorded since 15-minute trading launched in September 2025.
However, temperature-driven demand is not the main factor driving record highs in Northern Europe.
It's the wind
The heatwave depressed wind output across continental Europe; pushing forecasted German wind generation down to ~2 GW, just 16% of seasonal averages, during the 20:45 block on 24 June, with Danish and Polish wind generation also below 50% of seasonal averages.
As solar ramps down, the evening residual peak clears against a limited thermal stack with little flexibility behind it.
The 8-month nuclear outage at Belgian facilities, removing 2.3 GW of capacity, leaves Belgium most exposed. Day-ahead prices cleared at 1038.25 €/MWh for the 20:45 block on 24 June, almost 400 €/MWh above the previous 15-minute record of 658.09 €/MWh, set for the same block the day before.
France sits at a comparatively low 281 €/MWh, producing a 757 €/MWh FR-BE spread as interconnector flows reach capacity across the flow-based CWE (Central Western Europe) region.
CEE (Central Eastern Europe) zones are also highly exposed, with prices in a tight 645-705 €/MWh cluster. Demand across the region looks relatively normal: Poland sat at ~20 GW, within seasonal expectations. The driver is low wind and thermal scarcity, not cooling demand.
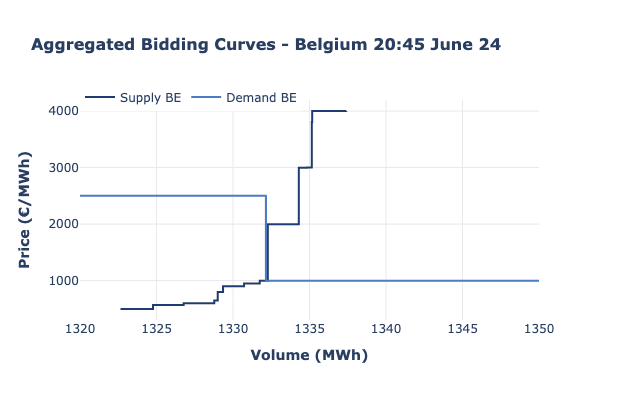
It’s noteworthy how tight the Belgian supply-curve is for the 20:45 block on 24 June.
Liquidity was extremely thin, with sparse supply-demand intersections producing extreme price spikes on minimal volume movement.
Had supply been required to deliver a further ~3 MWh during the block, prices would have reached 4,000 €/MWh, the European day-ahead market cap.
At that price, just 2.3 MWh of supply remained with scarcity conditions possible on any further increase in demand. This would trigger market splitting, in which all available supply clears and the system operator must seek emergency generation or curtail demand ahead of delivery.
Temperature demand response isn’t where prices are highest
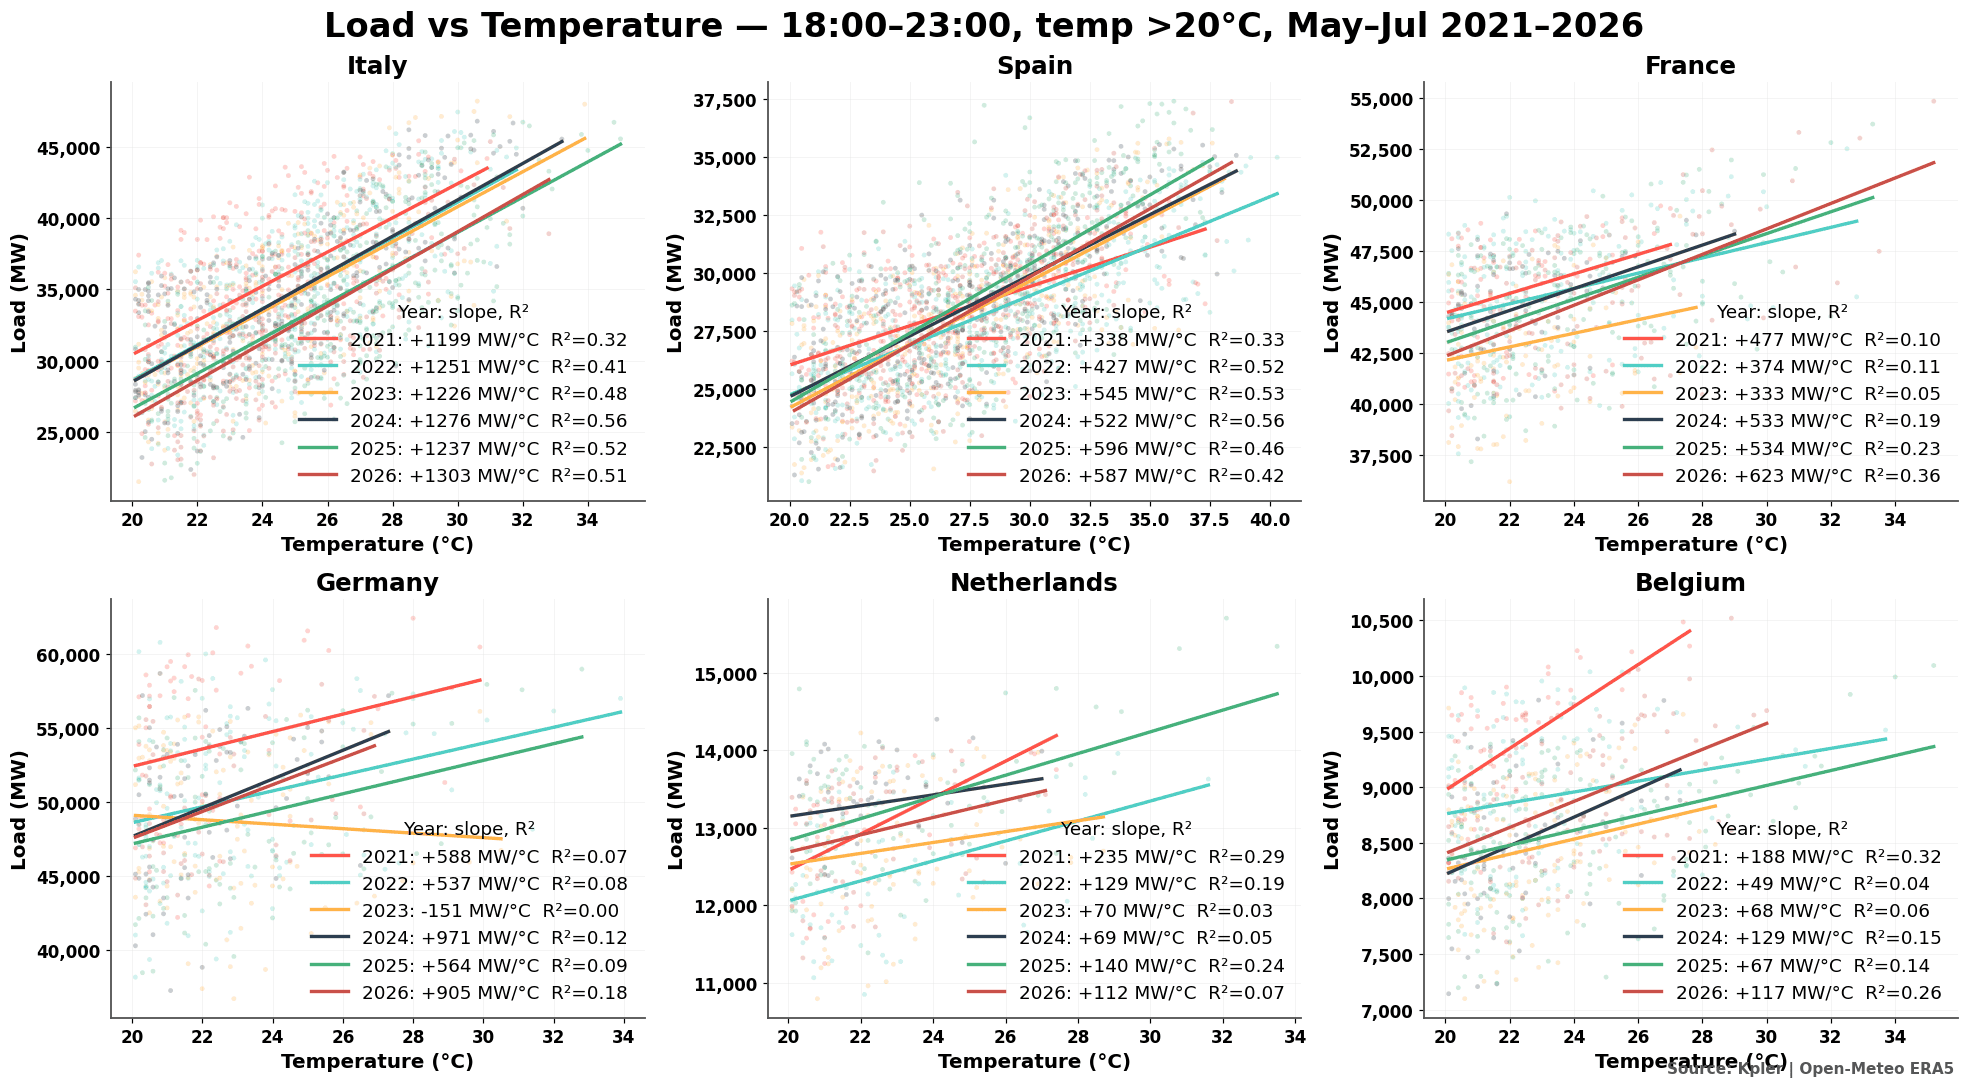
Amongst major Western European markets, only Italy, Spain and more recently France show demand rising cleanly with temperature during evening hours, between 18:00 and 23:00, where solar generation can no longer suppress prices.
Italy shows the largest response: a 1°C temperature rise drives a 1.3 GW increase in demand in 2026, a relationship that has strengthened in both magnitude (1.2 GW versus 1.3 GW) and statistical fit (R² 0.32 versus 0.51) since 2021. Ample gas capacity, however, results in these markets clearing at lower prices than Belgium, the Netherlands, and Germany.
The more northerly CWE markets driving this week's volatility show little temperature response. Germany, the Netherlands, and Belgium all produce relatively shapeless scatter plots, with fitted slopes varying in direction across years, in contrast to the more orderly Southern European pattern.
Belgium in 2026 shows a 117 MW increase in demand per °C, with a loosely fitted slope (R² = 0.26), far too small to account for extreme price spikes in a highly interconnected market.

See why the most successful traders and shipping experts use Kpler


