
CTAs capitalise on energy trends in turbulent Q1
This report outlines the main drivers of CTA performance in Q1 2026.
Intro
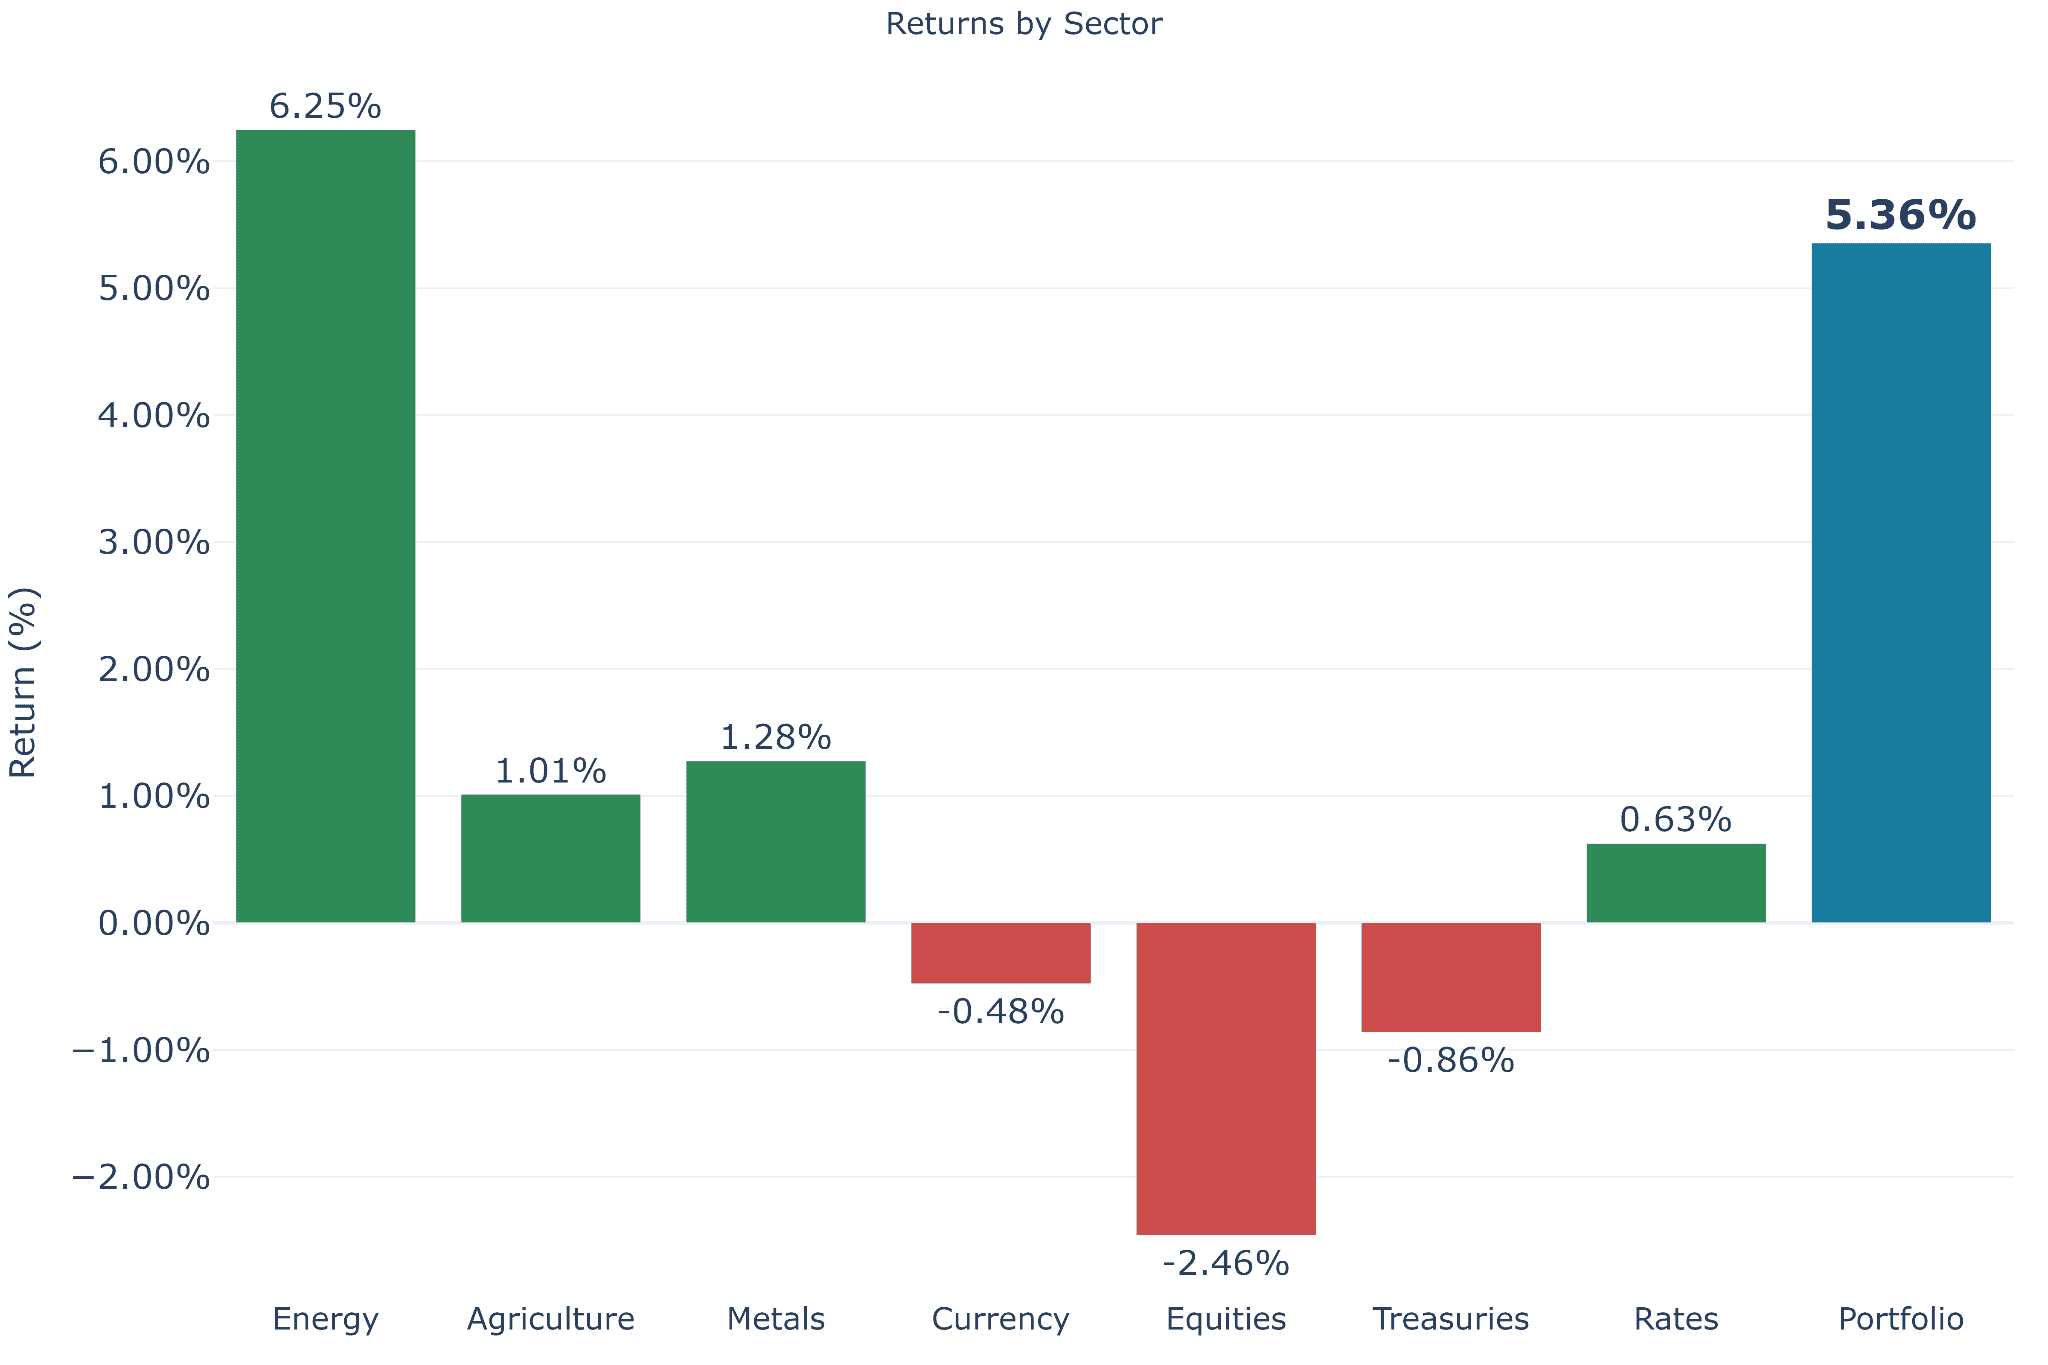
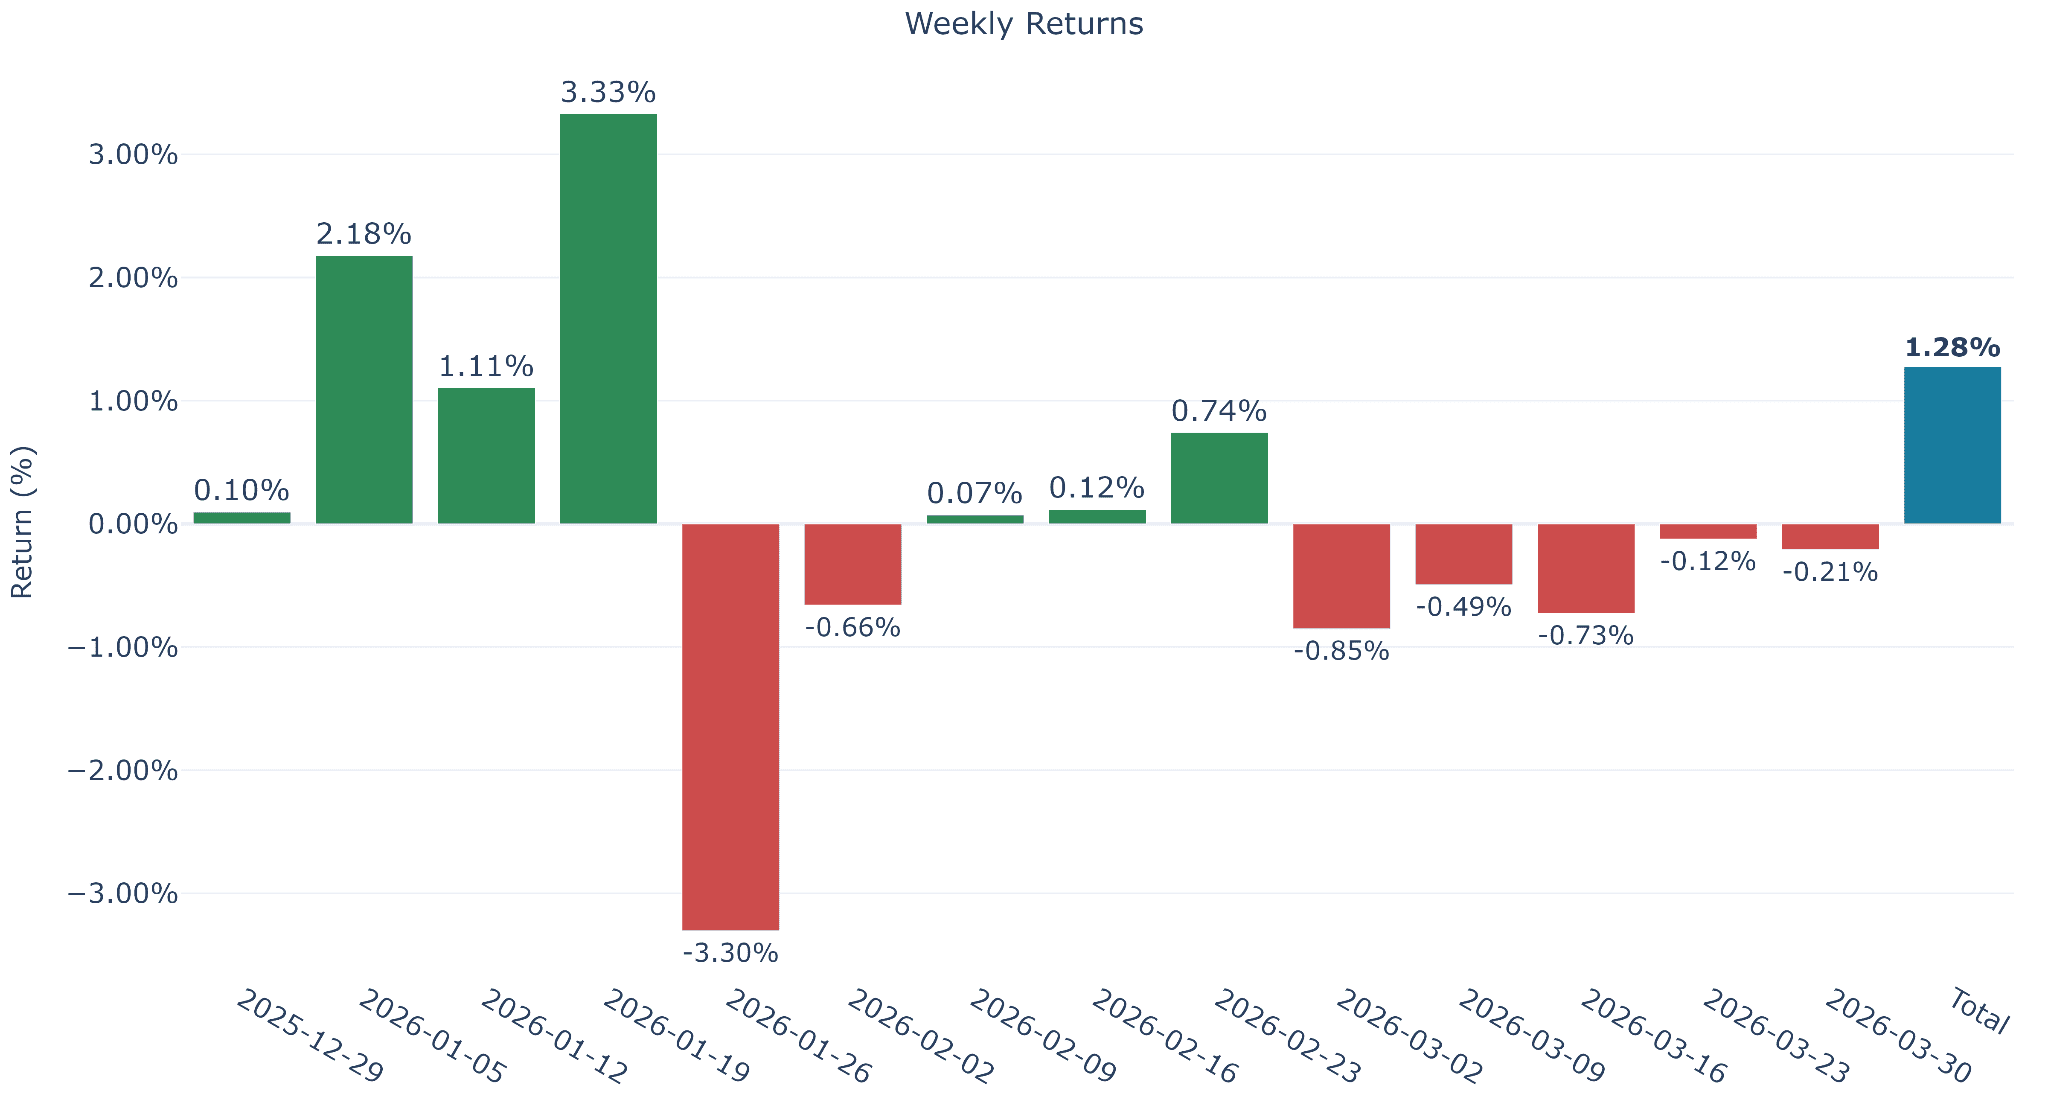
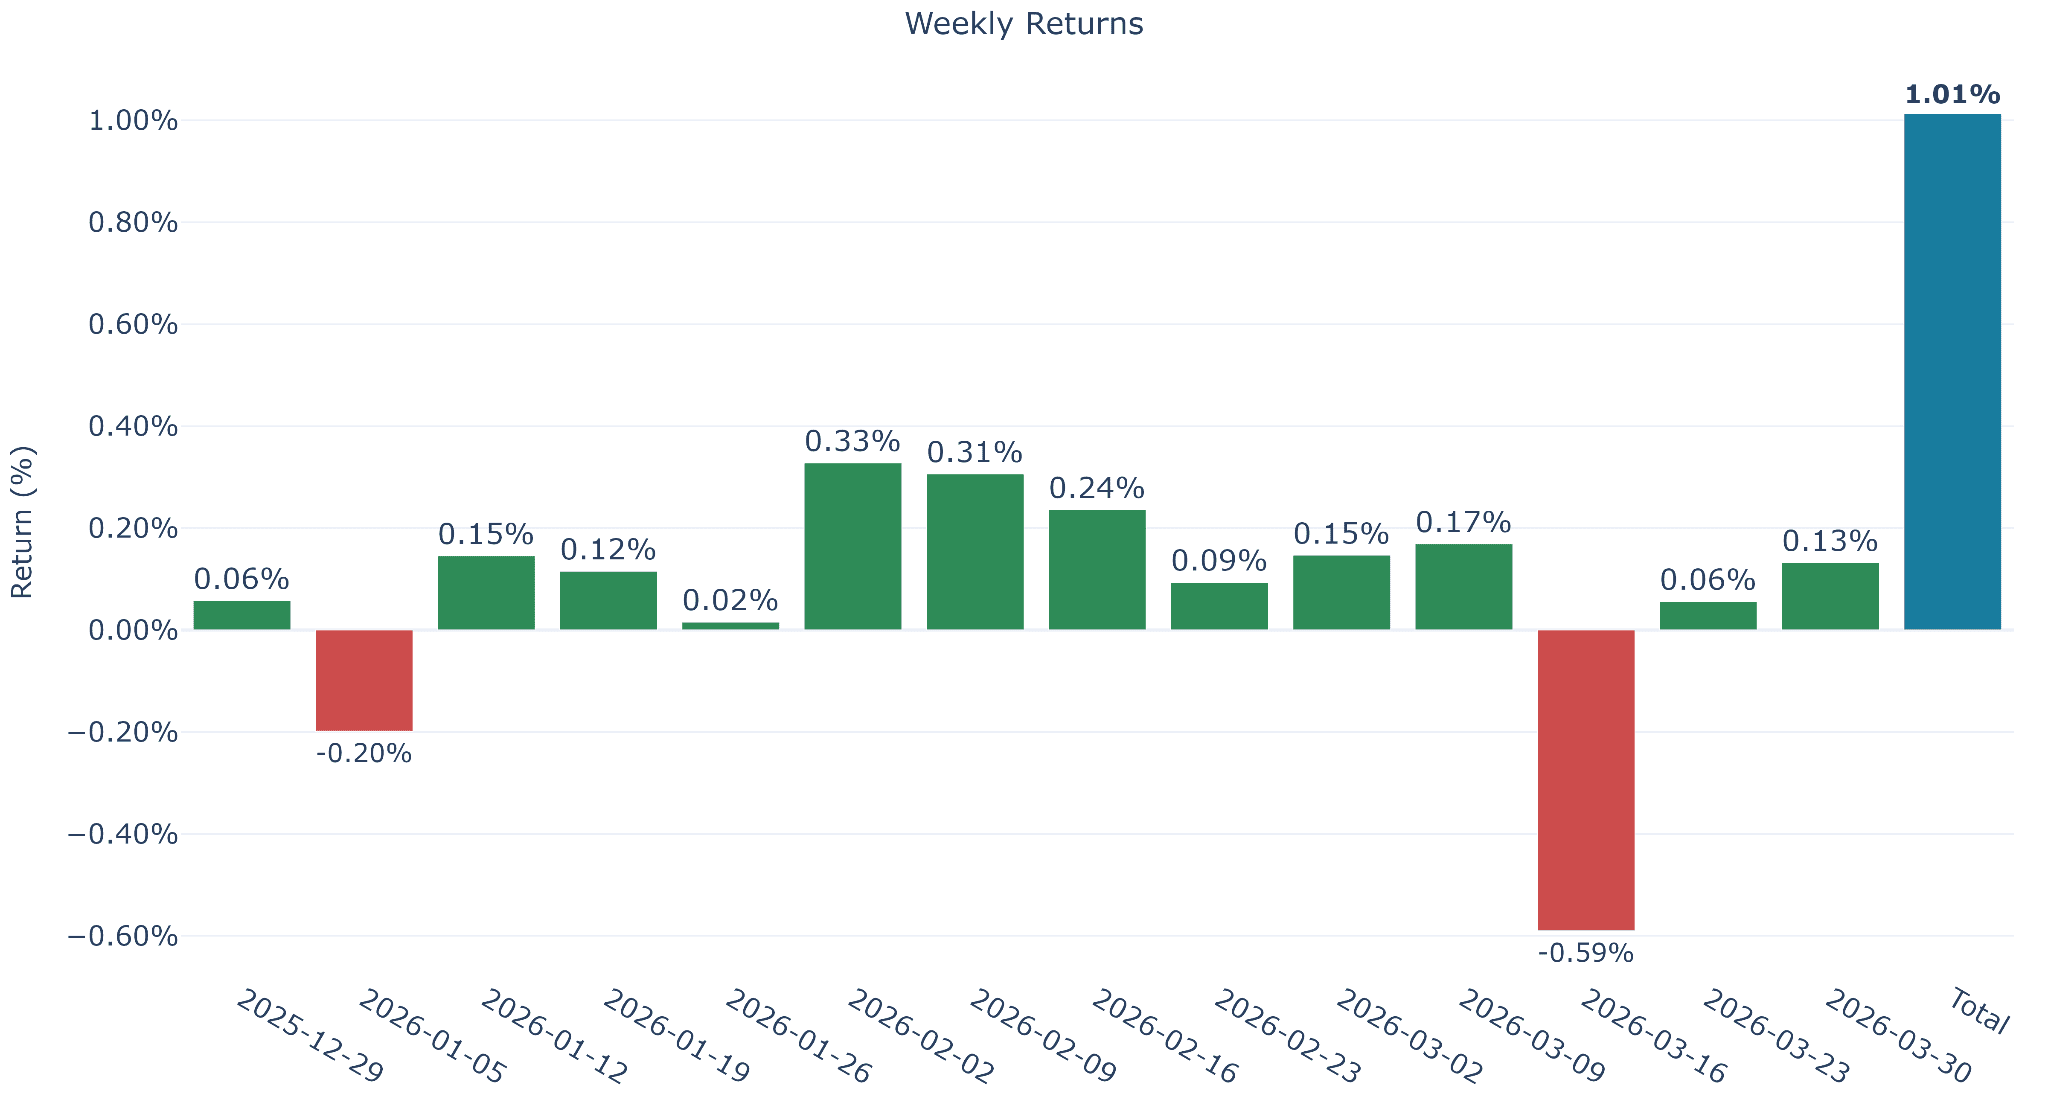
In Q1, CTAs generated strong returns* despite volatile market conditions, with energy leading performance (+6.25%), supported by metals (+1.28%) and agriculture (+1.01%).
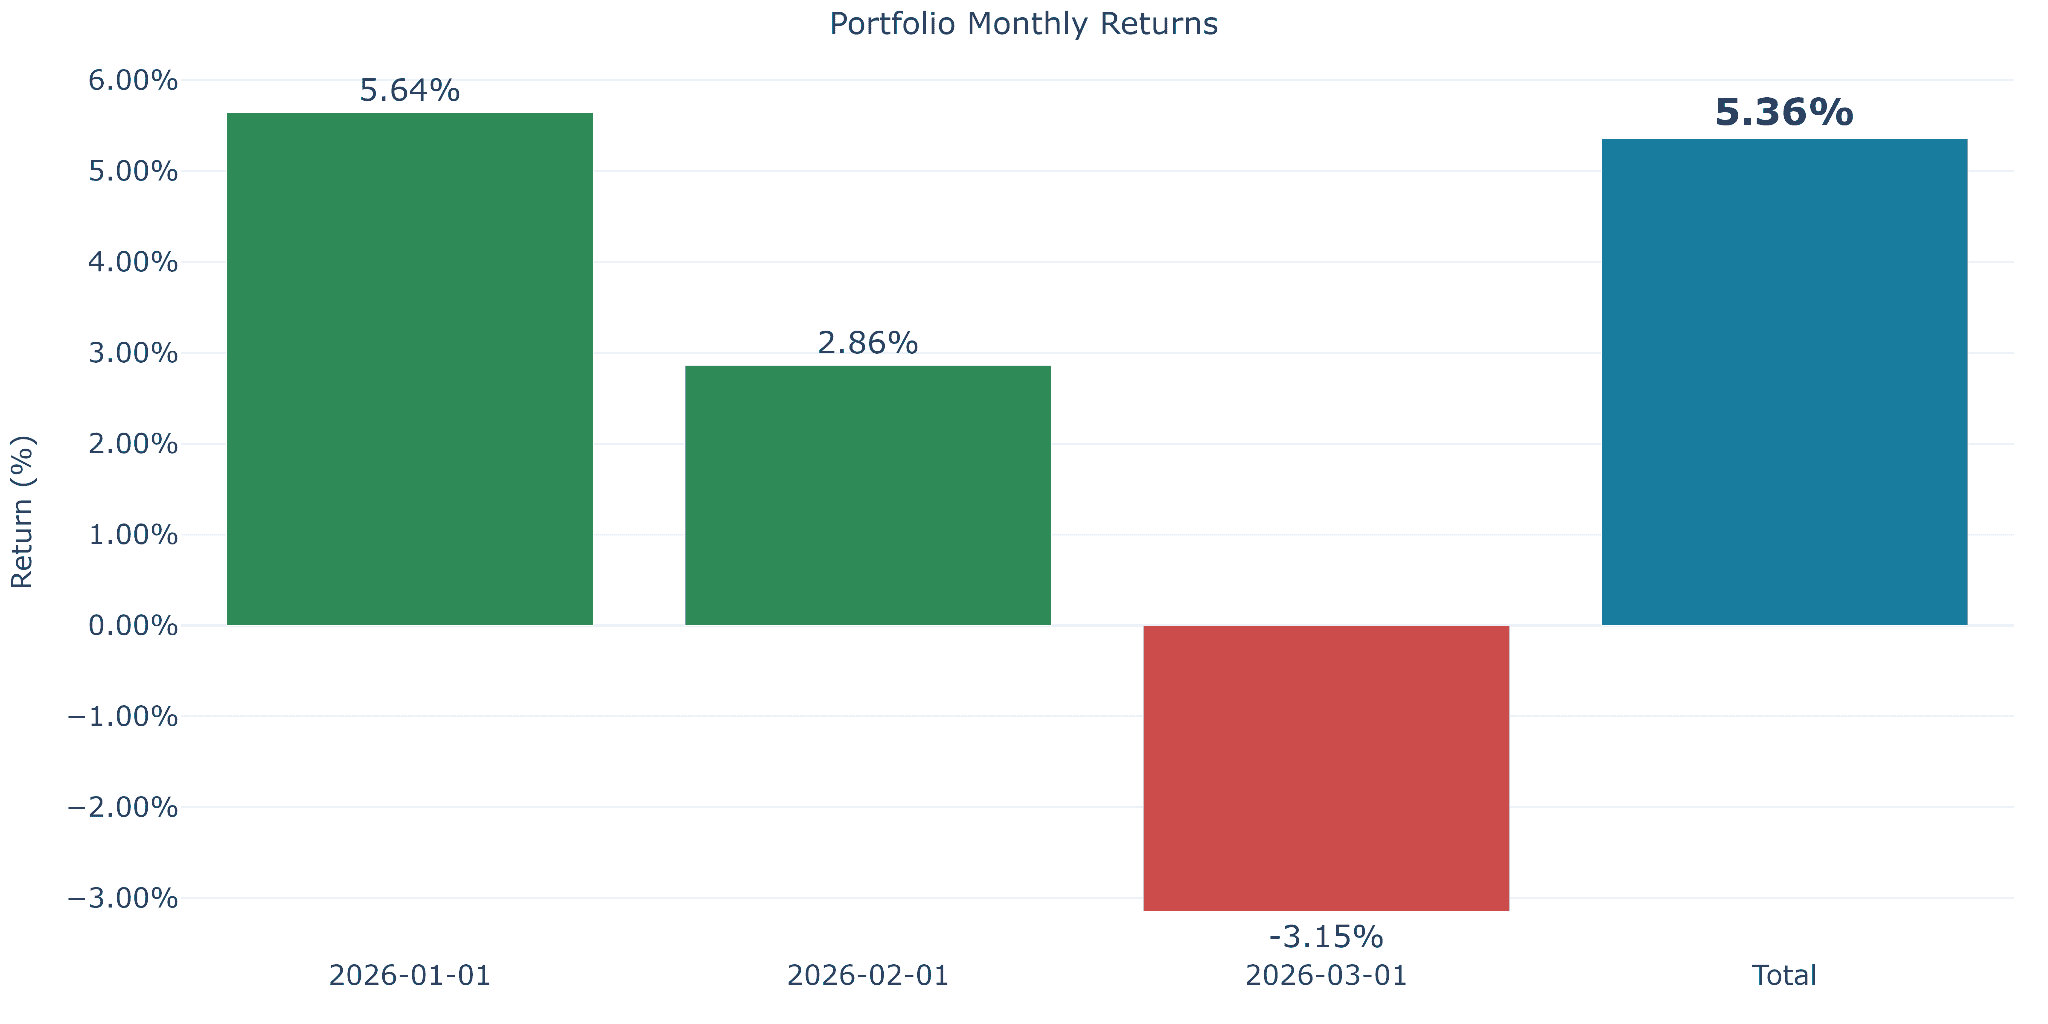
- January: Exceptionally strong CTA performance, driven by sustained rallies in precious and base metals on the back of rate cut expectations, complemented by robust equity gains and supportive trends across agriculture.
- February: CTAs captured accelerating momentum in agriculture and equities, while navigating a partial recovery in metals following the late-January correction. Gold briefly rebounded on renewed safe-haven demand amid escalating US–Iran tensions, although the move proved short-lived as macro headwinds reasserted themselves.
- March: Significant CTA gains in crude and middle distillates were offset by weakness in precious metals (higher yields), base metals (China growth concerns), and soybeans (export demand uncertainty). A broader equity sell-off further weighed on March returns, reversing the strong performance seen in the prior two months.
*CTA returns reflect the aggregated P&L contribution of multiple asset classes (commodities, rates, FX, equities) within a fully diversified $25m dollar portfolio, targeting a 10% standard deviation of average annual returns. Sector-level figures (e.g., energy contributing +6.25%) represent that sector’s contribution to the total $25m portfolio aum and can be scaled to reflect individual market/sector allocations if needed.
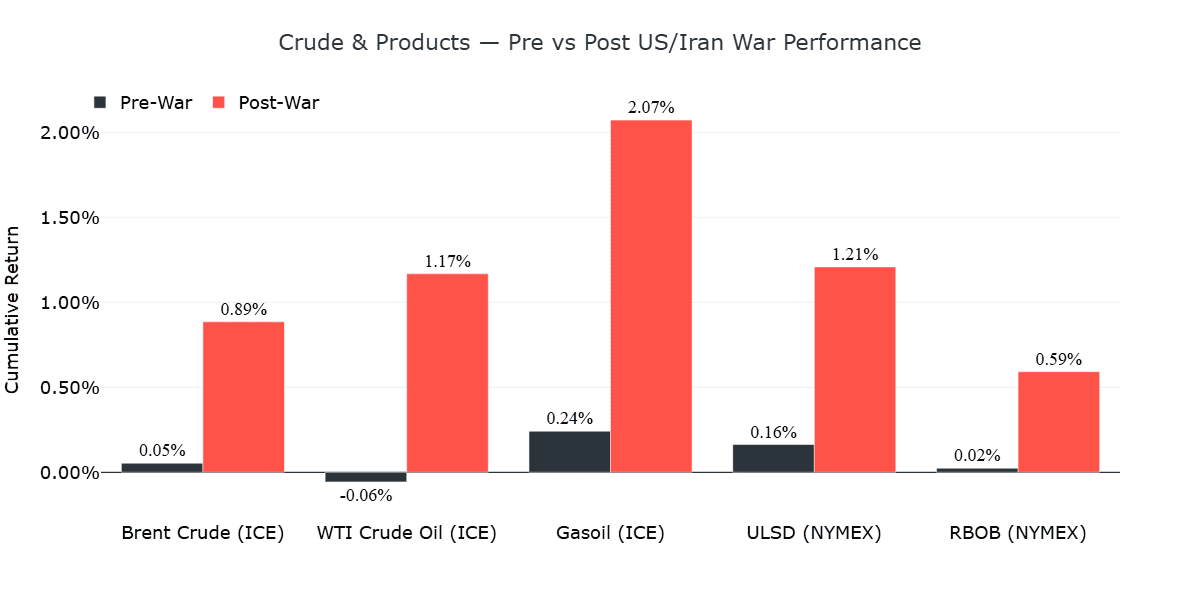
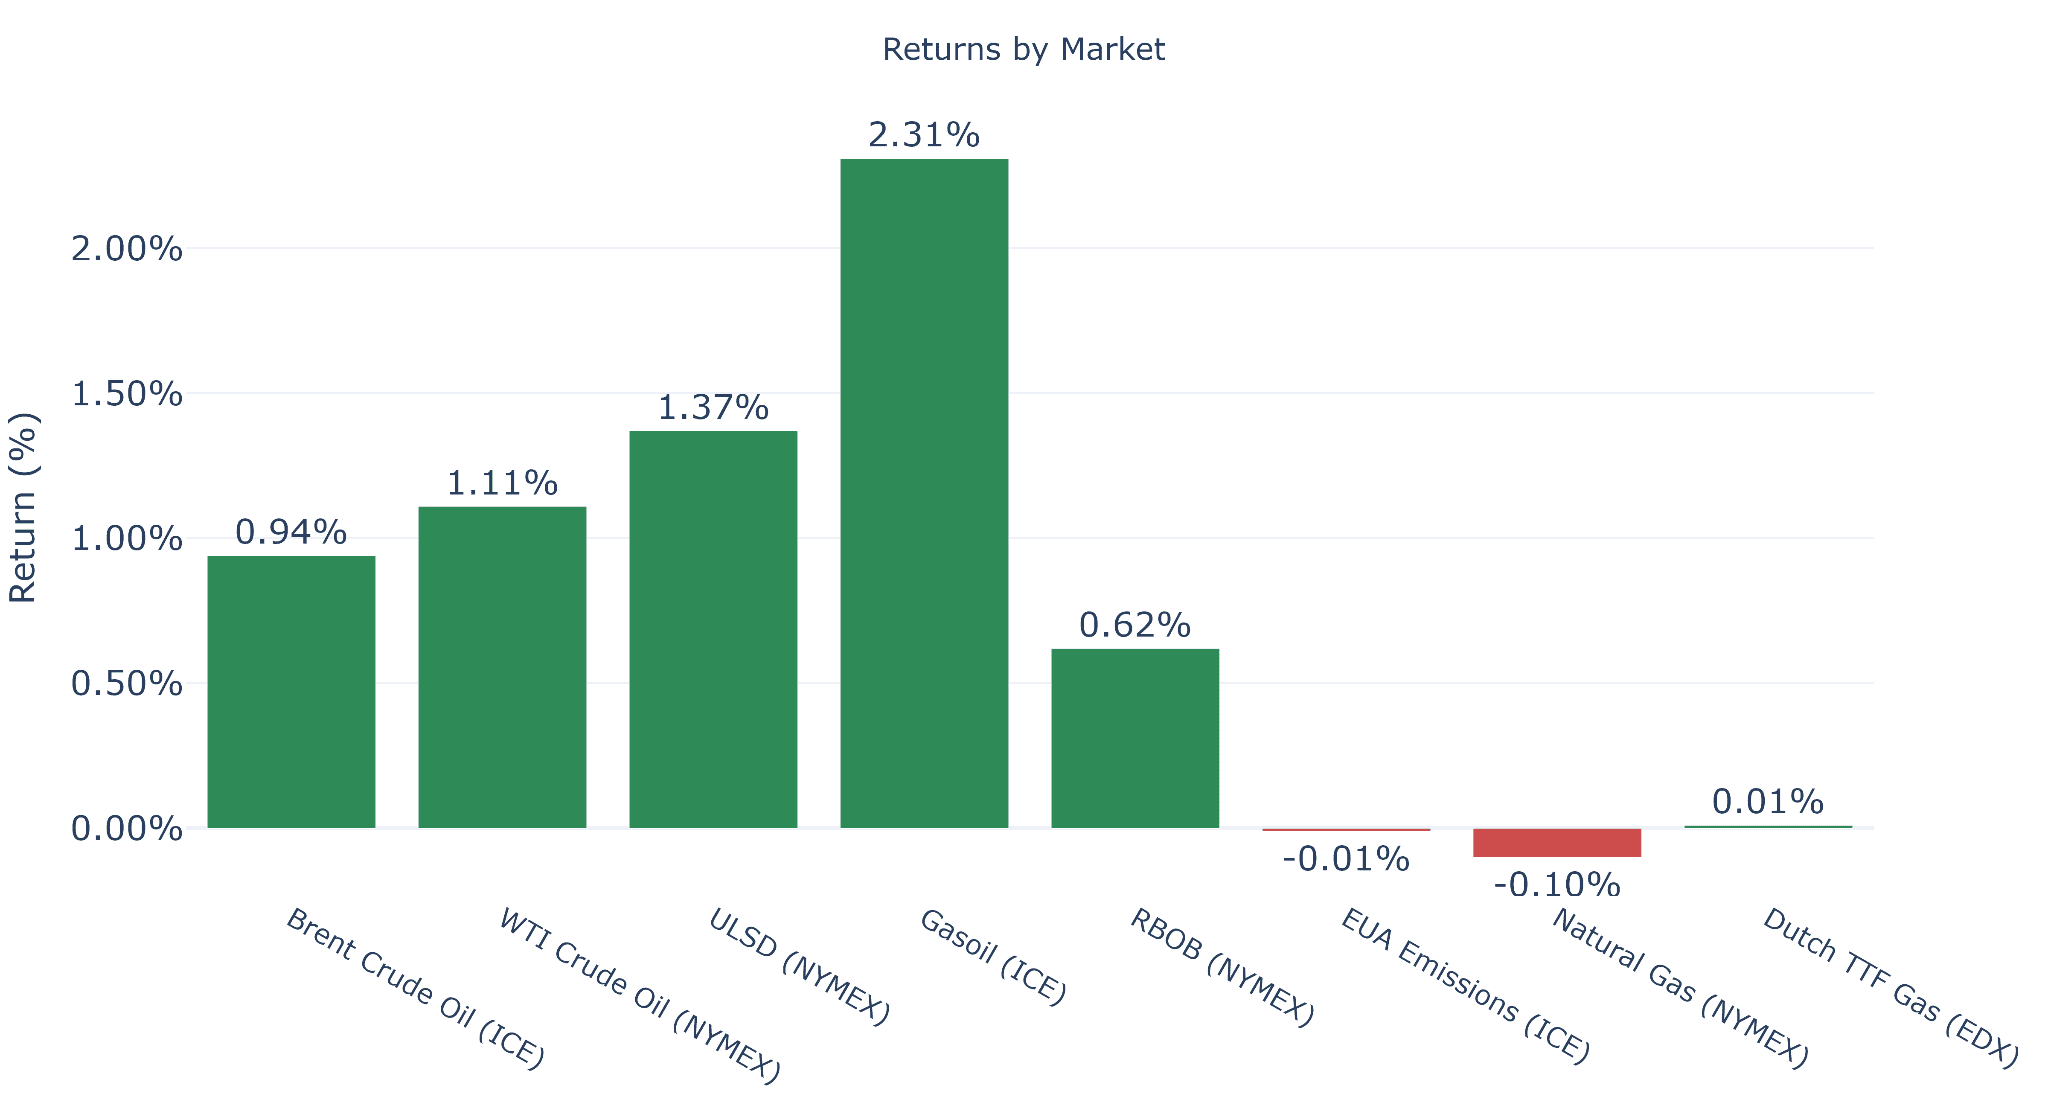
Energy: CTAs captured strong momentum across crude and products, building long exposure ahead of and during the Hormuz disruption
- Brent and WTI: Middle Eastern supply outages have reached 430 Mbbl as of April 10, providing structural support to markets previously expected to be oversupplied. CTAs pivoted aggressively, shifting from 91% short (early January) to 100% long by March 9 in both Brent and WTI, maintaining maximum long exposure until April 8.
- Gasoil and ULSD: Middle distillates were the most impacted across the barrel, with jet fuel tightness spilling over into Gasoil and ULSD. Trend CTAs increased Gasoil exposure from 9% short (Jan 8) to 100% long (Feb 27).
→ CTA returns in crude and products accelerated once the US/Iran war started (see comparison below).
- Henry Hub: No sustained trend emerged in US natural gas, limiting CTA participation. Geopolitical risk premia partially offset bearish fundamentals (strong supply and storage), keeping positioning more muted.
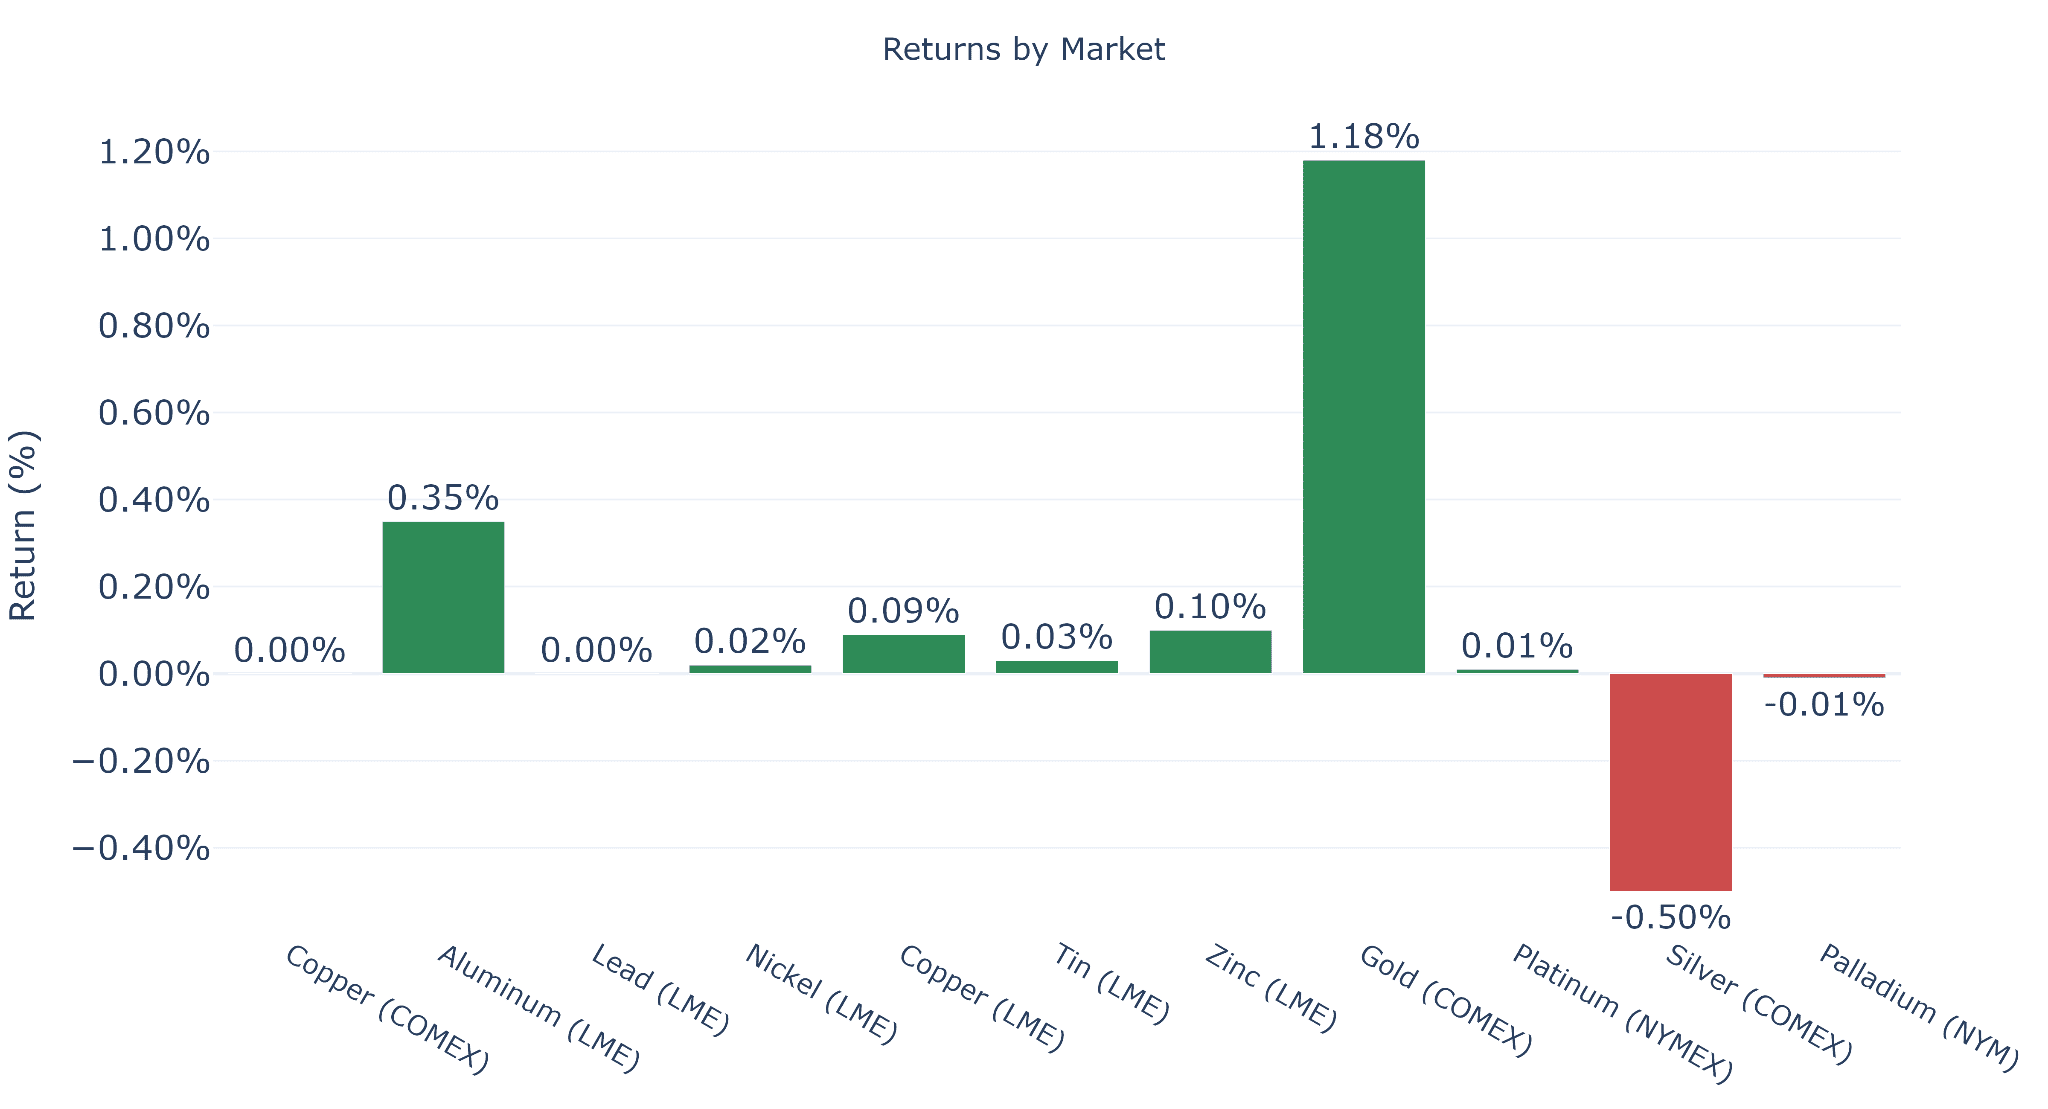
Metals: Solid CTA Q1 performance, with January rally offsetting subsequent weakness
Rate cut expectations drove a January rally that CTAs captured, but performance faded as the war and rising yields weighed on the complex:
- Gold: A milder late-January correction (vs. silver) allowed CTAs to retain long exposure and capture the subsequent rebound. However, a more hawkish central bank backdrop, coupled with strong CTA selling, pressured prices, with Trend CTAs flipping net short on March 19 for the first time in two years.
- Silver: Its dual precious/industrial role amplified downside from China growth concerns and higher yields. Trend CTAs reversed direction three times during Q1, weighing on performance.
- Base metals: CTAs captured Hormuz-driven upside in aluminium, supported by GCC exposure (~8% of global supply). In contrast, copper came under pressure from China growth concerns linked to Hormuz dependence .

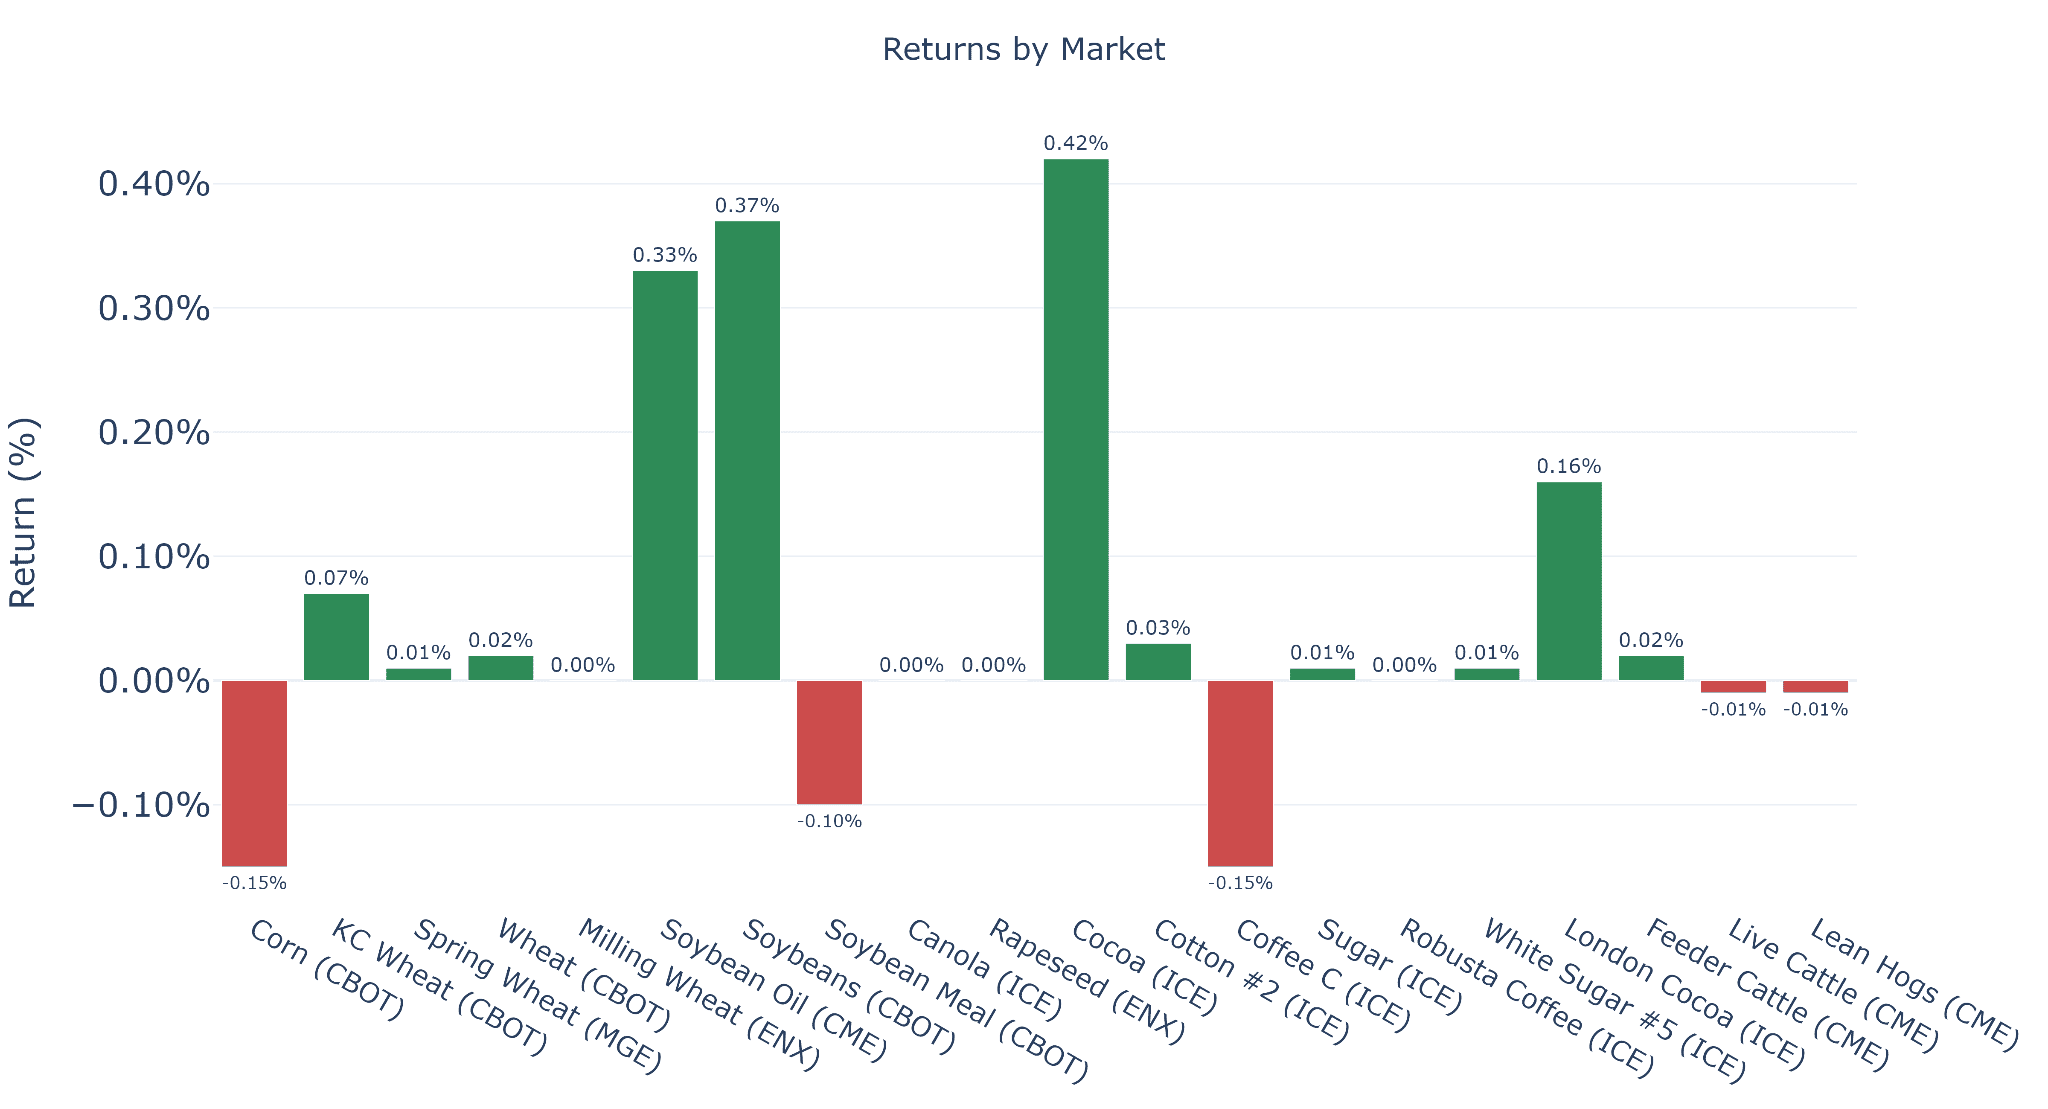
Ags/softs: CTAs navigated mixed and uneven trends across grains, softs, and live stock
- Soy complex: Expectations for higher US biodiesel mandates and export optimism (Chinese demand) drove bullish momentum in soybeans and soybean oil through mid-March. CTAs responded quickly, shifting from 27% short (Jan 6) to 100% long (Feb 6) in soybeans, and from 36% short (Jan 5) to 100% long (Jan 28) in soybean oil. Positioning was subsequently scaled back as prices weakened following delays to the US–China meeting. Soybean meal lagged, weighed by byproduct-driven oversupply prospects.
- Corn: Lack of a clear directional trend limited CTA performance, as fertilizer risks (Hormuz) offset expectations of still-elevated 2026 US acreage and increasing Argentine competition.
- Cocoa: Trend CTAs maintained 100% short positioning from Jan 12 to Mar 9, capturing the sharp ytd price decline in US cocoa. With discretionary participation fading, CTAs have become the dominant force, accounting for 96% of managed money net positioning as of March 31.
- Coffee: Improved Brazilian supply prospects versus persistent near-term tightness led to choppy price action, offering limited opportunities for trend-following CTAs.
Source (all charts): Kpler Financial Flows
Kpler Financial Flows
This report draws on Kpler Financial Flows. The full dataset delivers daily and intraday CTA positioning, order stacks, and flow estimates - allowing you to track systematic moves as they develop, rather than after the fact.
- Historical data back to 2014.
- 400+ market tickers across global markets.
- Signals with 0.8+ correlation to key benchmarks.

See why the most successful traders and shipping experts use Kpler