

Heavy CTA selling deepens oil time spread weakening on fragile US-Iran optimism
Oil time spreads weakened as CTA selling across crude and refined products amplified headline-driven optimism around a potential US-Iran deal.
Hopes of a breakthrough in US-Iran negotiations triggered a broad sell-off across crude and refined products late on May 21, weighing on both outright prices and time spreads. Systematic CTA selling added to the downside momentum.
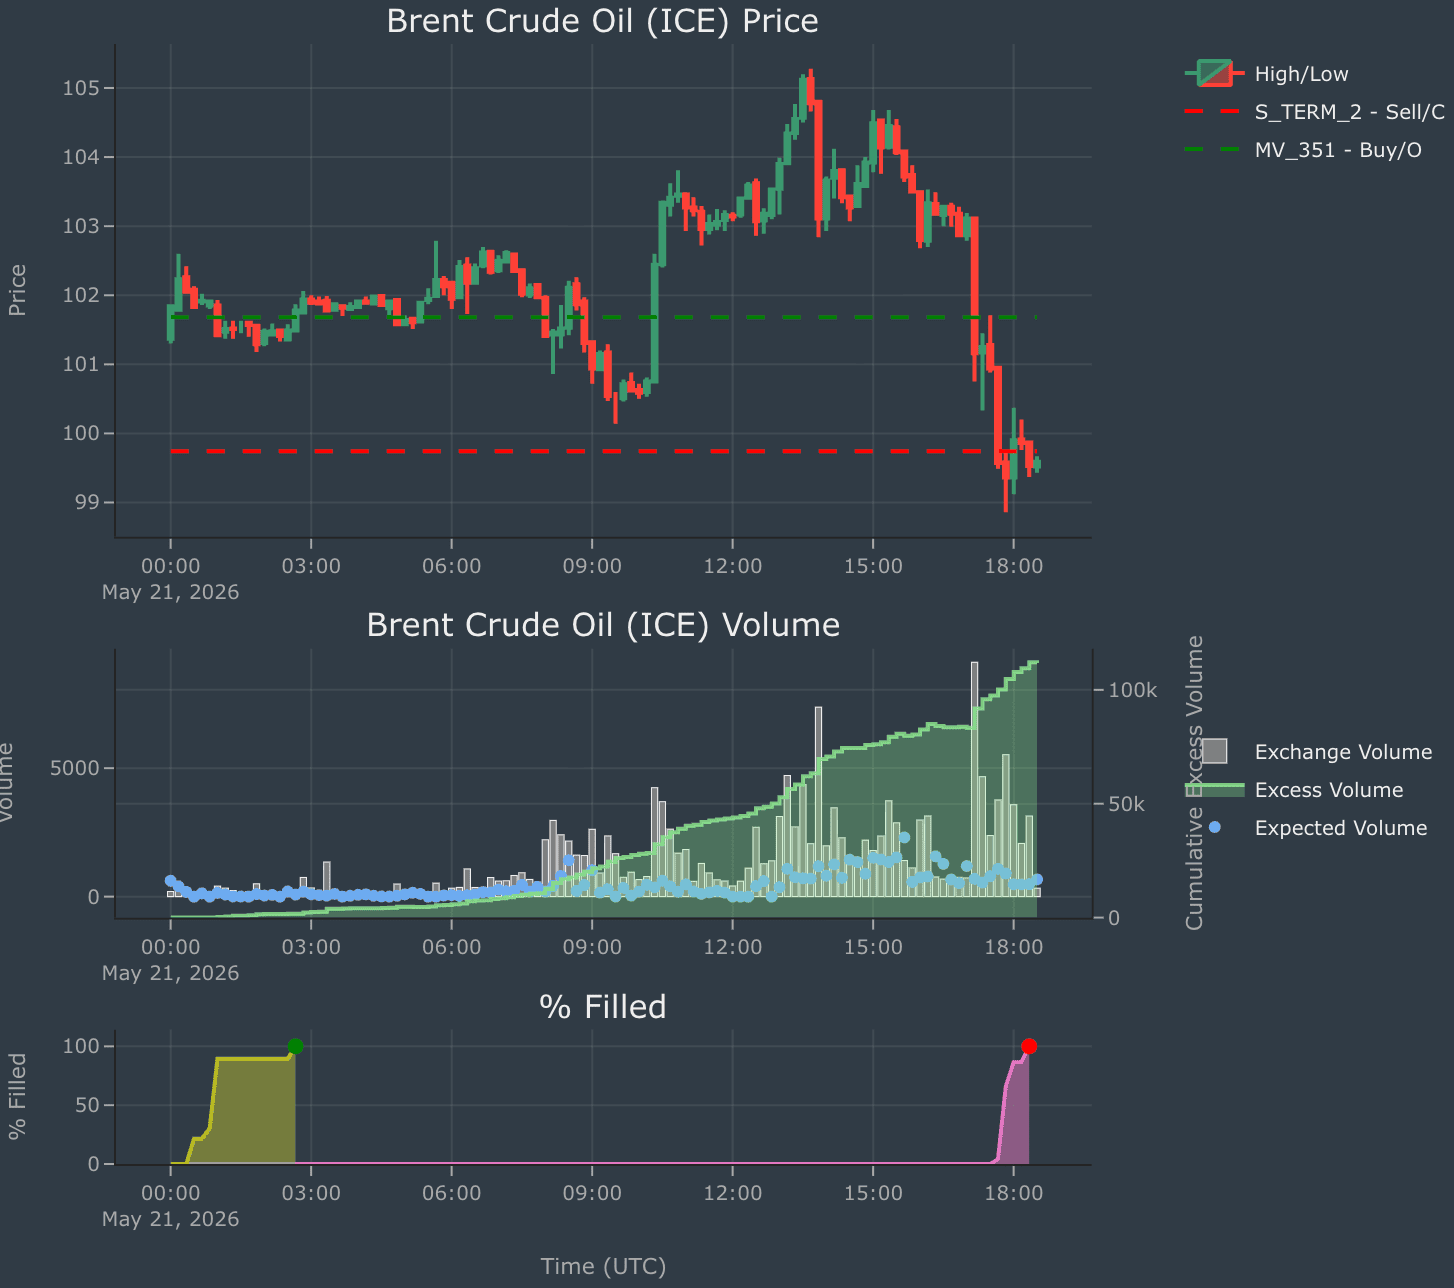
In Brent, Trend CTAs had remained 100% long since Apr 30. On May 21, one strategy (S_TERM_2) shifted to neutral by selling ~8,917 lots (Trend from 100% to 91% long). The same strategy could flip outright short with a sell trigger at $99.49/bbl. This Trend de-risking followed renewed selling by Reversion CTAs the previous day (from -71% to -86% short on May 20).
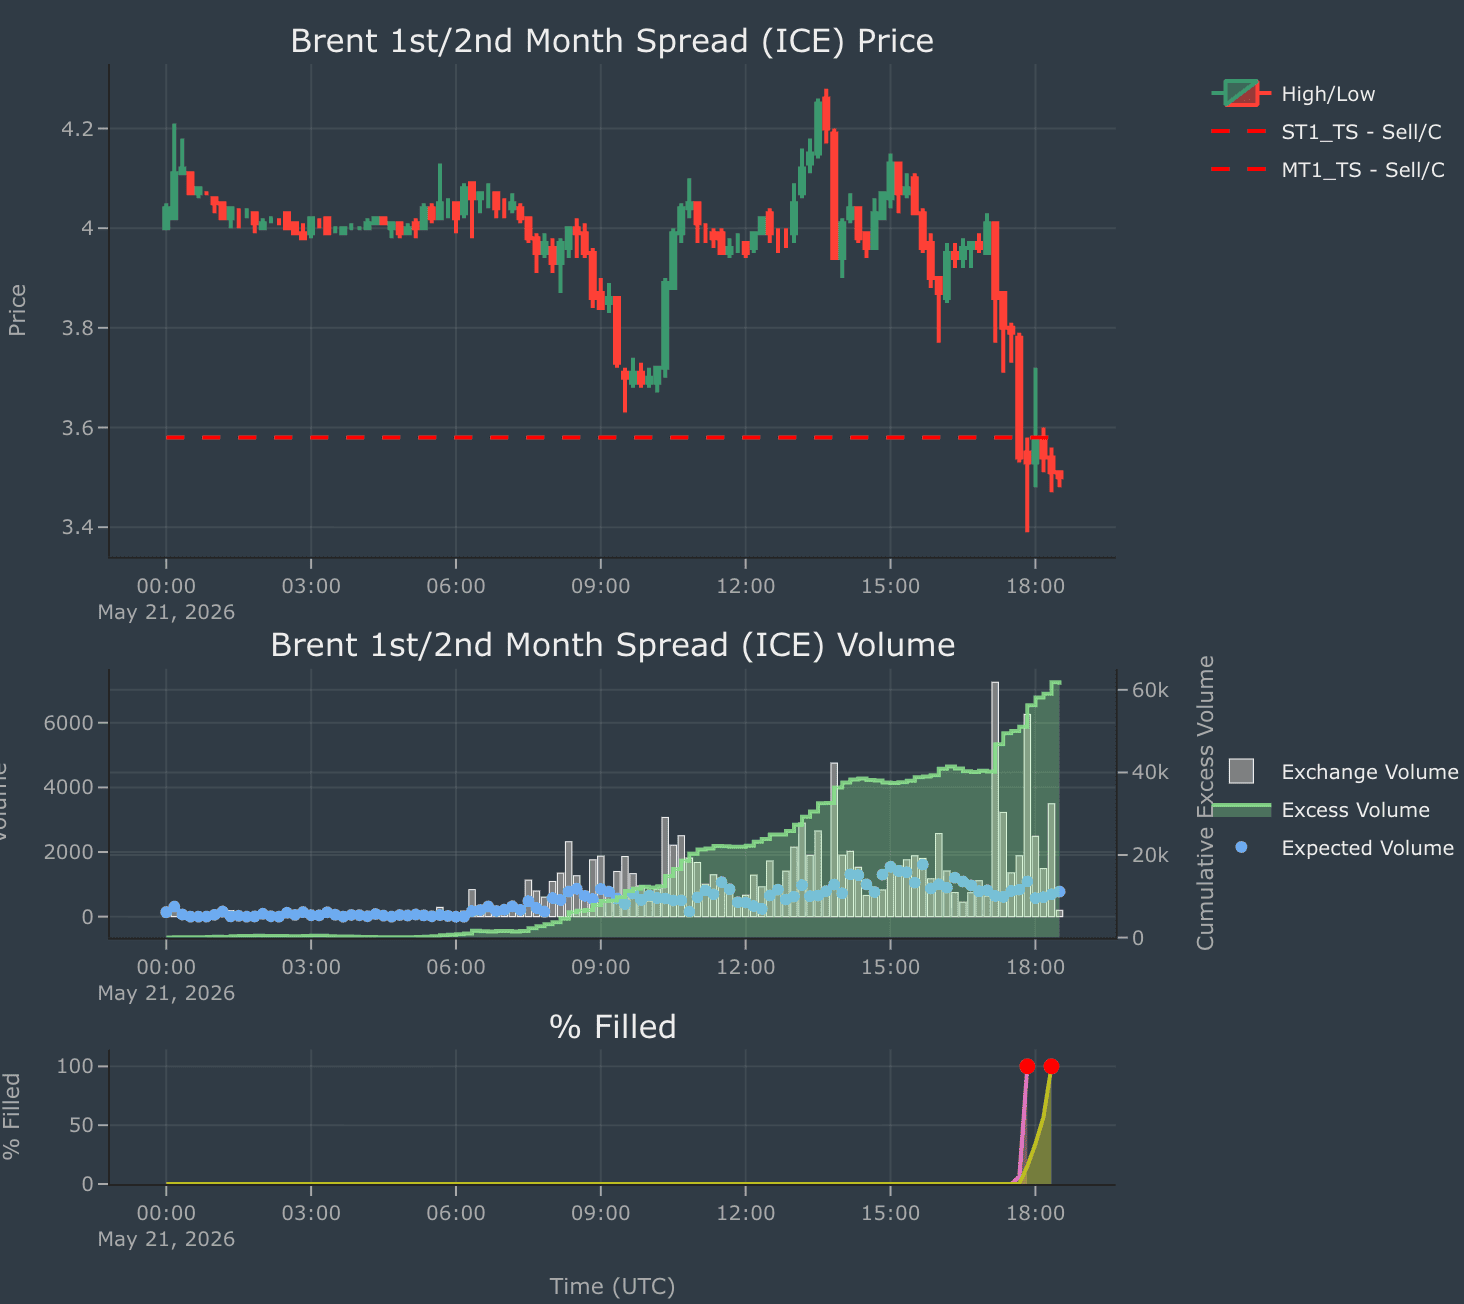
Brent M1/M2 backwardation narrowed by more than $0.50/bbl on May 21, with CTA selling adding further downside pressure once the spread breached $3.58/bbl (~11,530 lots across two strategies combined). CTA selling had already emerged on May 20 (~1,153 lots), leaving CTA positioning in Brent M1/M2 at just 12.5% long, the lowest level since Apr 27. Similarly, CTAs sold ~624 lots in the Brent quarterly spread after the spread traded through $8.17/bbl.
In WTI, the May 21 decline did not trigger Trend CTA selling, while Reversion CTAs reduced their short exposure from -71% to -43% during the session. We continue to see fundamental support from a tightening US crude balance and record-high US crude exports, even though US upstream activity keeps rising. Nevertheless, time spreads softened modestly, with declines in WTI M1/M3 and M2/M3 amplified by CTA selling of ~417 lots and ~324 lots, respectively.
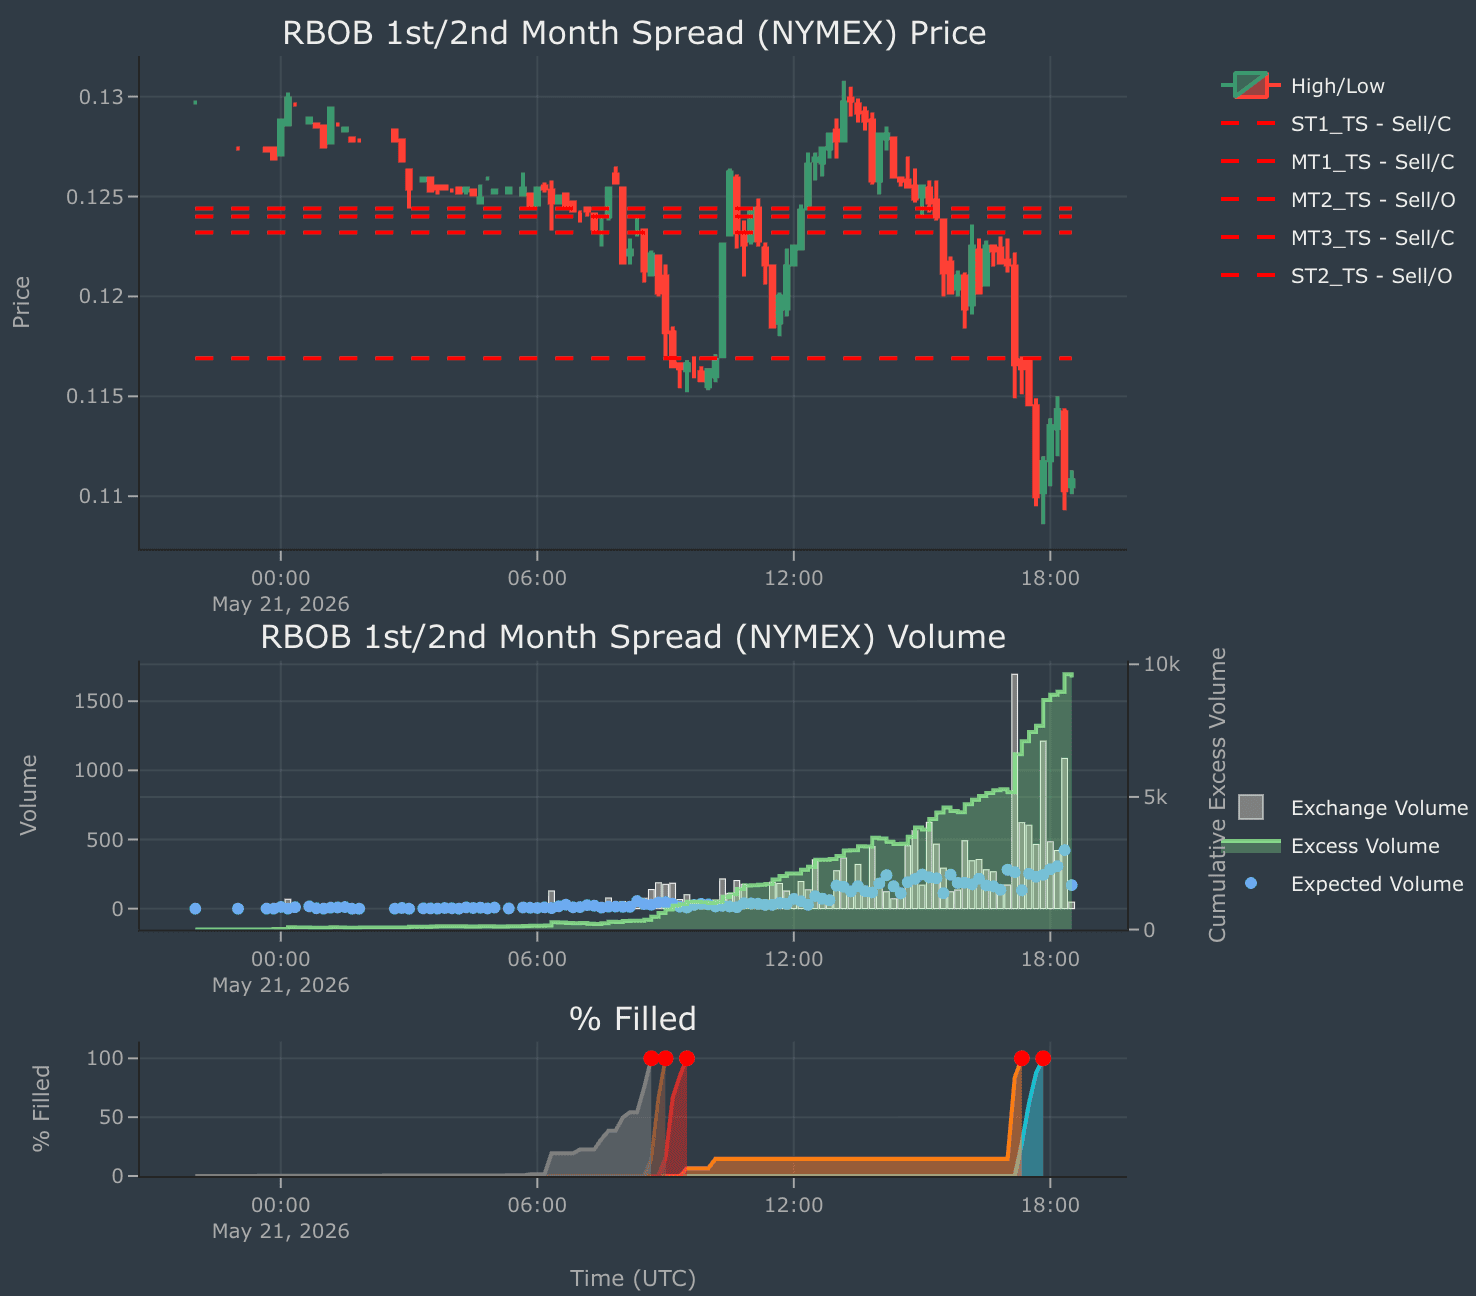
In RBOB, Trend CTAs have been 100% long since Apr 27 and sold ~1,424 lots on May 21 (Trend from 100% to 91% long). CTA activity was even more pronounced in time spreads. In RBOB M1/M2, five Trend CTA strategies were triggered, selling a combined ~3,580 lots, reinforcing the downside move. In M2/M3, two strategies de-risked (~324 lots sold), while one strategy reduced exposure in M1/M3 (~86 lots).
Source (all charts): Kpler Financial Flows
Our models did not indicate Trend CTA activity in ULSD (Trend 18% long) and European Gasoil (Trend 55% long) on May 21. However, the easing in ULSD backwardation was exacerbated by CTA selling of ~936 lots in M2/M3. In Gasoil M2/M3, two Trend CTA strategies sold a combined ~1,696 lots after the spread traded through $41.25/mt.

See why the most successful traders and shipping experts use Kpler