Real-time tools to enable faster, better decisions.


.webp)


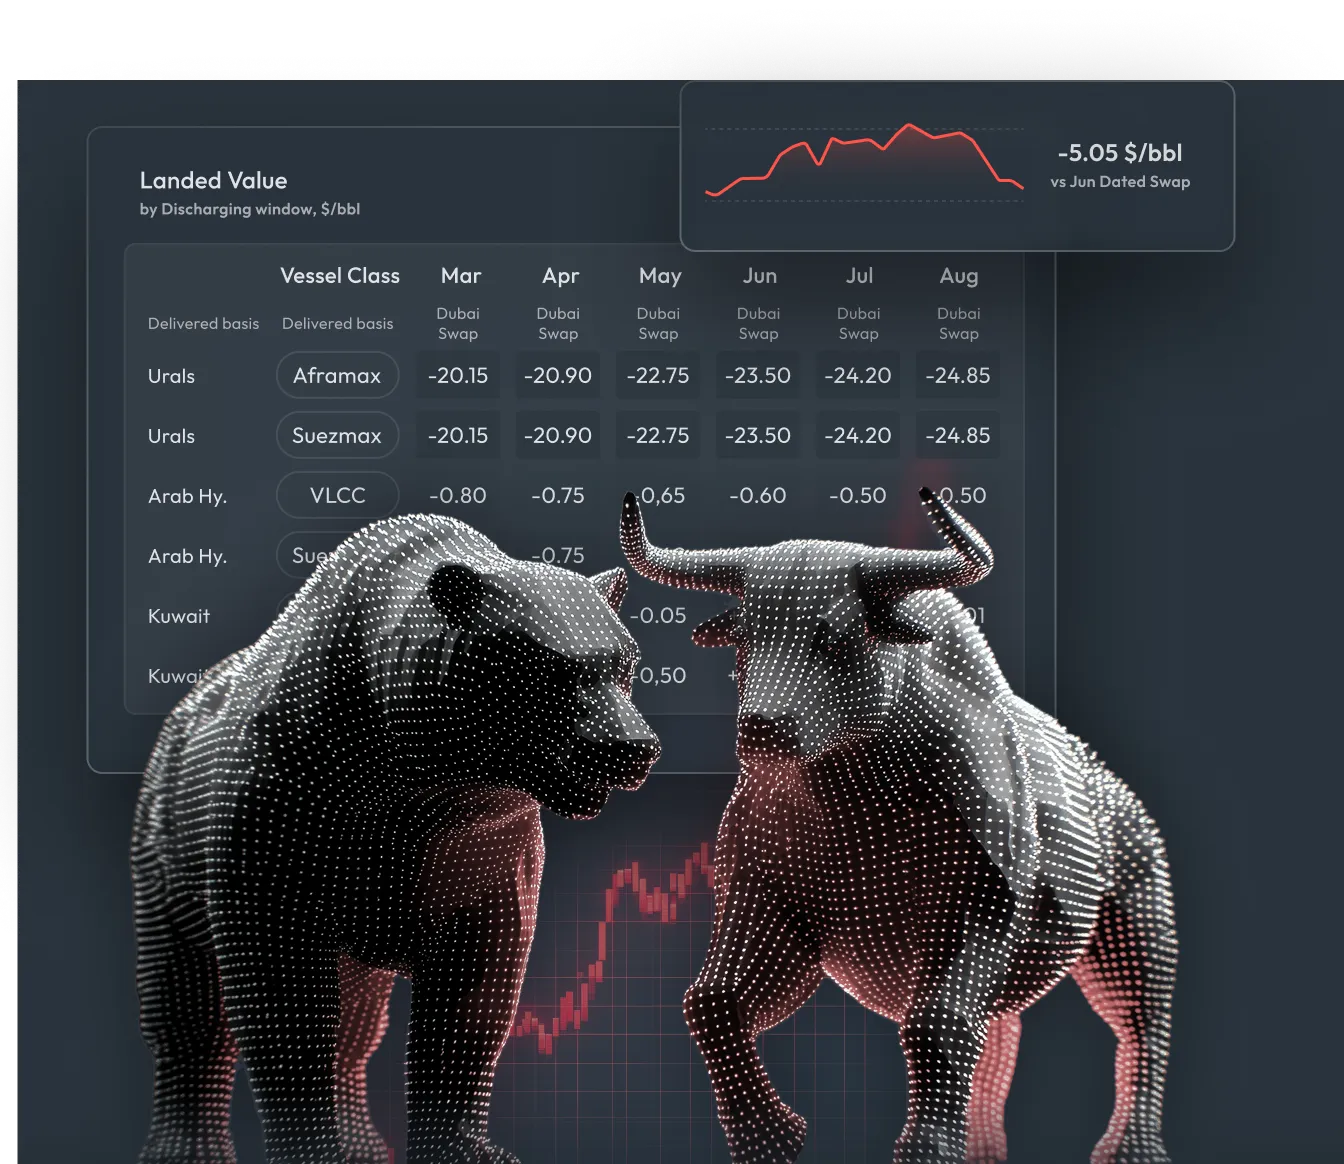
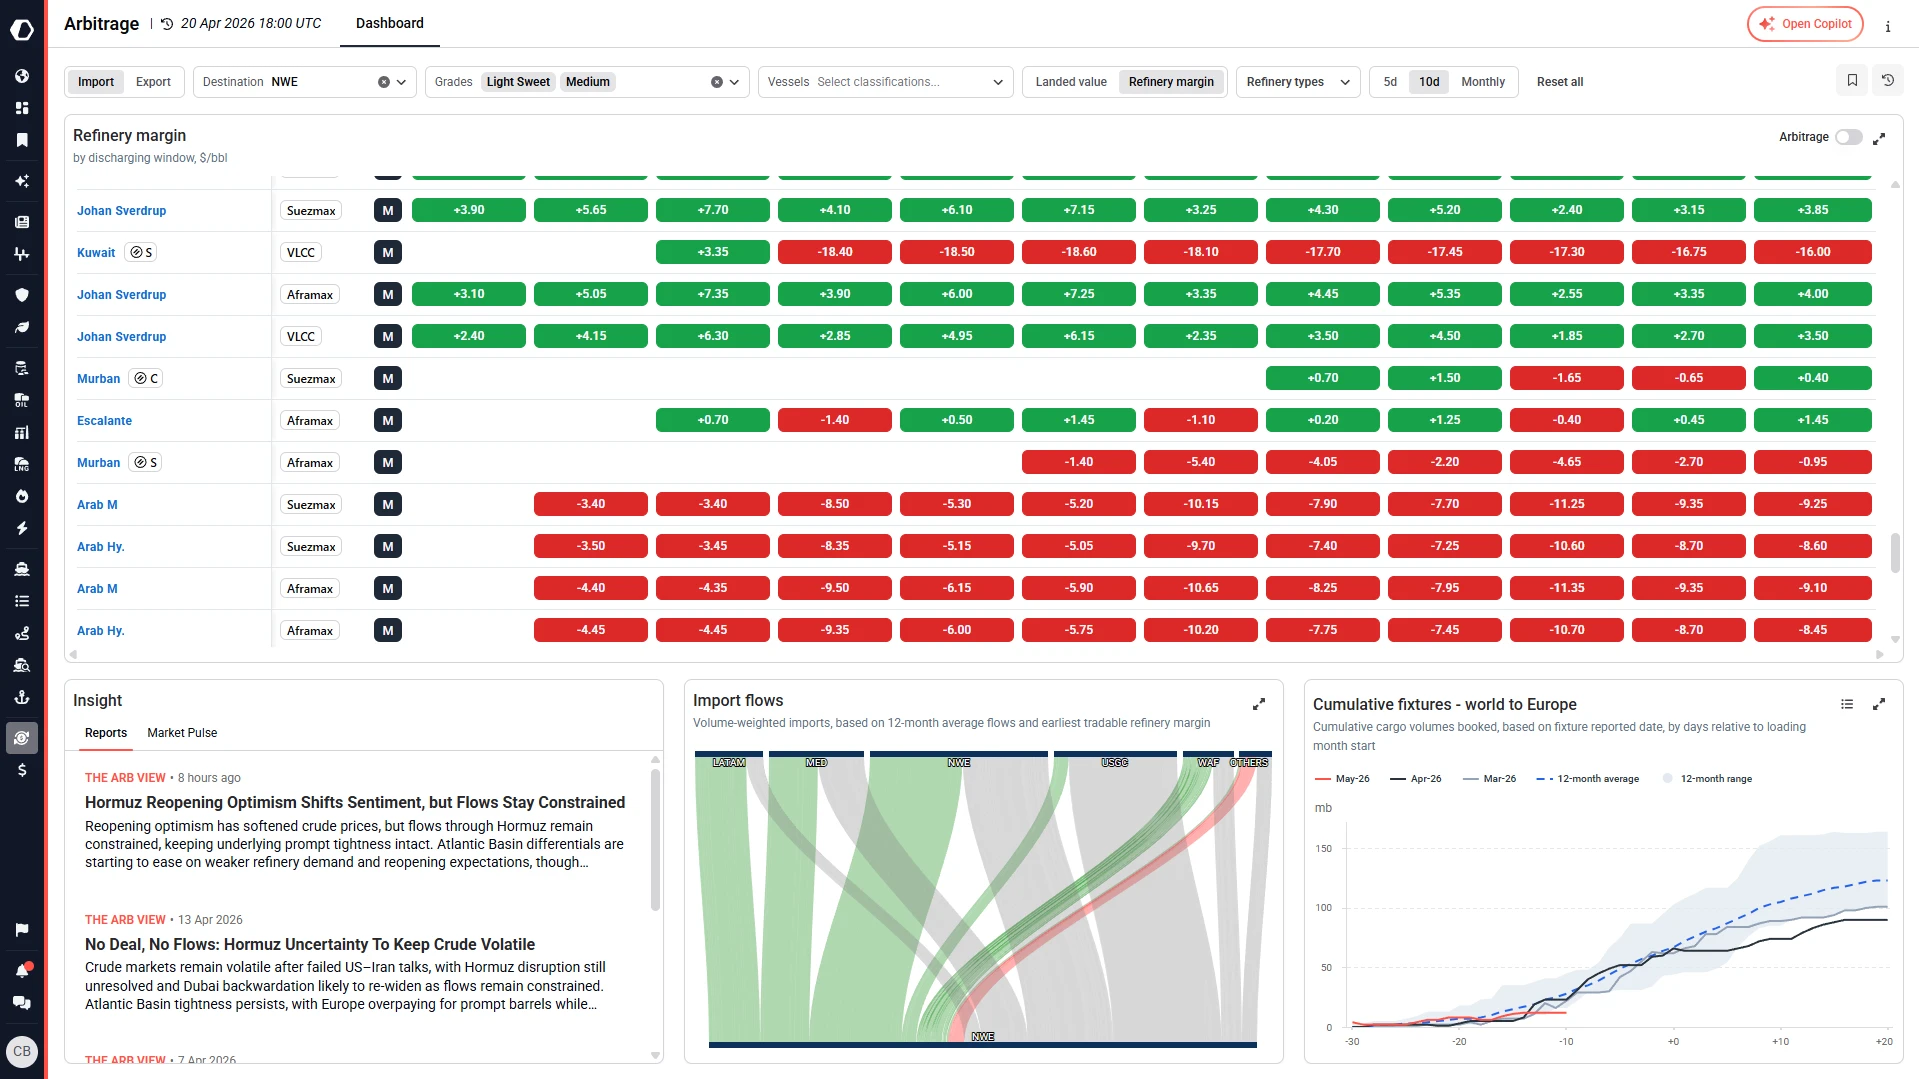
Kpler’s Arbitrage platform turns complex freight, quality, and benchmark data into simple, actionable arbitrage insights so you can discover value windows, rank opportunities, and build scenarios confidently.
With Arbitrage you can:
- Compare delivered crude values by region and freight cost
- Quantify refining margins and route profitability
- Spot open arbitrage opportunities quickly
- Breakdown value drivers like FOB differentials, spreads, and freight
- Model scenarios with custom market inputs
Financial Flows gives you a clear, real-time view of how systematic funds are positioned and trading across global markets.
With Financial Flows you gain:
- Real-time views of systematic fund positioning and activities
- Clear insights into the flow-driven forces behind price moves
- Early signals of potential market shifts and dislocations
- Translation of complex quantitative activity into actionable insights
- Better trade timing and risk management
.webp)

“Kpler is one of the few truly objective research outfits. No agenda, just data-driven insights.”


.webp)
FAQ
Real-time visibility into vessel movements, cargo flows, and inventory levels gives you advance signals on supply and demand shifts before they're reflected in market prices. By tracking actual physical movements—ships, containers, cargoes—rather than relying solely on financial indices, you can identify arbitrage opportunities, spot regional imbalances, and anticipate price movements with greater accuracy. This structured intelligence enables you to enter trades with better timing and conviction based on what's actually happening in the physical world.
Kpler provides comprehensive coverage across all major trading markets: crude oil, refined products, and NGLs in energy; natural gas and power analytics; agricultural commodities including grains and oilseeds; metals and dry bulk; containers and shipping; and emerging sectors. Each market gets unified, granular coverage across major and minor producing regions, allowing relative-value traders to analyze flows and spot opportunities across commodity complex spreads and inter-commodity relationships.
Kpler combines real-time data feeds (AIS vessel tracking, market prices, outages) with proprietary satellite imagery and customs intelligence to deliver decision-grade insights within hours of events occurring. Daily updates ensure you have the most current view of flows, inventories, and market movements, while advanced forecasting provides visibility up to 7 weeks ahead of customs data. This speed advantage is critical for capturing trading windows before they close.
Kpler offers flexible deployment options to fit your workflow: access data through the Kpler Terminal for direct research and analysis, use APIs to embed insights into proprietary trading systems, or integrate via Snowflake for enterprise-scale analytics. This means you can pull Fundamental Intelligence directly into your risk systems, pricing models, or trade recommendation engines without requiring infrastructure changes. Most trading operations use a combination—terminal for research, APIs for automation, and exports for reporting.
Traditional research is typically backward-looking, published after events have moved markets; Kpler is real-time and forward-looking. Most traders subscribe to fragmented point solutions—one for shipping, another for inventories, another for customs—creating blind spots at the intersections. Kpler provides a unified platform that connects assets, flows, and events across your entire trading scope, reducing blind spots and enabling analysis of cross-commodity relationships that point solutions can't reveal. A single source of truth beats managing ten different vendors.