


Hormuz risk and winter restocking keep LNG bid
Military strikes continue to disrupt traffic through the Strait of Hormuz, keeping global LNG supply tight going into the early days of the shoulder season. With less that 2 months until the start of the traditional withdrawal season, Europe has begun to more heavily procure LNG to ensure adequate storage ahead of winter, with LNG prices steadily increasing in response.
Market & trading calls
European TTF front-month price outlook: Slightly Bullish, as ongoing planned maintenance in Algeria and Norway will continue to restrict pipeline supply, while LNG imports are expected to edge lower into next week amid emerging competition from Asia and the Americas. On the demand side, a temporary decline in temperatures during the first half of next week will weigh on cooling needs in Southern Europe. However, an expected drop in wind generation across the continent will likely keep gas-fired generation supported w/w. We anticipate intra-European competition for LNG to continue as countries seek to continue injecting into UGS facilities ahead of the winter period.
Asian LNG front-month price outlook: Slightly bullish, as renewed Strait of Hormuz escalation, rising TTF, and firmer winter procurement interest increase competition for supply. The mid-September front-month rollover could provide additional support as pricing shifts further into the tighter winter delivery period. Bangladesh replacement buying, stronger Indian demand, and resilient Southeast Asian gas burn add further support, partly offset by softer immediate demand from Japan and South Korea and limited discretionary Chinese buying at elevated prices. Below-seasonal Chinese inventories limit the downside, while Hormuz uncertainty, winter procurement interest, and the approaching rollover leave price risks skewed higher over the coming week.
Asian LNG – TTF spread outlook: set to remain stable, as both Asian LNG and TTF are expected to be slightly bullish next week. Over the last week, TTF widened its premium to Asian LNG with the spread trading at -$2.38/MMbtu on 9 September, compared to -$1.23/MMbtu on 2 September.
US Henry Hub front-month price outlook: Stable, as forecasts of below-average temperatures across the northern US in late September offset the impacts of robust underground gas storage levels and rising LNG feed gas demand.
Key natural gas and LNG front-month prices ($/MMBtu)
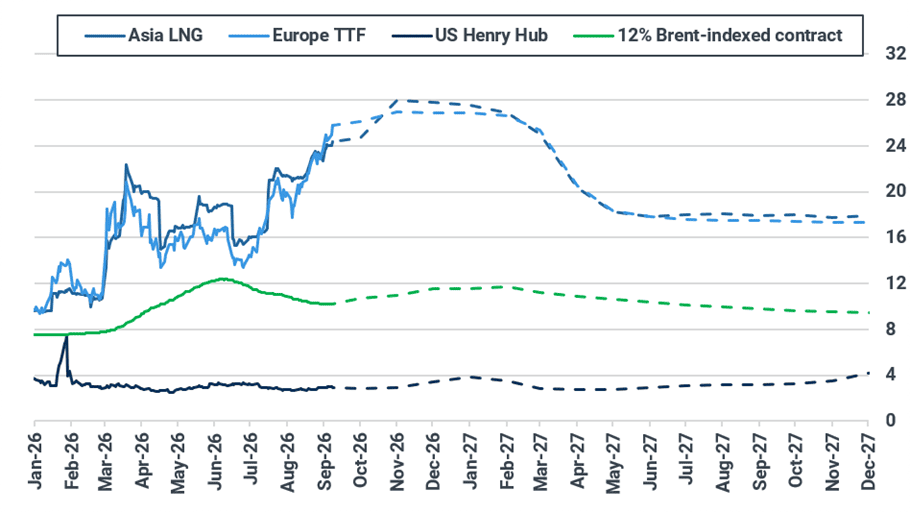
Source: ICE, NYMEX. Brent-indexed price represents 12% slope of 90-day moving average of Brent contract.
Asian LNG-TTF front-month spread ($/MMBtu)
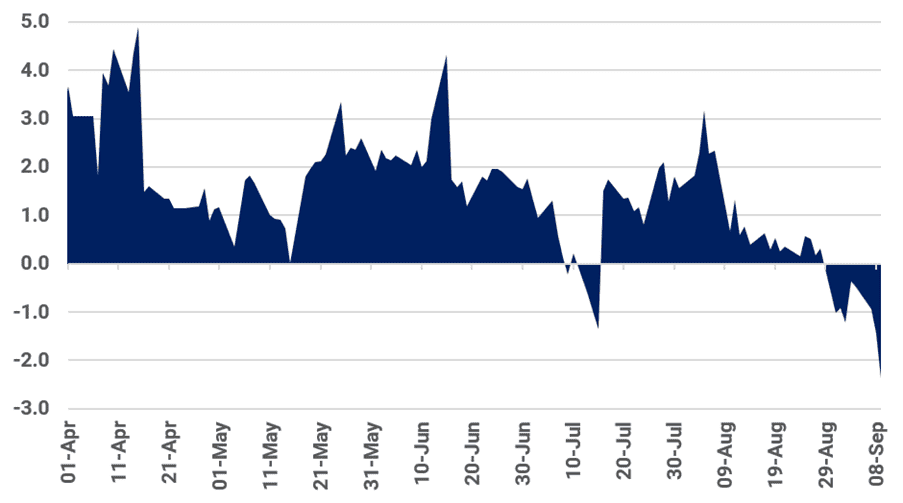
Source: ICE, Kpler Insight
Europe: Conflict escalation, limited supply, and low wind generation to keep TTF on a bullish trend into next week
The European TTF front-month contract rose last week, settling at $27.06/MMBtu on 9 September, up 8.3% from $24.99/MMBtu on 2 September. Prices continued to climb, supported by escalating tensions in the Middle East following US attacks on Iranian tankers and subsequent retaliation by Iran. Fundamentally, intra-European competition for LNG supply persisted amid planned maintenance that curtailed pipeline supply and heatwaves that increased gas-fired generation in the Iberian Peninsula and Italy, pushing prices higher. Additionally, emerging demand in parts of Asia and the Americas also provided price support, as European buyers sought to continue injecting into underground gas storage facilities ahead of winter.
Looking ahead, Kpler Insight maintains a bullish outlook on the TTF front-month contract for next week. Ongoing planned maintenance in Algeria and Norway will continue to restrict pipeline supply, while LNG imports are expected to edge lower into next week. On the demand side, a temporary decline in temperatures during the first half of next week will weigh on cooling needs in Southern Europe. However, an expected drop in wind generation across the continent will likely keep gas-fired generation supported w/w. Increased winter procurement activity in parts of Asia will also contribute to higher European prices in the coming days.
EU-27 net pipeline imports fell w/w to an estimated 2.78 bcm (-8.9% w/w). The decline was driven by lower Algerian flows into Italy (a risk we flagged last week) and a drop in UK flows via the INT amid ongoing planned maintenance. Looking ahead, Kpler Insight expects net pipeline imports to decline next week, as planned maintenance is anticipated to reduce Algerian exports via Tunisia from 16 September onwards, while additional maintenance at Troll & Kollsnes will further reduce Norwegian exports. Additionally, lower wind generation and a temporary drop in UK temperatures could divert some Norwegian supply to the island at the expense of flows to the EU.
Norwegian flows to the EU + UK (bcm)
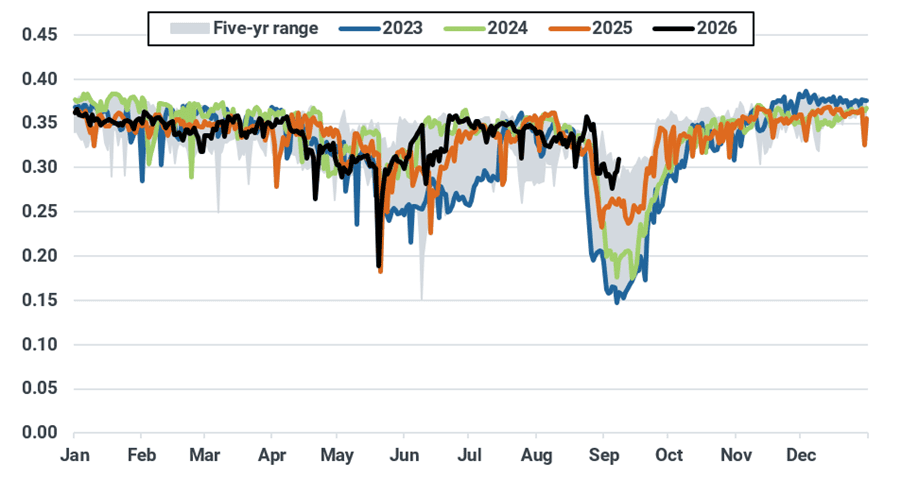
Source: ENTSOG
GASSCO scheduled unavailability for fields and processing plants (mcm/d)
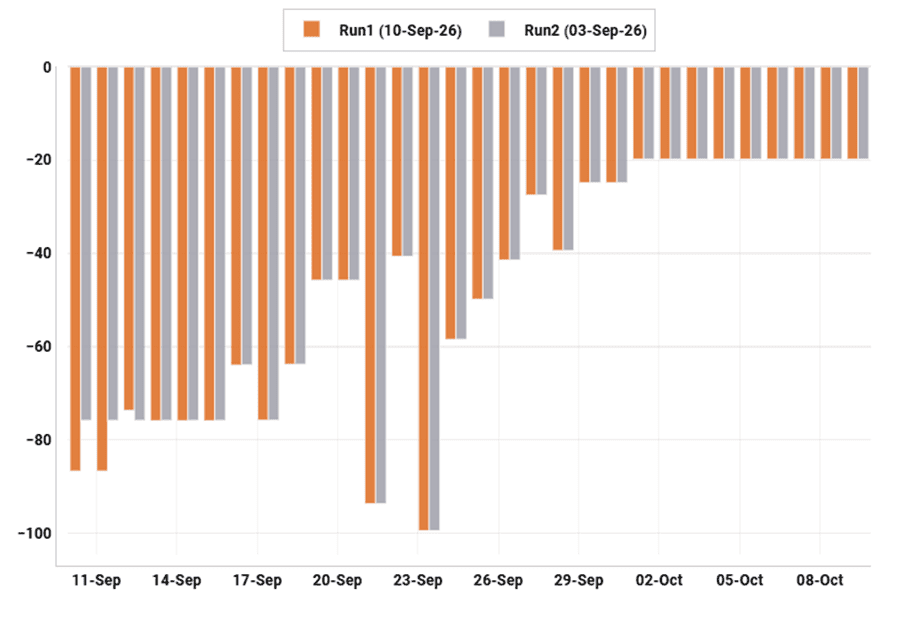
Source: GASSCO, on 10 September 2026, 15:00 UTC
European LNG imports declined by 19.4% w/w to an estimated 1.7 mt, as lower arrivals into Northwest Europe (-0.18 mt) and the Mediterranean (-0.13 mt), alongside no deliveries into the UK and Turkey, offset gains in Iberia (+0.08 mt). The decline likely reflects the mid-August drop in Atlantic Basin supply as maintenance at several export facilities curtailed loadings, rather than weaker European LNG economics. Europe remains highly competitive for uncommitted cargoes, with TTF widening its premium to JKM over the past week and NWE DES trading at a $0.68/MMBtu discount to TTF on 9 September. These economics have supported two recent diversions from Brazil and Egypt towards Europe. Looking ahead, Kpler Insight expects imports to edge lower next week, before recovering in H2 September as Atlantic Basin maintenance ends and favourable import economics continue to attract flexible cargoes.
European weekly LNG imports by region (mt)
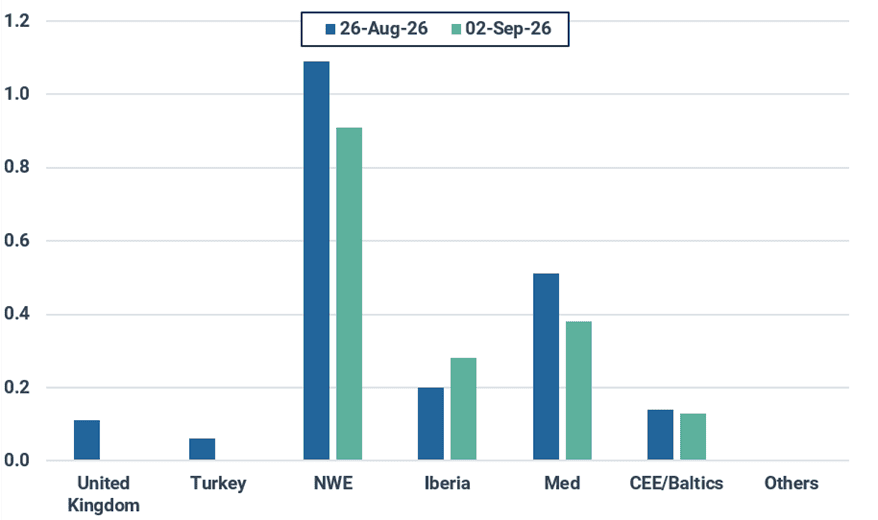
Source: Kpler Insight. Data represents week commencing 02/09 and 26/08. NWE=FR, BEL, NL, GER. Iberia=ESP, POR. Med=ITA, HVR, GRE. Baltics/CEE=FI, LT, POL. Others=SWE, MT.
Aggregate local distribution consumption across 16 EU countries increased by 5.2% w/w to an estimated 1.01 bcm but remained below the three-year seasonal range for a 12th consecutive week, as temperatures across most of Europe remained towards the upper end of the five-year range. Looking ahead, Kpler Insight expects local distribution consumption to edge lower, as upward revisions to temperature forecasts, particularly in Northwest and Southern Europe, limit upside for heating demand.
EU-16 weekly consumption in the local distribution sector (bcm)
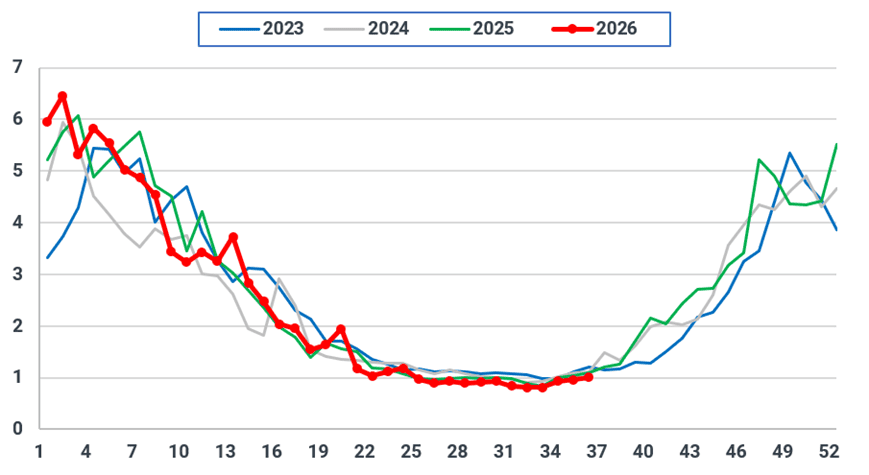
Source: ENTSOG, ENAGAS, Eustream, AGCM, Kpler Insight. The EU-16 perimeter includes AT, BE, DE, CZ, FR, HU, GR, IT, NL, LU, PL, PT, RO, SL, SK, and ES.
EU-25 gas-fired generation increased by 8% w/w to an estimated 6.7 TWh, supported by a 5.8% increase in total power demand. Gains were again concentrated in Southern Europe (+20% w/w), where higher temperatures lifted CDDs by 9.2%. Weaker wind (-1.5% w/w) and hydro (-6.3% w/w) generation in EU-25 also created further room for gas in the power mix. Looking ahead, Kpler Insight expects gas-fired generation to edge higher as forecasts point to rising temperatures across Northwest and Southern Europe, while wind generation remains at or below the five-year average. A drier September outlook keeps hydro output muted.
EU-25 weekly gas-fired generation (TWh)
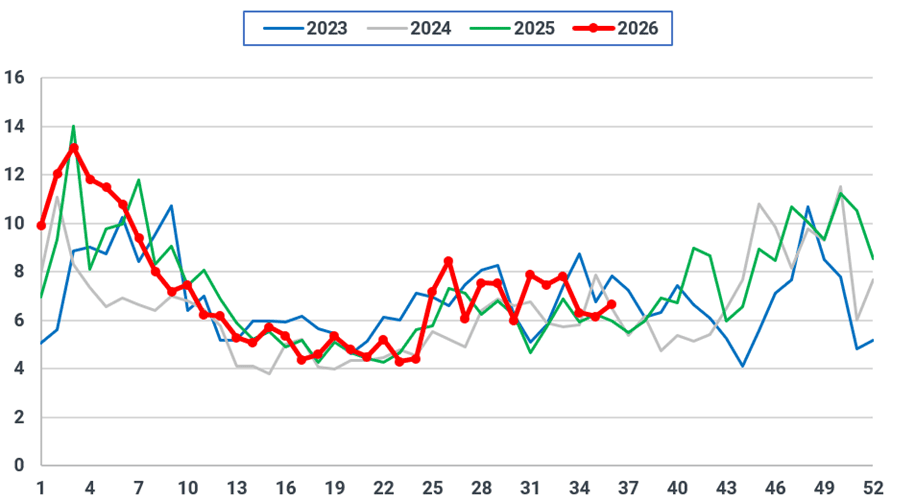
Source: Kpler Power, Kpler Insight.
Northwest Europe average daily temperature forecast (°C)
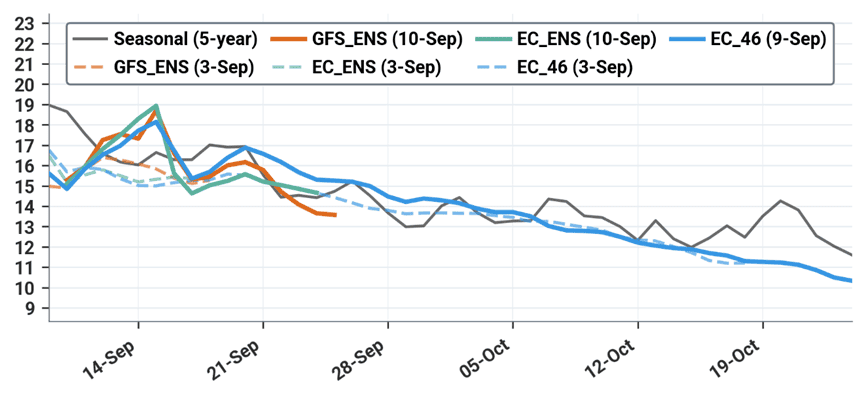
Source: Kpler Insight. Run comparison 10/09 (solid) vs. 03/09 (dotted), 00:00 UTC. Seasonal is a five-year average. NWE includes France, Belgium, Netherlands and Germany.
Southern Europe average daily temperature forecast (°C)
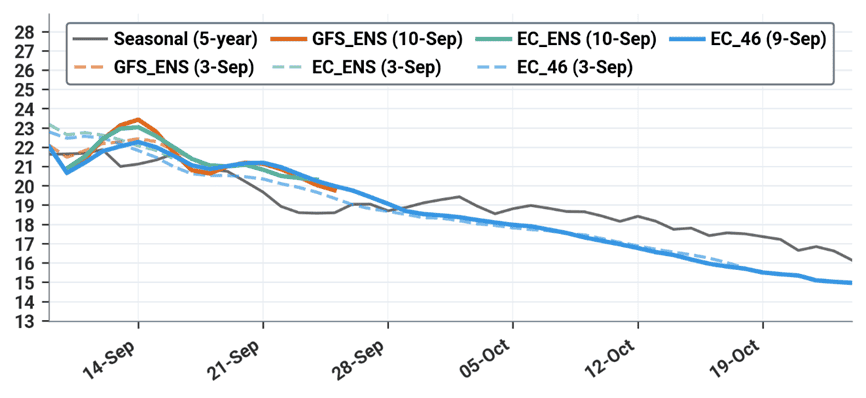
Source: Kpler Insight. Run comparison 10/09 (solid) vs. 03/09 (dotted), 00:00 UTC. Seasonal is a five-year average. Southern Europe includes Portugal, Spain and Italy.
EU-27 underground gas storage levels rose to 67.3% full as of 8 September 2026, up 1.7% w/w. Average daily net injections eased to an estimated 0.25 bcm/d (-0.05 bcm/d w/w), as higher gas-fired generation and lower pipeline and LNG imports reduced volumes available for storage. Despite the slowdown, cumulative net injections continue to rise steadily, contrasting with the typical early-September slowdown in previous years (see chart below), as ongoing restocking needs sustain injection demand. Looking ahead, Kpler Insight expects injection rates to edge lower as maintenance across several EU-27 entry routes curtails pipeline supply, while robust gas-fired generation further limits volumes available for storage. Meanwhile, the TTF front-month premium to Winter 26 narrowed to €1.33/MWh.
EU-27 net cumulative UGS injections since 1 April (bcm)
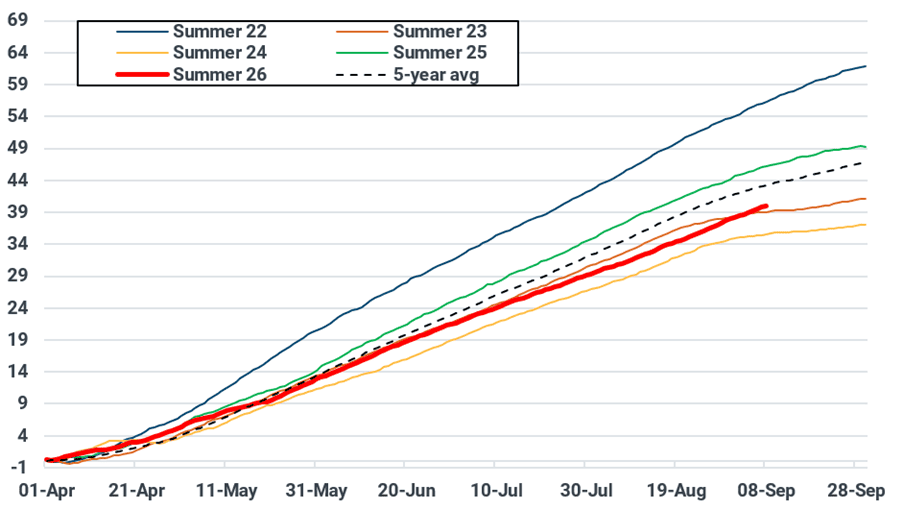
Source: GIE, Kpler Insight. Latest data as of 08 September 2026.
Asia: Hormuz risks and winter procurement keep LNG prices supported
Asian LNG prices rose to $24.69/MMBtu on 9 September from $23.76/MMBtu on 2 September, as increasing tensions surrounding the Strait of Hormuz lifted the geopolitical risk premium, while increased winter procurement interest increased competition for cargoes.
We remain slightly bullish on prompt Asian LNG prices over the week ahead. Renewed Strait of Hormuz escalation and rising TTF provide the main upside, while firmer winter procurement interest, Bangladesh replacement buying, stronger Indian demand, and resilient Southeast Asian gas burn add support. The mid-September front-month rollover could provide additional support as pricing shifts further into the tighter winter delivery period. Softer immediate demand from Japan and South Korea and limited discretionary Chinese buying provide an offset, while below-seasonal Chinese inventories limit the downside. Hormuz uncertainty, winter procurement, and the approaching rollover leave price risks skewed higher.
Replacing lost Qatari supply becomes more challenging heading into Q4. Non-Qatari supply offset around 91% of the 9.9 mt y/y decline in Qatari deliveries to major Asian markets during July–August, with flexible US LNG providing the largest replacement source. However, constrained Qatari exports and higher TTF increase competition with Europe for flexible Atlantic cargoes. If Chinese spot buying returns while Indian and Southeast Asian requirements remain firm, Asia will need to bid more aggressively for marginal supply.
Cooler-than-seasonal temperatures across most key Asian markets should soften LNG demand over the coming week. Temperatures in Japan, South Korea, eastern and southern China, and Thailand are forecast to come in below seasonal norms, while India and northern China remain broadly seasonal. Lower cooling requirements should limit gas-fired generation and near-term LNG buying.
Forecasted average temperatures for Asian countries (°C)
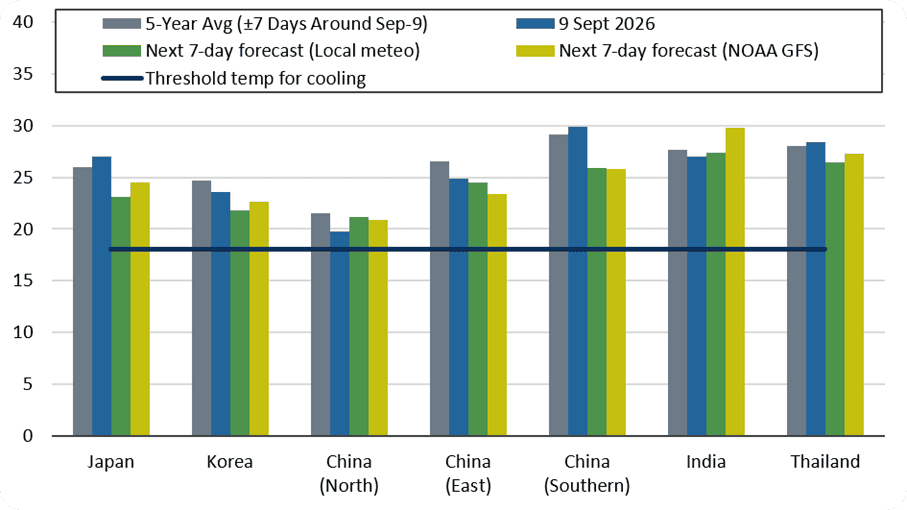
Source: Meteostat, Kpler Insight. As of 10 September 2026 00:00:00 UTC. Population-weighted average temperature of selected major cities across a country is shown for both historical and forecast.
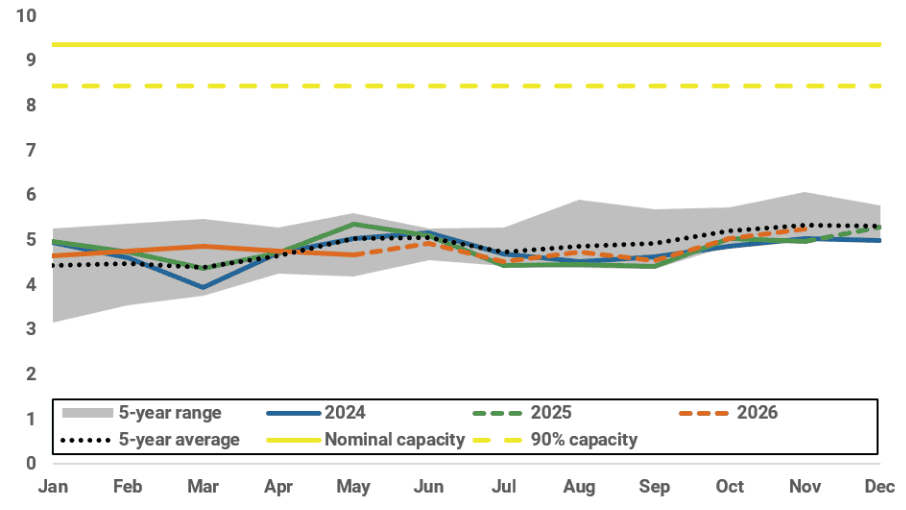
Japan should remain a limited competitor for prompt LNG cargoes as high inventories and cooler weather reduce restocking requirements. Major power utility inventories rose 2.5% w/w to 2.43 mt as of 6 September, 34% above last year and 19% above the five-year average for end-September, despite LNG imports falling to 0.99 mt from 1.56 mt w/w. Power demand fell 10% w/w to 102 GW and gas-fired generation dropped 21% to 4.9 TWh. Japan imported 5.3 mt in August, down 0.3 mt y/y. High inventories should limit September–October buying, although inventory tightness in some utility regions and the Ohi 3 nuclear outage provide some upside risk.
Japan implied total LNG inventory forecast (mt)
Source: METI, Kpler Insight
Year-on-year changes in power generation by fuel type in Japan (TWh)
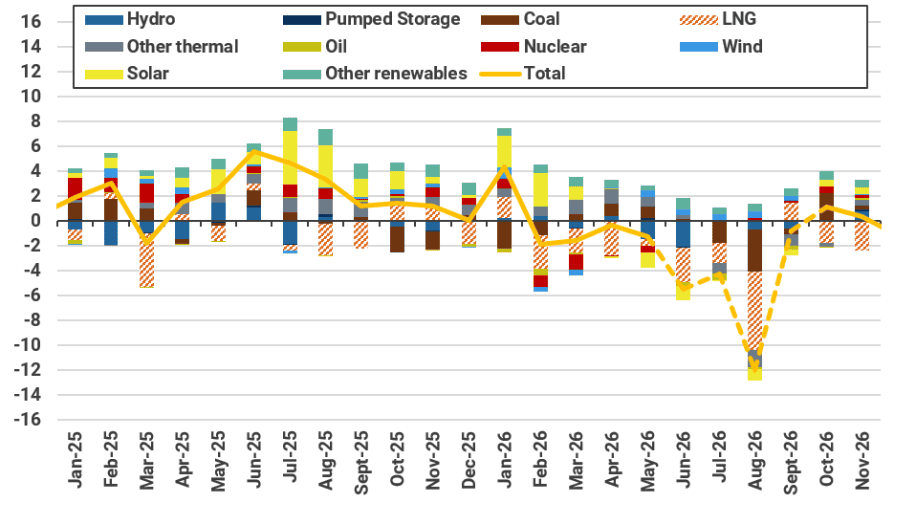
Source: METI, Occto, Kpler Insight. Note: LNG-fired and coal-fired generation for June–August 2026 is reported by Occto. Kpler Insight forecasts for all other generation sources begin in August 2026.
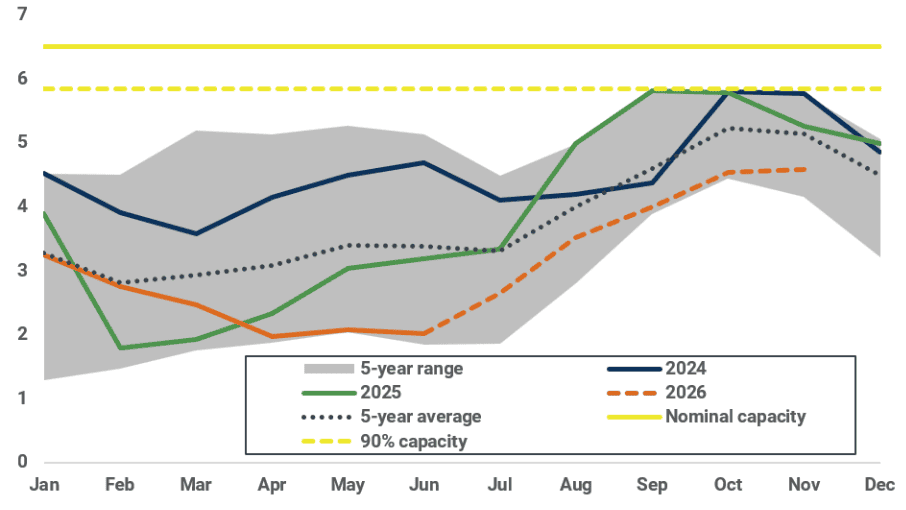
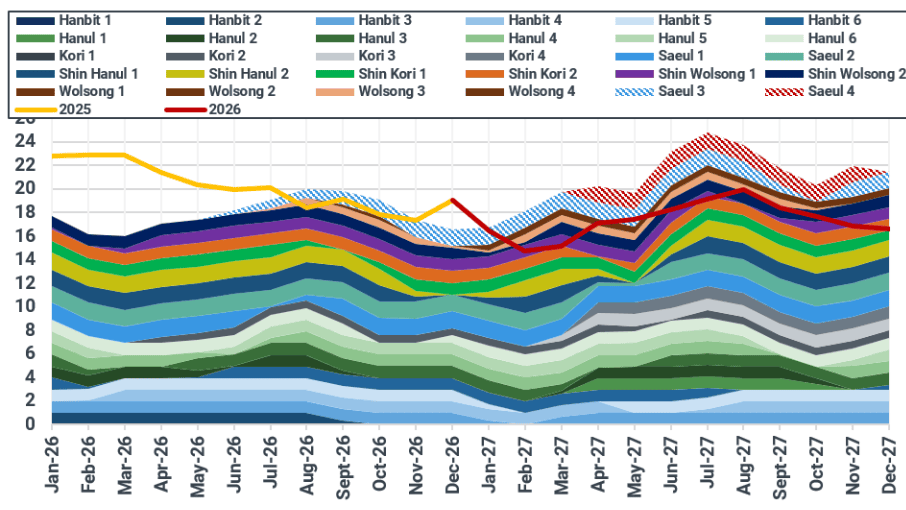
South Korea’s immediate LNG demand remains soft, but winter procurement interest provides support further along the curve. KOGAS August sales fell to 2.12 mt, with power-sector sales down around 16% y/y to 1.4 mt as gas-fired generation declined to 17 GW from 17.6 GW in July. Higher coal burn and improved nuclear availability displaced LNG, while August imports fell 1.4 mt y/y to 3.7 mt. However, lower-than-expected inventories and nuclear availability risks are increasing the focus on winter supply security. Market indications point to Korean buyers seeking additional November–January supply, although the scale remains uncertain.
South Korea monthly implied LNG inventory (mt)
Source: Kpler Insight, KESIS
Korea’s monthly nuclear availability by unit (GW)
Source: KESIS, Kpler Insight
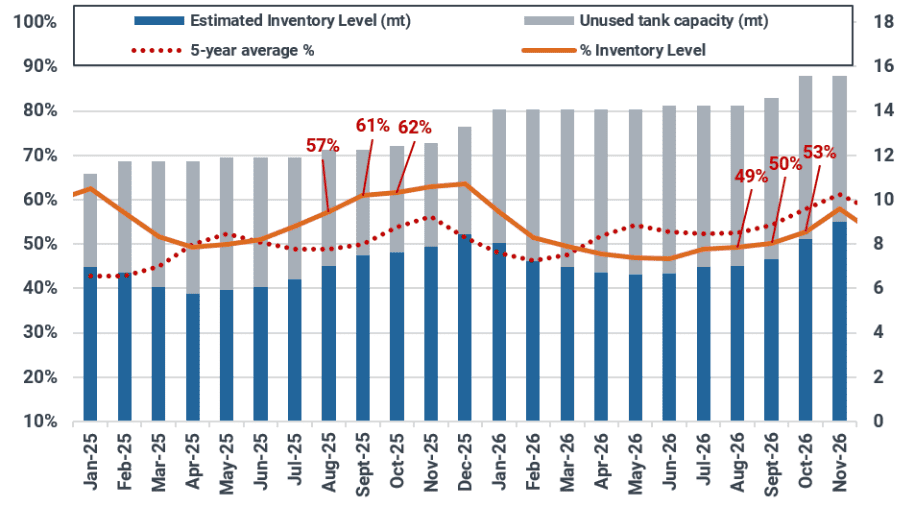
China’s below-seasonal coastal inventories limit downside risk, but elevated spot prices continue to deter aggressive restocking. China imported 5.3 mt in August, down 1.1 mt y/y, while coastal inventories stood at around 7.1 mt, or 49% full at end-August. Weaker macro-driven gas demand and softer LNG truck sales, alongside recovering domestic production, also reduce the urgency for spot procurement. China is therefore unlikely to drive near-term price upside, but low inventories leave buyers more exposed to a supply or demand shock.
China implied total LNG inventory vs terminal capacity (LHS: % of nominal capacity; RHS: mt)
Source: Kpler Insight
South Asian prompt LNG demand remains uneven, with India and Bangladesh engaging in replacement buying while Pakistan remains reluctant to procure at current prices. India’s tighter domestic gas balance and resilient city gas and fertilizer demand are sustaining LNG requirements, while US cargoes have helped replace lost Qatari supply. Bangladesh is seeking 6 October cargoes on top of 2 already awarded at $26.67–28/MMBtu. Pakistan, by contrast, saw 2 September tenders go unawarded at $26.70–27/MMBtu as strong coal and hydro generation reduce LNG requirements. India and Bangladesh provide the main regional prompt support, while Pakistan remains highly price sensitive.
Southeast Asian LNG demand remains resilient despite elevated spot prices. The region imported 1.9 mt in August, up 0.1 mt y/y, led by Thailand, Malaysia, and Vietnam. Thailand imported 0.9 mt as stronger electricity demand, constrained coal generation, limited domestic gas supply growth, and weaker hydro availability sustained LNG requirements. Indonesia is seeing stronger gas-for-power burns amid weaker hydro and hotter weather, while limited hydro availability and firm electricity demand are keeping Malaysian gas-fired generation elevated. Tightening domestic gas balances and power-sector requirements therefore keep Southeast Asia one of the more resilient sources of prompt Asian LNG demand.
US: Henry Hub to remain below $3.00/MMBtu as temperature forecasts indicate a cooler end to September
US Henry Hub front-month prices settled at $2.81/MMBtu on 9 September, down from $2.99/MMBtu on 2 September. After losing momentum last Thursday as storage results came in near consensus estimates, Henry Hub ended the week at $2.97/MMBtu as temperature forecasts trended hotter for mid-September. Over the weekend, a sharp reduction in power burns from cooler-than-expected temperatures in the central US saw prices fall to $2.91/MMBtu. Henry Hub extended losses on Wednesday as weather forecasts began to show widespread below-average temperatures across much of the northern US for the final third of September.
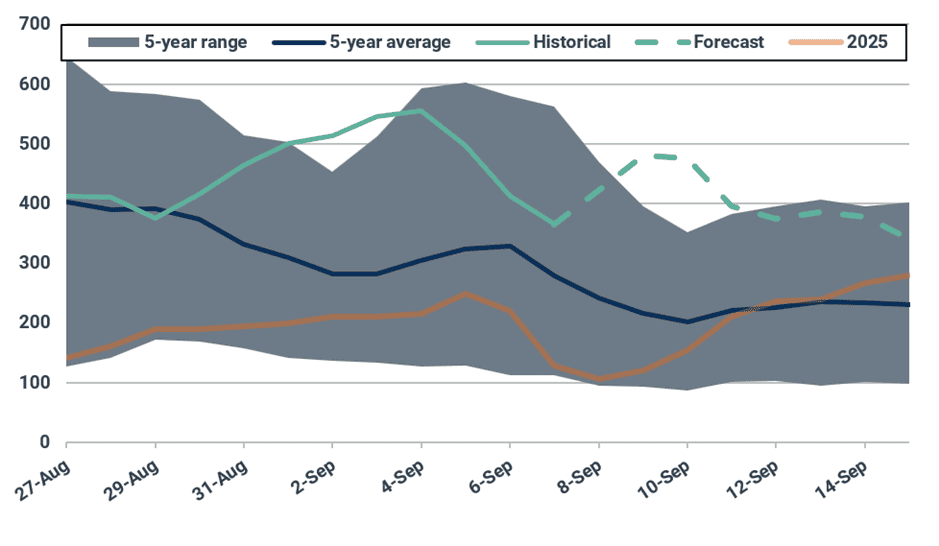
Despite projections indicating that this September may become the hottest on record in terms of total cooling degree days, robust storage levels, elevated gas production, and cooler temperatures later in the month are expected to keep prices contained below $3.00/MMBtu. Kpler Insight expects prices to remain rangebound between $2.80-3.00/MMBtu for the coming week.
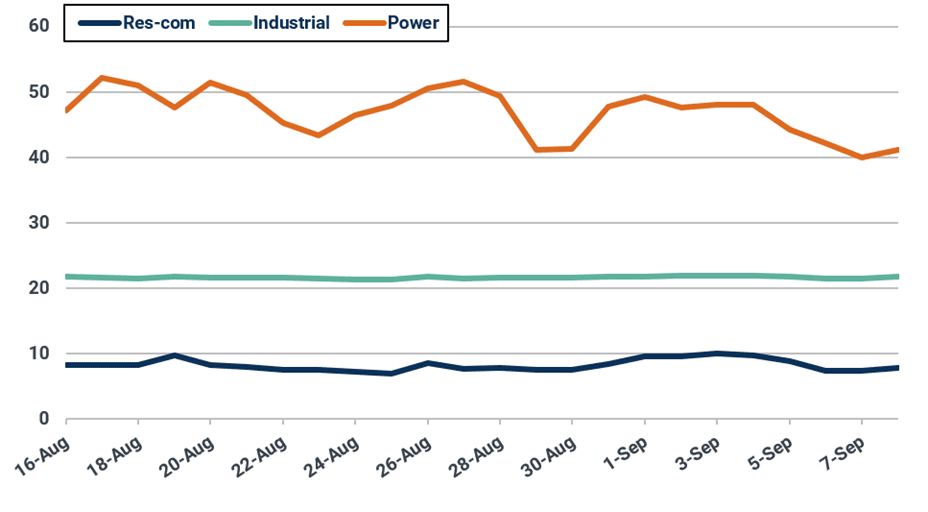
US domestic gas consumption by sector (bcf/d)
Source: EIA
US gas consumption averaged 74.8 Bcf/d over the last seven days, a 2.2 Bcf/d reduction from the previous week. Milder temperatures in the central and eastern US reduced the call on natural gas in the power sector over the weekend, with burns dropping as low as 40 Bcf/d. Temperatures are anticipated to increase in the coming days, bringing power demand back closer to 45 Bcf/d going into the weekend.
Forecast of cooling degree days
Source: National Weather Service
Dry gas production averaged 112 Bcf/d over the past week, flat with the previous week. Despite the recent chipping away of the gas storage surplus, producers are likely to keep output stable in the coming week. Kpler Insight expects production to remain near current levels going into next week.
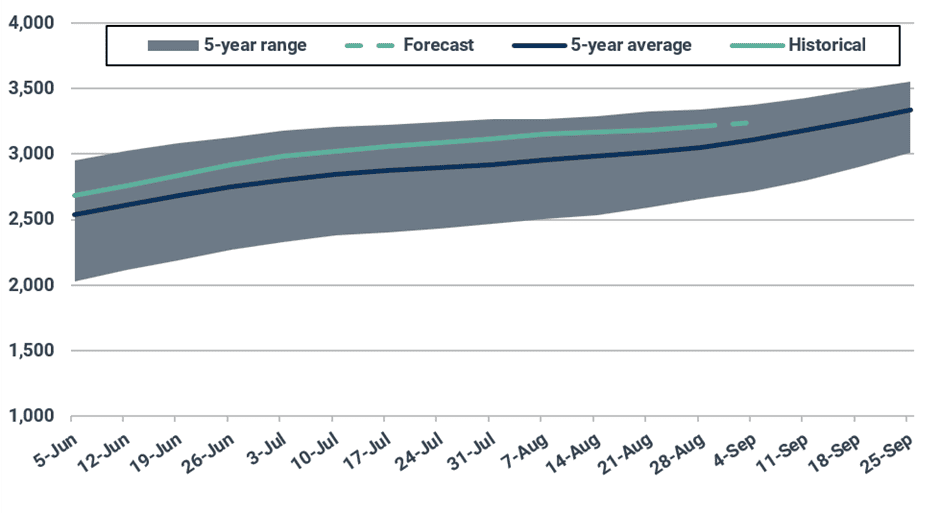
Forecast of natural gas volumes in underground storage (bcf)
Source: EIA, Kpler Insight
The US injected 30 Bcf into underground storage for the week ending 28 August, in line with consensus estimates, though well-below the year-ago build of 67 Bcf. Inventories grew to 3,214 Bcf, reducing the surplus to the 5-year average from 5.5% to 5.2%. The next 1-2 builds are likely to come in below both year-ago and historical average levels, though as demand falls in late September, injections are likely to accelerate. Kpler Insight forecasts a net injection of 31 Bcf for the week ending 4 September.
Global LNG supply: US recovery offsets a 13-week low in South-East Asia, Gulf remains shut
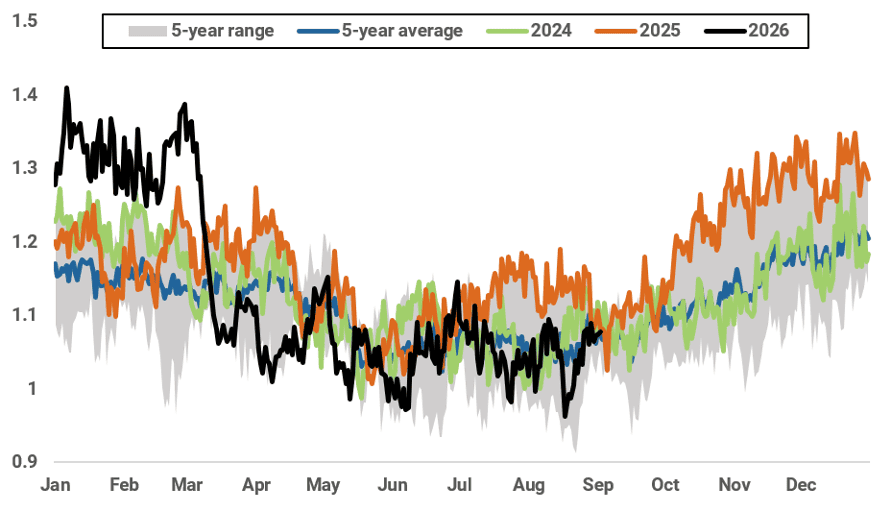
Global LNG exports grew by 0.15 mt w/w to 7.79 mt last week. US supply recovered strongly (+0.37 mt w/w to 2.49 mt) as maintenance wrapped up, with only a modest contribution from new capacity. Higher Australian volumes (+0.16 mt w/w to 1.69 mt) and stronger flows out of Qatar (+0.11 mt w/w to 0.30 mt) also supported the increase. The strengthening in Qatari exports was not a Hormuz signal, but rather Kuwait taking two intra-Gulf offtakes from Ras Laffan. ADNOC’s 5.8 mtpa Das Island plant, which has been exporting via the Strait, held at a single 0.06 mt cargo.
Global LNG exports (mt, 10-day moving average)
Source: Kpler
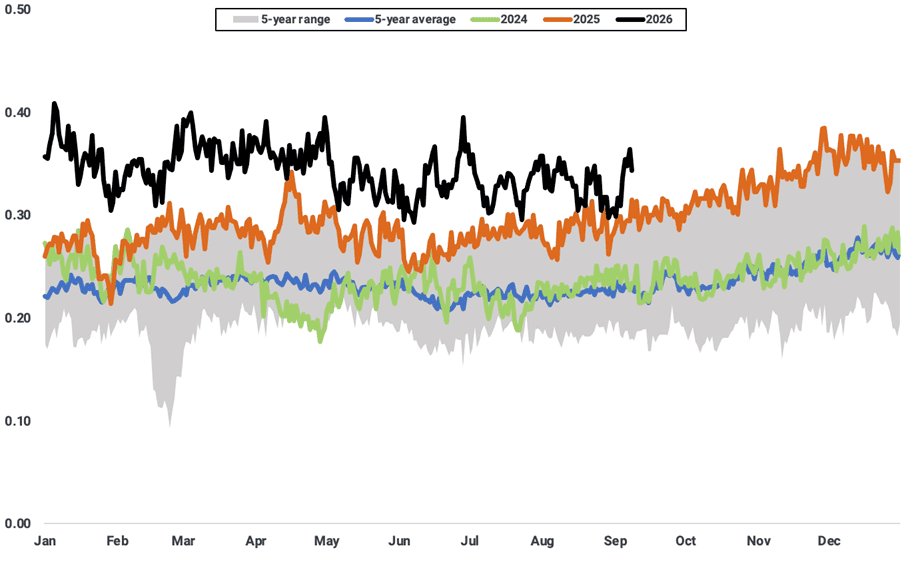
Freeport LNG drove the bulk of the increase (+0.16 mt w/w to 0.35 mt) as its turnaround wound down, while the 25 mtpa Corpus Christi LNG plant increased exports by 0.09 mt w/w to 0.51 mt. Remaining increases were small and consistent with cargo timing.
US LNG exports (mt, 10-day moving average)
Source: Kpler
Australian output held up after a record August, which Kpler data puts as the country’s highest export month on record. At 1.69 mt, the report week was the strongest since June and equates to roughly full national utilisation, the record monthly total reflecting consistently high weeks rather than a single weekly peak. Chevron’s 15.6 mtpa Gorgon LNG led the gain (+0.14 mt w/w to 0.43 mt), with the company’s 8.9 mtpa Wheatstone facility also up (+0.06 mt w/w to 0.20 mt). Softer loadings elsewhere absorbed around 0.04 mt of the combined increase.
South-East Asian exports fell by 0.31 mt w/w to 0.73 mt, the sharpest regional drop in the Pacific basin. Malaysia’s 29.3 mtpa Bintulu complex accounted for a third of the decrease (-0.10 mt w/w to 0.41 mt), and Indonesia’s 11.4 mtpa Tangguh plant decreased by 0.07 mt w/w to 0.18 mt. The 11.5 mtpa Bontang facility showed no liftings after a single 0.07 mt cargo the previous week, while Brunei’s 7.2 mtpa Lumut plant halved output to 0.07 mt. The 2 mtpa DSLNG plant held steady at 0.07 mt.
Latin American exports halved to 0.20 mt (-0.20 mt w/w), the second-largest regional drop after South-East Asia, with all three exporting facilities down. Trinidad’s 14.8 mtpa (11.8 mtpa effective) Atlantic LNG accounted for the largest share (-0.08 mt w/w to 0.13 mt), while the 4.5 mtpa Peru LNG plant reduced shipments by 0.06 mt w/w to 0.07 mt and NFE’s 1.4 mtpa Fast LNG Altamira unit showed no liftings after a 0.06 mt cargo the previous week.
In the Middle East, Persian Gulf load-port volumes edged up 0.11 mt w/w to 0.36 mt, but almost none of it cleared Hormuz. Kuwait lifted 0.21 mt in two intra-Gulf cargoes from Ras Laffan via the Mekaines and the Al Kharaitiyat, neither of which has yet discharged. A further 0.09 mt cargo via the Al Dafna loaded before returning to Ras Laffan without exiting the Gulf. Only ADNOC’s 5.8 mtpa Das Island contributed a strait transit, a single 0.06 mt cargo aboard the Gas Polaris bound for India. Loadings therefore remain below the 0.40 mt summer average, itself a blockade-era figure and a fraction of normal Gulf throughput. Outside the Gulf, Oman LNG started scheduled maintenance on Train 1 of its 11.4 mtpa Qalhat complex, but the turnaround did not affect loadings in the report week, which rose 0.01 mt w/w to 0.23 mt. Early data for the week beginning 7 September points to a sharp fall. No duration was published, though Kpler data suggests production will be curtailed for 1–2 weeks.
Northern Russian loadings fell 0.11 mt w/w to 0.48 mt, the largest decline outside South-East Asia and Latin America, partly offset by higher Papua New Guinean volumes (+0.10 mt w/w to 0.24 mt).
The weekly supply recovery therefore provides some relief to the prompt balance but largely reflects returning US capacity and strong Australian utilization rather than a normalization of constrained Middle Eastern supply, with lower Omani output adding a further near-term offset.
Market Insights you can trust
Kpler delivers unbiased, expert-driven intelligence that helps you stay ahead of supply, demand, and market shifts.
Trade smarter. Request access to Kpler today.

See why the most successful traders and shipping experts use Kpler