What can power markets learn from the Easter Break?
Executive summary
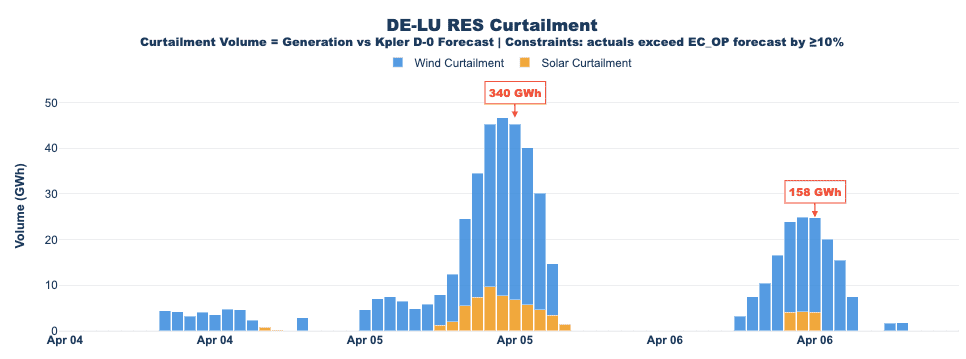
- 2026 is shaping up as the curtailment year. Germany shed 500+ GWh over Easter, 90% of which was wind power, while France curtailed around 170 GWh with a more balanced solar/wind split, reflecting different fleet compositions and TSO operating logic.
- The “anti-duck demand curve” is structural, not seasonal. Behind-the-meter solar is hollowing out midday demand across Q2/Q3, a fingerprint that has been widening year-on-year since 2024 and is now impossible to dismiss as noise.
- Controllability alone won't solve negative pricing. Even as TSOs in France and Germany expand RES curtailment capacity, the combination of rising installed capacity, a shrinking midday load, and market coupling effects from less-prepared neighbours creates a cascading negative price dynamic that no single country can unilaterally contain.
The Easter weekend marked the unofficial inauguration of solar season 2026 in European electricity markets. A combination of weekend holiday demand lows, mild temperatures, and surging renewable output created the perfect storm for deep negative pricing across the continent.
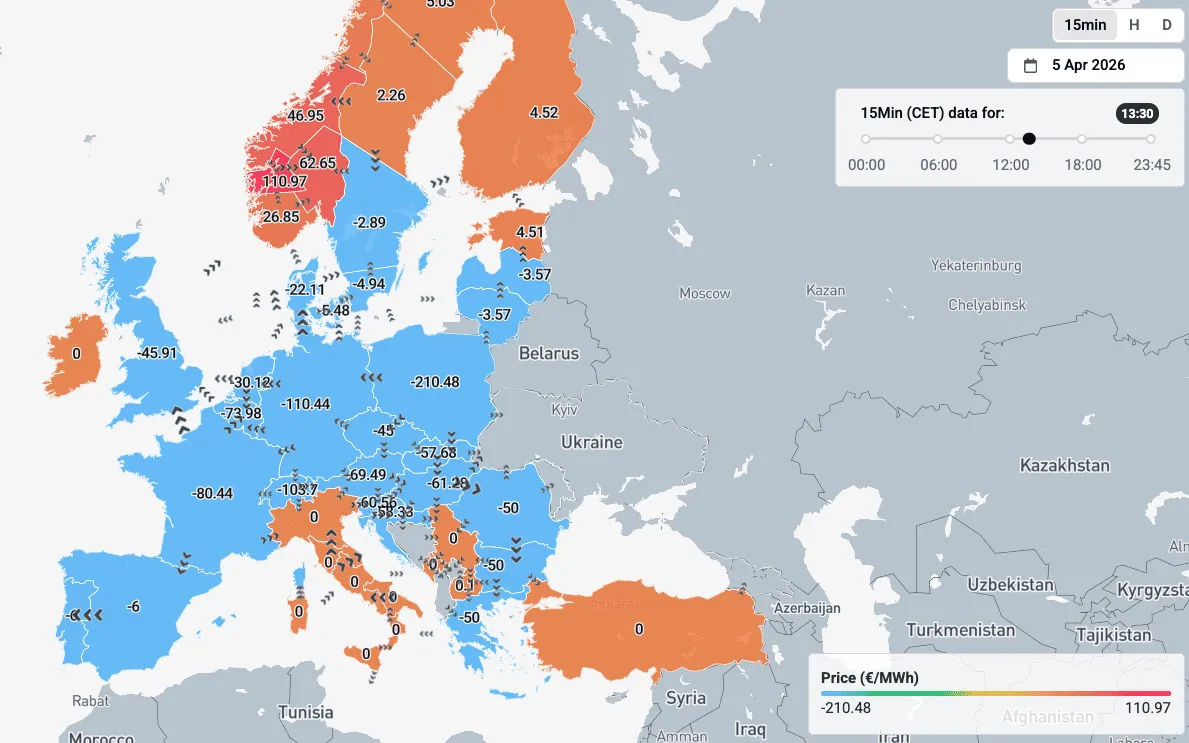
While the event was similar to last year, this time, even aggressive curtailment wasn't enough to absorb the deep negative pricing shock.
The scale of RES curtailment this weekend was striking. Germany shed over 500 GWh of excess renewable generation over the Easter period, with wind accounting for roughly 90% of that volume.
France curtailed around 170 GWh, with a more balanced split: approximately half wind, half solar.
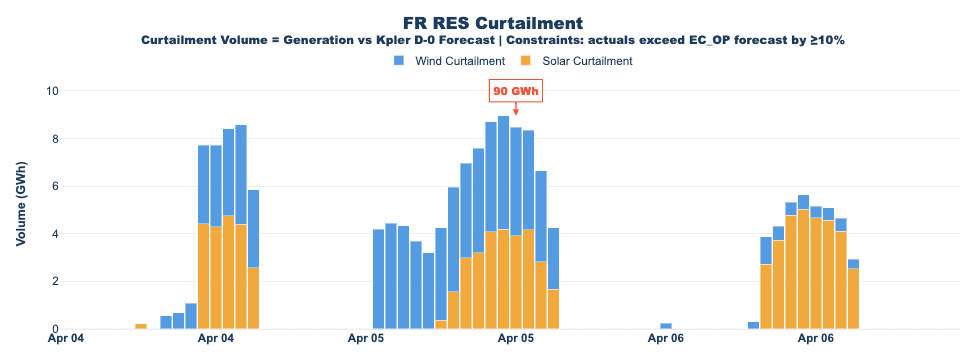
Notably, France curtailed a larger share of its solar output in percentage terms, a signal worth watching as the season progresses.
Solar behind-the-meter: the “anti-duck curve" culprit in the load profile
The RES disruption doesn't stop at the generation side. The load curve itself is being reshaped.
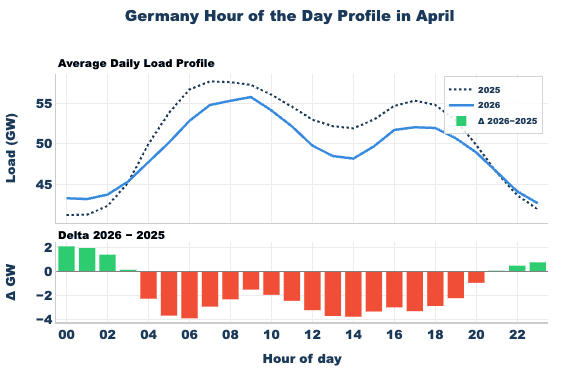
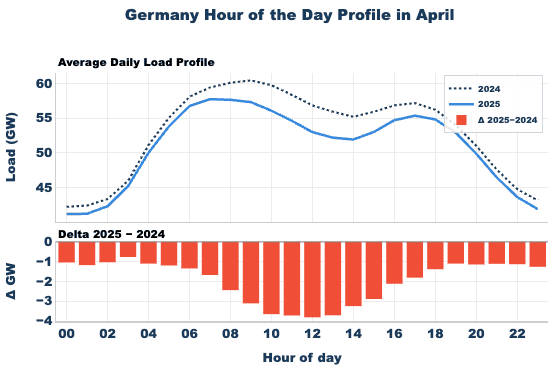
Winter months highlight higher midday load compared to 2024, but Q2/Q3 months (solar months) registered a consistent dip in the noon-to-3pm window, precisely when rooftop solar peaks. The anti-solar curve is structural, not seasonal noise.
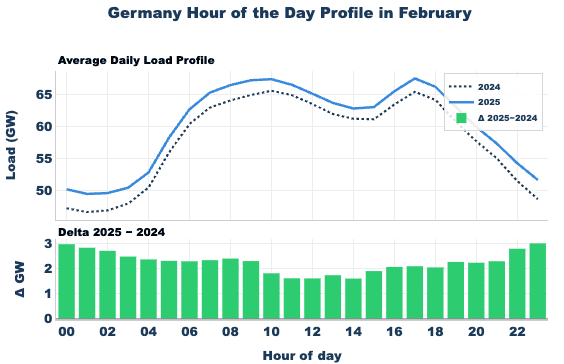
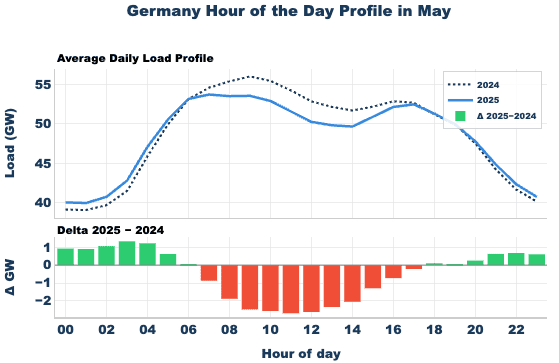
As of early April, the daily demand profile increasingly resembles a duck curve: edge-of-day hours (morning and evening) remain firm, while midday hours are hollowed out by behind-the-meter solar production that never hits the grid.
While a single holiday week in April is not statistically definitive, this pattern is not new, it extends a clear 2025 trend.
Despite improving RES controllability frameworks in France and Germany, the increasing midday dip from the load curve, increasing renewable energy capacity and market coupling effects will challenge this year's negative pricing mechanism.
Power market intelligence built for trading decisions.
Week-ahead calls, weather-driven forecasts, and seasonal outlooks for European markets. Designed to support real decisions, not just inform them.

See why the most successful traders and shipping experts use Kpler