Drawing down: How the market is absorbing the Hormuz shock
In what follows, we explore the observed data and juxtapose it against market fundamentals and crude balances for a better view on how the crude market is dealing with the Hormuz shock.
Key Takeaways:
- The buffer is eroding. The market has absorbed the initial shock through surplus barrels, oil in transit, and floating storage. All three are now largely depleted: commercial stock draws are the final line of defence.
- Larger draws are coming. The implied crude deficit of around 2.6 Mbd in May is not yet fully visible in observable data, pointing to either underground storage draws or further downward revisions to refinery runs, particularly in China.
- Japan and South Korea are most exposed. Both countries are running refineries predominantly on inventory rather than fresh imports, with Japan's coverage estimated at around 126 days and South Korea's position thinner, while also less transparent.
- The quality problem is compounding the volumetric issue. Replacing Middle Eastern medium-sour with US light crude is arithmetically possible but costly in terms of refinery economics, with structural gasoil and jet shortfalls estimated above 500 kbd and 450 kbd respectively for June, while the gasoline bull play is already unfolding, supported by restrained FCC runs.
- Watch the curve, not the flat price. As draws accelerate into summer, backwardation should deepen: a cleaner signal of physical tightness than flat price, which remains anchored by ceasefire risk and demand destruction fears.
Inventory drawdowns: a country-by-country snapshot
Global onshore crude oil stocks recently dipped to as low as 3,600 Mbbls, representing some 130 Mbbls decrease from the post-pandemic peak recorded in late March. Middle East supply disruptions have forced several major consuming nations to draw on their strategic petroleum reserves (SPR), though the scale of these withdrawals varies significantly by country.
World weekly inventories (Mbbls)
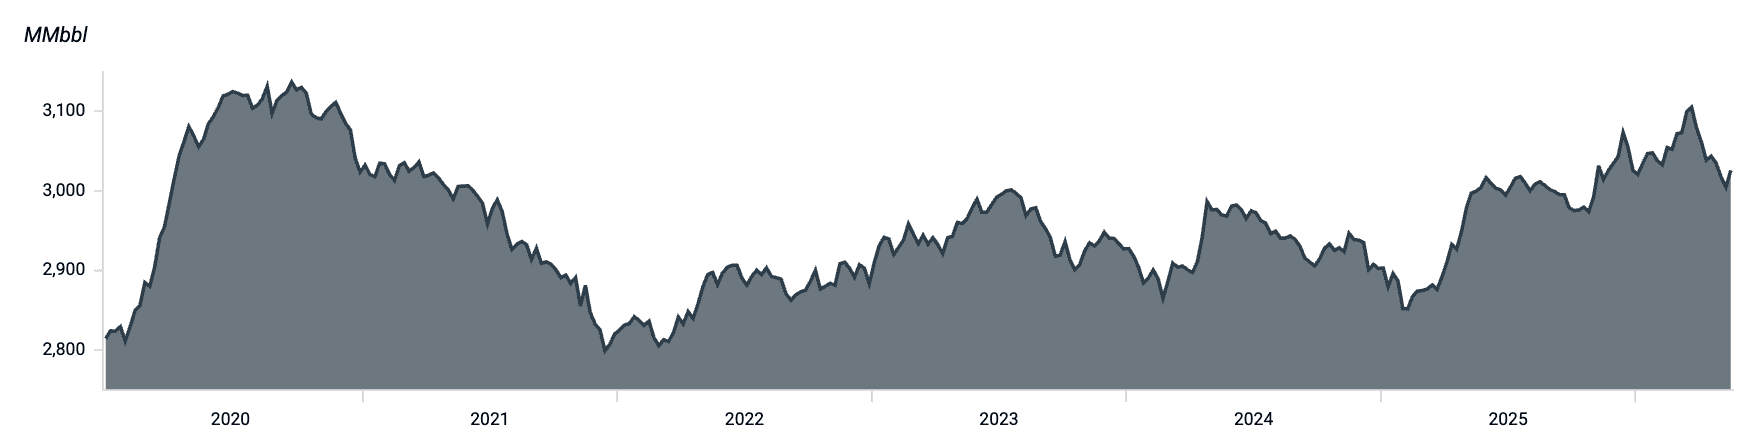
Source: Kpler
- China: Bucking the global trend, observable crude inventories in China stand at a record high of near 1,240 Mbbls, up roughly 25 Mbbls since the conflict began. Despite meeting nearly 90% of its 2025 crude requirements in April, a significant demand reduction would be necessary to generate a surplus for storage. Meanwhile, despite export bans announced in early March, refined product exports (all liquids, chemical/bio, and LPG) in April remained above 1.20 Mbd—only marginally below the 2025 average of 1.23 Mbd—suggesting refining activity has stayed robust.
- Japan: Leading the global drawdown, Japan has cut its stocks by more than 70 Mbbls from a pre-war baseline of 350 Mbbls. Low April imports—only 734 kbd, or 32% of the 2025 average—forced heavy reliance on SPRs. With imports forecast to recover to 1.63 Mbd (70% of the average), the pace of draws is expected to ease.
- United States: While the US reached a post-pandemic inventory high of 378 Mbbls in early April, a subsequent 28 Mbbls draw brought levels to 350 Mbbls, resulting in almost no net change since the war started. This stability stems from an SPR transfer to commercial sectors; 21 Mbbls were pulled from the SPR while commercial stocks grew by nearly 18 Mbbls. These releases bolstered April exports to a record 156 Mbbls, well above the 2025 monthly average of around 115 Mbbls.
- EU-27: European inventories hit a multi-year low of 311 Mbbls in mid-February before rebounding to 348 Mbbls by late March. Currently sitting above 340 Mbbls after a 14 Mbbls draw, these fluctuations suggest that Middle Eastern supply tensions have not severely disrupted European chains, especially as April crude imports hit a seven-month peak of 9.7 Mbd.
- India: Crude inventories declined from a post-pandemic high to around 85 Mbbls by late April before recovering to just under 90 Mbbls currently, including a 3 Mbbls drawdown from SPR sites in Visakhapatnam and Mangalore. Strong procurement in April (over 90% of the average) reflects a continued focus on stock stability.
- South Korea: Despite a planned 22.5 Mbbls SPR release, observable draws remain limited. Inventory initially climbed by 5 Mbbls before falling to the current 87 Mbbls, marking a 7 Mbbls wartime reduction. Possible unreported SPR activity or refinery cuts may be masking the true figures. However, with May arrivals expected at 90% of the 2025 average, further draws may be mitigated.
The country-level picture is reflected and complicated by what is happening to barrels still at sea.
Floating Storage and Oil on Water
Middle Eastern supply constraints triggered a sharp decline in global oil on water (OoW), which fell 135 Mbbls from pre-war levels to 1,130 Mbbls by late March. Since then, global OoW has rebounded to around 1,270 Mbbls in early May and currently stands at approximately 1,235 Mbbls.
Daily Global Crude Oil on Water (Mbbls)
Source: Kpler
Initial global OoW declines were driven by sanctioned barrels. However, consistent Iranian volumes and increased Middle Eastern replacement barrels moving from the Atlantic Basin to Asia helped trigger the recent recovery. Total sanctioned volumes are down over 45 Mbbls from mid-March levels, currently standing at 330Mbbls. This drop is primarily attributed to Russian crude, which saw a nearly 35 Mbbls reduction by late April.
Weekly sanctioned crude oil on water (Mbbls)

Source: Kpler
The most recent surge in oil on water was fueled by bypass routes established by Saudi Arabia and Abu Dhabi, as well as significantly higher supply from the US Gulf Coast. As these alternative supplies are redirected to Asia to compensate for Middle Eastern crises, the resulting longer transit times have naturally increased global OoW volumes.
Taken together, the drawdowns in both onshore stocks and oil on water point to a market working harder than headline prices suggest, a dynamic the supply-demand balance makes explicit.
The balance angle
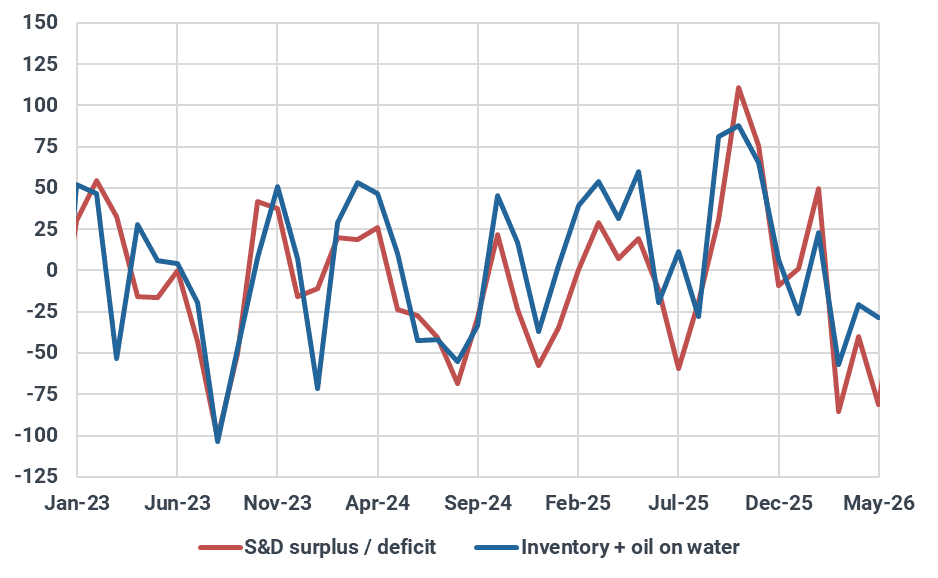
Prior to the US/Israel conflict with Iran, our crude and condensate balance pointed to a surplus of around 3.2 Mbd in March, 3.5 Mbd in April, with the surplus expected to narrow to around 1.8 Mbd in May. However, continued disruptions to flows through the Strait of Hormuz have significantly affected both production, particularly across the Middle East, and refinery runs in the Middle East and Asia. Reduced crude availability pressured Asian refiners to diversify their sourcing and cut throughput, leading to major downward revisions in the balance sheet. As a result, the crude balance shifted sharply from surplus into deficits of around -2.76 Mbd in March, -1.35 Mbd in April, and nearly -2.6 Mbd this month. Consequently, the initial expectation was for global inventories to draw. However, March data instead showed inventory builds of some 645 kbd m/m, while April and early May have been marked by significant drawdowns.
Global crude and condensate balance, Mbd
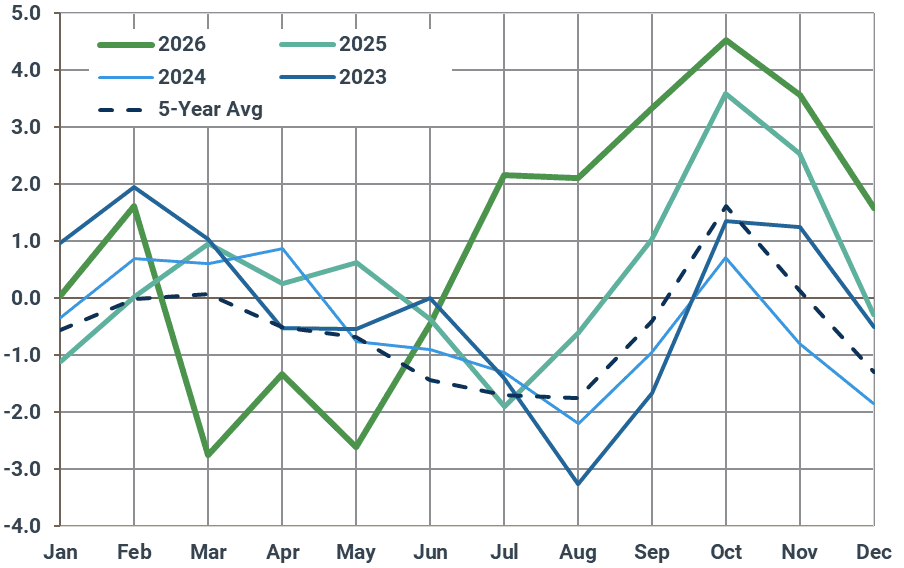
Source: Kpler
Although the March global stock build appears unusual under these conditions, substantial inventory increases were recorded in the Middle East, where regional stocks rose by around 451 kbd m/m. At the same time, spring maintenance in the EU-27 peaked in March, with nearly 1.6 Mbd of refining capacity offline, while crude imports declined by around 300 kbd m/m to 9.3 Mbd, keeping crude throughput in check and contributing to an inventory build of roughly 580 kbd m/m. The US also recorded higher inventory levels (+709 kbd m/m) as refiners conducted maintenance, leaving around 1 Mbd of refining capacity offline and weighing on domestic crude demand. China continued to build inventories, adding another 175 kbd to stocks as it maintained its barrel accumulation trend that began in 2025.
The March inventory trend is further explained by the roughly 135 Mbbls drawdown from oil-on-water stocks, which Asian refiners tapped to offset barrels constrained in the Persian Gulf. Temporary sanctions waivers and general licences issued by the Trump administration in March 2026 also allowed Russian and Iranian crude already loaded or in transit to continue reaching buyers, enabling Chinese and Indian refiners to secure discounted barrels, sustain operations, and protect margins during the Strait of Hormuz disruption.
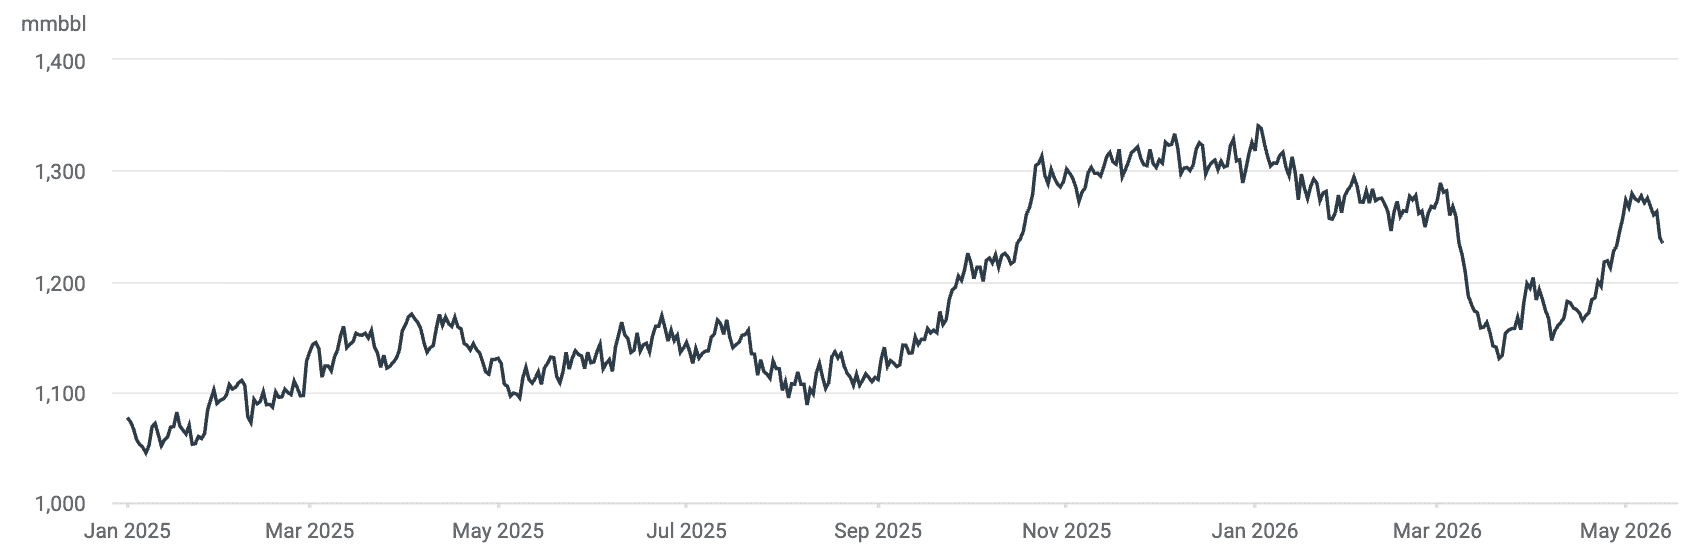
China’s refiners have quickly felt the impact of the Strait of Hormuz closure, with seaborne crude imports falling from nearly 11.7 Mbd in February to around 6.21 Mbd recorded so far in May (including volumes delivered via Myanmar’s Made Island). The reduced crude availability was mainly mitigated through lower refinery runs, particularly among state-owned refiners, which have also cut term crude purchases significantly in May and June. Meanwhile, Shandong independent refiners bore the brunt of maintaining domestic product supply and sustaining market availability despite pressured refining margins amid elevated feedstock costs.
China, Made Island crude imports (kbd), Inventory (Mbbl, RH)
Source: Kpler
Lower processing rates notwithstanding, crude inventories continued to build over the period. Interestingly, China’s crude and condensate output averaged 4.6 Mbd in Q1, up 380 kbd y/y, which has also contributed to stock builds. While rising inventories in March came as no surprise as Beijing pursued a strategic crude stockpiling campaign through 2025 and into Q1 2026, we had anticipated draws to emerge in April and May, which ultimately did not materialise. This prompts us to believe that refinery runs adjustments have been even steeper than our previous estimates for these two months. In our latest Crude S&D update, we revised crude throughput projections higher by nearly 290 kbd in March, based on our implied model. The upward adjustment was supported by still-elevated crude imports, healthy clean product exports, and a balancing factor (the difference between supply, demand, net flows, and inventory changes) that continued to point to oversupply.
In April, however, we lowered refinery runs by further 360 kbd, bringing throughput down to 13.82 Mbd, while May crude intake is now expected to average around 13.62 Mbd. Even after these downward revisions, China's balance for both April and May remained in deficit, implying insufficient crude supply to sustain operations. This suggests that Chinese refiners may need to draw on strategic reserves or, alternatively, that refinery throughput will be further revised below 13 Mbd, particularly in May, once flow and inventory data stabilise and the country balance is recalculated. This last point is further corroborated by limited yield flexibility for China’s independents, in accordance with the government instructions of late, leading to reported plans for lower processing.
India crude imports fell sharply from 5.2 Mbd in February to around 4.46 Mbd in March, before recovering to roughly 4.7 Mbd recorded so far in May. As expected, the steepest decline came from the Middle East Gulf, with most of the lost volumes replaced by Russian barrels and grades sourced from Latin America. During this period, several refiners started maintenance, pushing offline capacity to around 520 kbd in April and 470 kbd in May. Most facilities are expected to return online from June onward. Current crude intake projections point to a recovery in throughput. However, with flows through the Strait of Hormuz still constrained and preliminary May crude exports remaining subdued, Indian refiners will likely need to continue drawing on inventories, currently hovering around 90 Mbbls, to bridge the gap between available crude supply and projected intake levels, otherwise, further downward revisions may be required.
Japan has recorded the largest inventory drawdowns during this period, with refiners beginning to access stocked barrels since March. In both April and May, refinery operations were largely sustained by inventories rather than crude imports, which fell significantly during this period. While a recovery in imports is expected in May, inventories are still projected to fill the gap and support refinery runs averaging around 2.2 Mbd so far this month. Looking ahead, we expect this trend to continue, as Japan still holds sufficient coverage to maintain refinery throughput of around 2.2 Mbd for approximately 126 days.
South Korea’s refinery runs have been reduced by nearly 1 Mbd in both April and May, averaging around 2 Mbd. Even after these significant cuts, crude imports were insufficient to meet demand, requiring around 300 kbd to be drawn from inventories to sustain processing rates. Although it is still early in the month and flow data will be revised, currently subdued export levels toward the country point to further inventory drawdowns ahead.
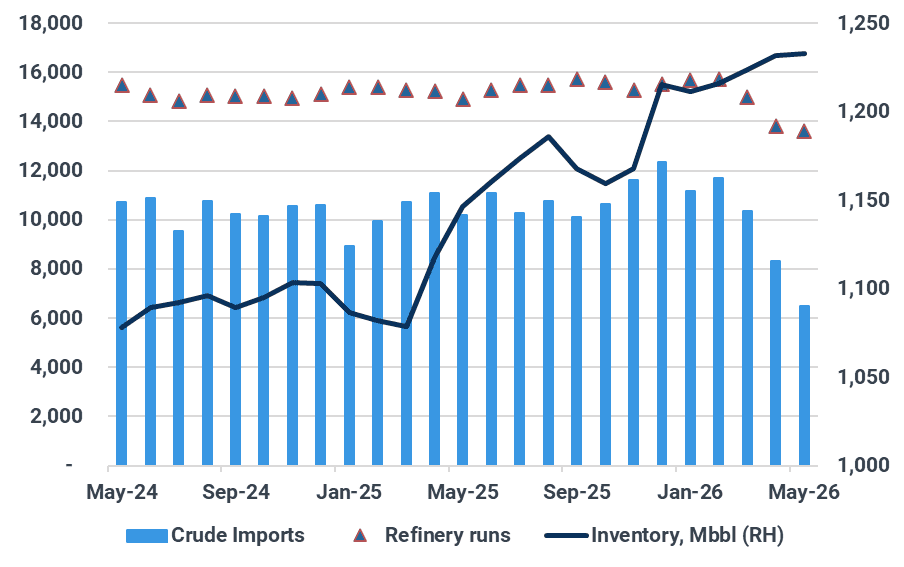
US crude exports reached record highs of more than 5.2 Mbd in April and so far in May, supported by the transfer of around 21 Mbbls from the SPR into commercial storage. At the same time, reduced refinery runs during April, with roughly 1.1 Mbd of capacity offline for maintenance, freed up additional barrels for export. Despite stronger domestic crude demand, expected to rise by 700 kbd m/m to around 16.7 Mbd in May and further to 16.9 Mbd in June, US crude outflows are anticipated to remain elevated, albeit below recent highs. Current inventory levels are still around 14 Mbbls above January levels, which appears comfortable relative to historical trends. In addition, domestic crude and condensate production is estimated to remain high at close to 13.8 Mbd this year, further underpinning both domestic demand and robust crude outflows going forward.
The EU-27 member states have maintained relatively stable crude imports from February through May, despite widespread refinery maintenance during this period. The resilience in import levels, combined with a recovery in inventories, indicates that European refiners adapted to the Strait of Hormuz disruptions, mainly by increased sourcing from the US Gulf Coast. Looking ahead, refinery crude intake is expected to increase sharply to around 9.93 Mbd (+330 kbd m/m) in June as maintenance activity eases. This rebound in runs should place renewed pressure on inventories, as elevated crude prices and freight costs could discourage refiners from significantly increasing prompt purchases.
Comparison between crude and condensate balance with inventory and oil-on-water data
When comparing our crude balance with the month-on-month changes in inventory and oil-on-water data, both datasets point to the same underlying trend that refiners are increasingly being forced to draw down inventories or secure supply by drawing on barrels already in transit. This alignment reinforces the view that prompt crude availability has tightened in recent months.
However, despite the consistency between the datasets, our balance suggests that inventory draws should have been more pronounced already in April. Looking ahead to May, the balance implies that even larger volumes may need to be drawn from inventories or floating storage to meet refinery demand, particularly if crude supply remains constrained while refinery intake continues to recover.
In April, our crude balance estimates indicate a deficit of nearly 1.34 Mbd, while observed inventory and oil-on-water data declined by only 682 kbd during the month. The remaining gap of roughly 659 kbd cannot be fully reconciled through observable storage movements and may largely be explained by barrels withdrawn from underground storage facilities or pipeline systems that are not covered by our monitoring systems.
As previously discussed, China’s observed inventories continued to build in April, mainly due to lower refinery intake. However, as outlined in Assumption 2 of this report, if barrels were withdrawn from underground storage and transferred into overground tanks to improve refinery accessibility, our datasets would capture the overground inventory increase without reflecting the corresponding underground draw. This dynamic could therefore explain part of the discrepancy between the implied balance and the observable inventory changes.
In May, based on the data available so far, the gap between the crude balance and the combined inventory and oil-on-water datasets has widened further, currently implying an unexplained difference of around 1.69 Mbd. It should be noted that additional revisions to both supply and demand estimates are still likely and will be finalized once the month concludes and a clearer picture of inventory movements becomes available. Nevertheless, the current balance continues to suggest that crude demand is recovering, while crude availability remains relatively constrained amid ongoing disruptions and trade flow adjustments linked to the situation in the Strait of Hormuz.
Crude & condensate S&D versus inventory + oil-on-water monthly change, Mbbls
Source: Kpler
Part of the reason the adjustment has been less dramatic than the supply shock might imply comes down to a cushion the market entered the conflict with.
The curious case of the pre-existing surplus
The crude balance cushion delayed the inventory tightening. Part of the prior surplus was due to the refinery maintenance period. At the time of writing, an average of 11.8 Mbd of capacity has been offline since the start of the war: 6.1 Mbd from planned maintenance and 5.9 Mbd structurally linked to the conflict (damage or mandated demand curtailment).
This in part explains the less severe price and inventory reaction after the initial supply shock. The global supply chain had the layers of oil-in-transit and elements of floating storage to draw on initially before pulling on commercial stocks more quickly.The longer current conditions persist, the more inventory draws should accelerate before greater demand destruction would be needed to balance the market.
Prompt month DFL, $/bbl
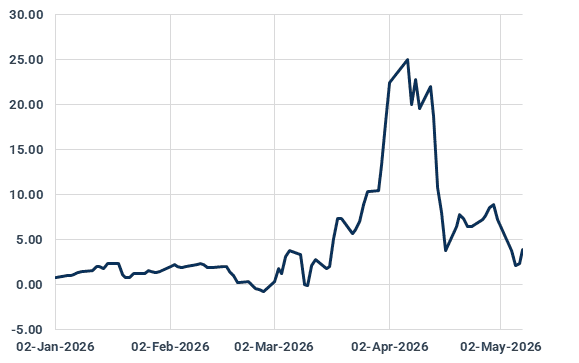
Source: Argus Media
With this in mind, the market should see a greater convergence between physical spot prices and crude futures prices, as stock draws continue through the summer months. Futures structure will reflect this tightness more acutely than outright flat price (which incorporates greater headline risk). Prompt month Dated to Frontline (DFL) prices have already dropped from highs of above $25/bbl to below $3/bbl, but still well above the typical values around $1/bbl. As inventory draws accelerate into summer, the prompt physical premium should reassert itself, pushing the curve back toward steeper backwardation — a more reliable signal of underlying tightness than flat price, which remains anchored by demand destruction fears and ceasefire risk.
Beyond the volume question, however, a more structural problem is emerging: the barrels the market can access are increasingly the wrong kind.
The quality mismatch question
The disruption to Strait of Hormuz transit is primarily tightening the availability of heavier feedstocks, with medium-sour crude exports having fallen to nearly half their pre-conflict levels. Although flows have stabilised at around 7 Mbd since March, more recent data point to renewed deterioration: weekly exports hit a low of 5.7 Mbd in late April—the sharpest drop since the war began..
World crude exports by quality, Mbd
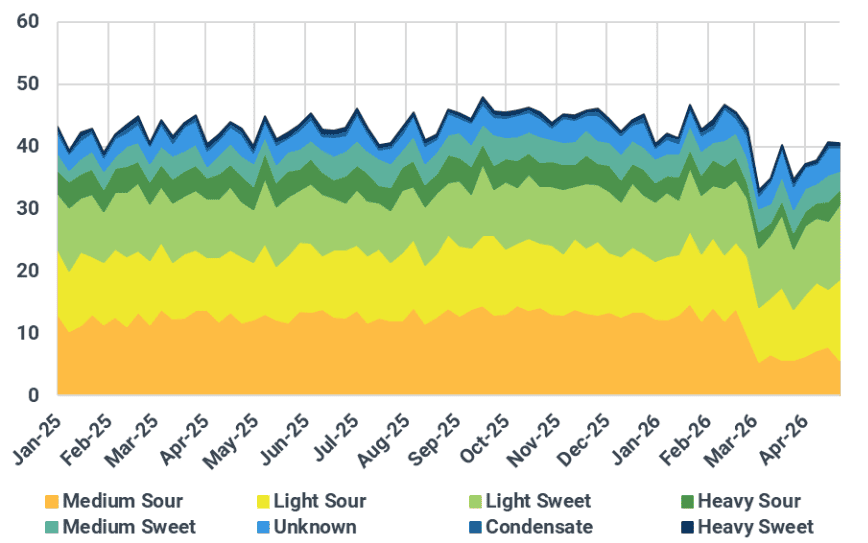
Source: Kpler
The market has found mild reprieve as robust Venezuelan volumes partially fill the void left by Iraqi barrels, with March shipments to India climbing to 300 kbd. Projections suggest this trend will strengthen, with Indian imports of Venezuelan crude potentially reaching 400 kbd this month. However, total availability still trails global consumption needs. While the US-led surge in light-grade exports provides a numerical boost to global volumes, these barrels are flawed substitutes; they fail to replicate the rich middle-distillate yields characteristic of traditional Middle Eastern grades.
Consequently, the global crude pool has shifted toward a lighter profile. Most visibly, light crude surpassed medium-density barrels as Europe’s primary import stream in April—a rare structural anomaly. This trend is likely to persist through the summer, as the Hormuz closure and anticipated slow recovery of trade routes continue to deprive the market of heavier, distillate-dense feedstocks.
EU-27 + UK — Crude import mix by quality, vol.%
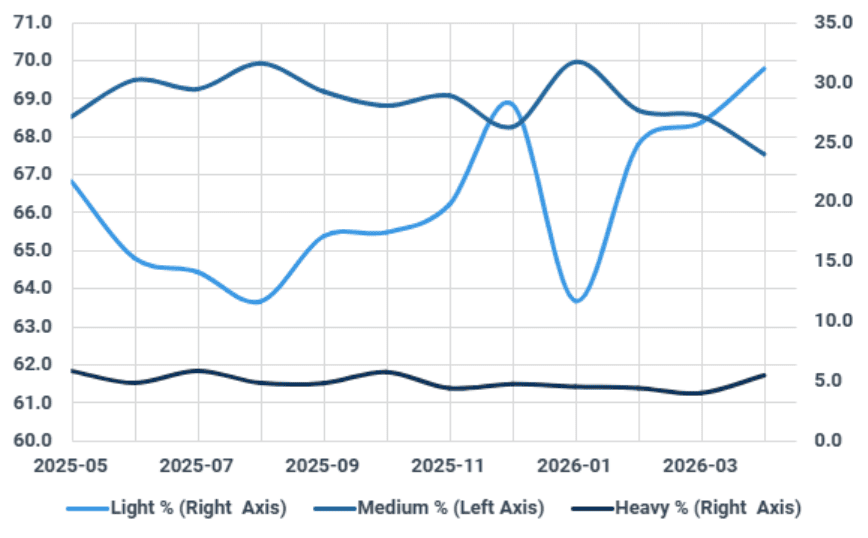
Source: Kpler
The shift toward US-sourced light crude means European refineries will likely face reduced efficiency for distillate production, deepening the reliance on American diesel and jet fuel imports. The shortage of heavier feedstocks that strained the European diesel market last year is set to repeat with greater intensity, as regional stocks follow an inevitable trajectory toward further draws throughout the summer. Technically, a complex refinery processing WTI can yield 10% less distillate than one running Arab Light. This structural deficit, estimated at over 500 kbd for gasoil and 450 kbd for jet in June, threatens to become more acute as the required crude slate remains out of reach.
Hence, the quality mismatch is further compounding the volumetric problem brewing in global crude markets, with the clock ticking.

See why the most successful traders and shipping experts use Kpler