Asian LNG prices to rise amid simmering geopolitical tensions, elevated TTF
Mixed fundamentals in Europe are likely to keep TTF prices near $29/MMBtu for the coming week, as weaker demand is offset by pipeline supply outages. Asian LNG prices are expected to increase in order for the region to remain an attractive destination for flexible Atlantic Basin cargoes despite relatively weak fundamentals. Both price points continue to be supported by ratcheting tensions in the Middle East.
Market & trading calls
European TTF front-month price outlook: Stable, amid mixed market signals. Below-average temperatures in the first half of the week and weaker wind generation are expected to increase gas demand, while disrupted Norwegian supply, persistent geopolitical tensions and competition with Asian buyers for flexible LNG pose further upside risks. However, higher LNG supply and upward temperature revisions towards the end of the week will cap price gains.
Asian LNG front-month price outlook: Slightly bullish, as firm TTF prices, persistent Strait of Hormuz supply risks and the rollover to the higher-priced December contract outweigh softer regional demand fundamentals. Weaker Chinese industrial consumption, stronger South Korean coal generation and elevated Japanese utility inventories continue to limit Northeast Asian spot procurement, while selective buying in India and Southeast Asia provides modest support. Further geopolitical escalation remains the key upside risk, while improving Middle Eastern LNG deliveries and subdued regional demand could cap price gains.
Asian LNG – TTF spread outlook: Set to narrow, as Asian LNG increases slightly amid a stable TTF. The spread flipped w/w, with the Asian LNG trading from a $0.30/MMbtu premium to a $2.21/MMbtu discount as of 14 October.
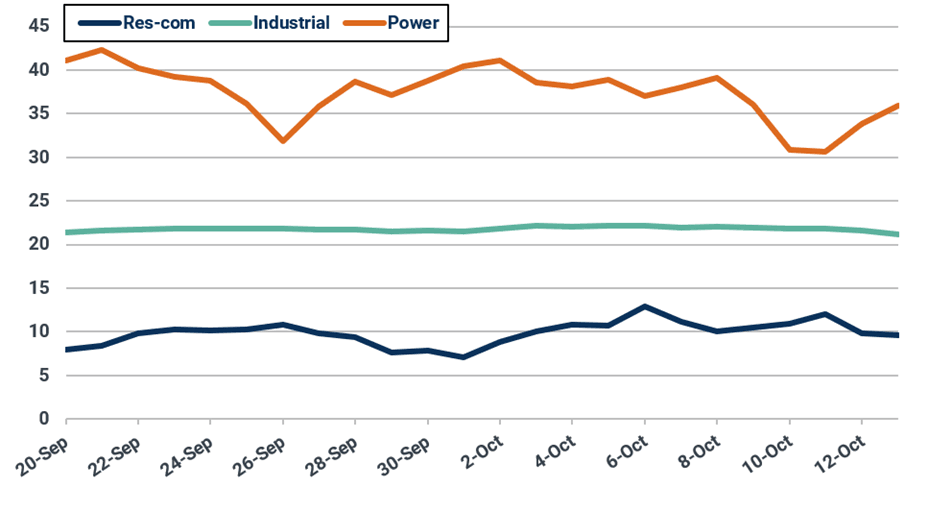
US Henry Hub front-month price outlook: Stable, as NOAA temperature forecasts for the back half of October show an increasingly mild end to the month, reducing demand expectations in both the residential-commercial and power sectors. This weakening demand outlook will be offset by lower domestic gas production from both voluntary curtailments and from pipeline outages.
Key natural gas and LNG front-month prices ($/MMBtu)
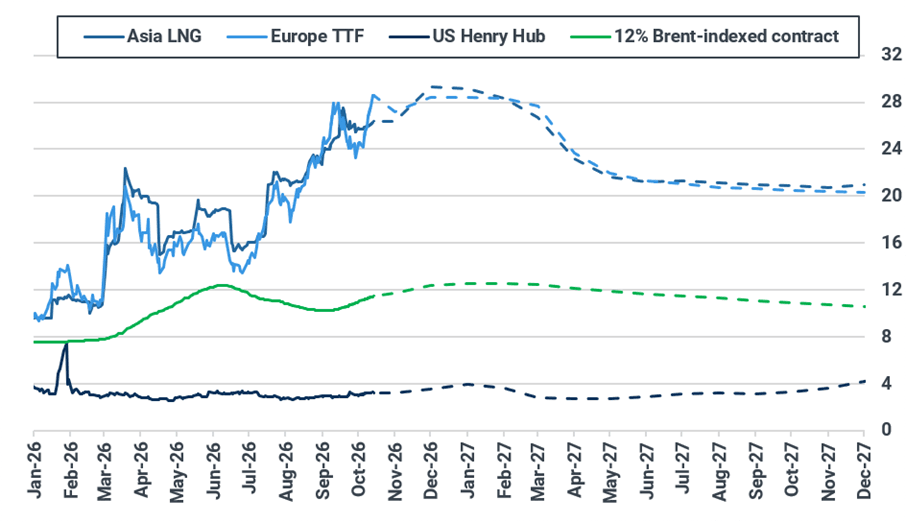
Source: ICE, NYMEX. Brent-indexed price represents 12% slope of 90-day moving average of Brent contract.
Asian LNG-TTF front-month spread ($/MMBtu)
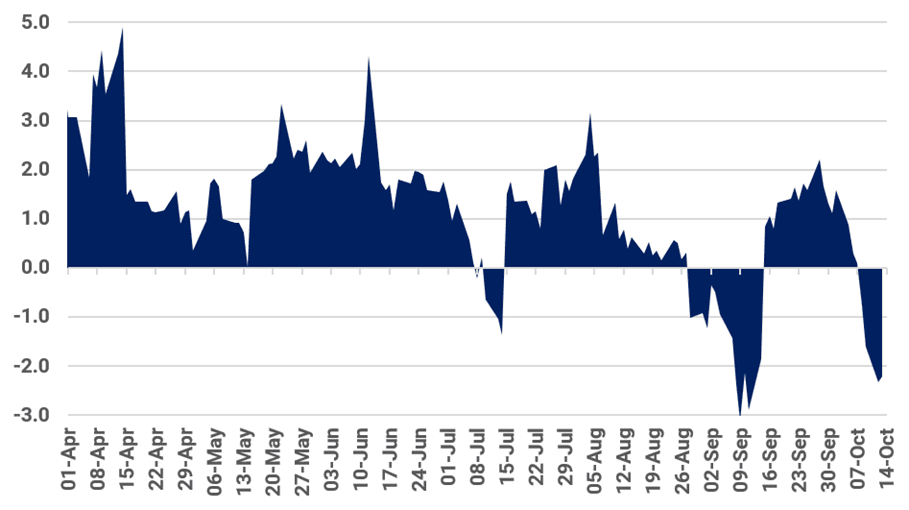
Source: ICE, Kpler Insight
Europe: TTF to remain stable as upward revisions to temperature and higher LNG imports offset lower wind speeds and pipeline supply
The European TTF front-month contract rose from $25.58/MMBtu on 7 October to $28.59/MMBtu on 14 October, an increase of over 11% w/w and reaching its highest level in more than three years. The sharp increase was driven by further geopolitical escalation after a Saudi-backed coalition launched strikes on the Houthis, who subsequently threatened attacks on Saudi energy facilities. However, despite heightened regional tensions and continued attacks on vessels transiting the Strait of Hormuz, Qatari LNG loadings strengthened further, with 13 cargoes loaded at Ras Laffan between 1–13 October, compared with 20 during the whole of September. Four of these 13 cargoes were loaded on vessels with active AIS transponders, while the other nine were verified using satellite imagery, tug tracking, and AIS signals reappearing after Hormuz. In Europe, average temperatures fell slightly below seasonal norms, driving an increase in gas consumption compared with the previous week. However, high wind generation weighed on gas-fired generation across the continent. European storage injections slowed down to 0.14 bcm/d as increases in pipeline supply were more than offset by higher consumption and lower LNG imports, with stocks currently at 74% full. However, Germany and the Netherlands continue to lag behind, with stocks just above 60% full.
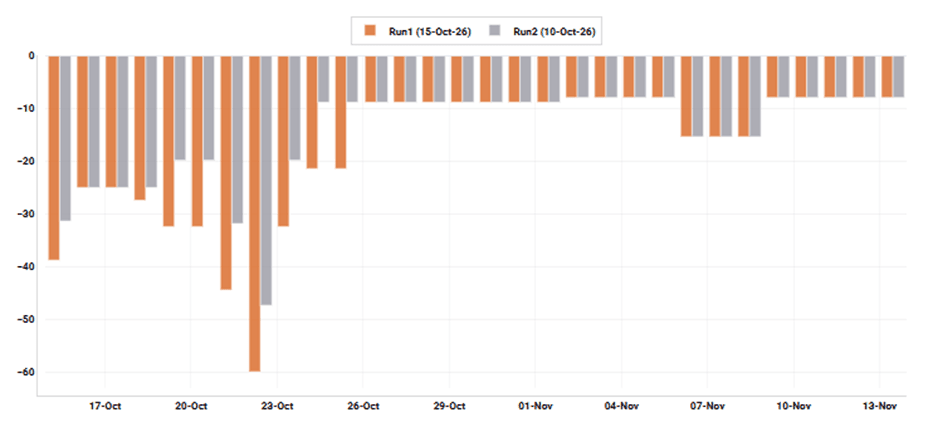
Looking ahead, Kpler Insight holds a steady TTF outlook for next week amid mixed market signals. On the bullish side, temperatures are expected to rise briefly before falling more substantially below seasonal norms, while lower wind generation and increasing competition with Asian buyers for flexible LNG cargoes could provide further support. However, rising Qatari LNG exports despite persistent geopolitical tensions could help offset some of this pressure. Also on the supply side, NCS is currently experiencing outages at the Kristin and Troll fields and the Nyhamna and Karsto processing plants, with a combined impact currently below 0.50 bcm/d but expected to increase briefly next week. Meanwhile, LNG arrivals to Europe are expected to average 2 mt during the week started 12 October, a slight uptick on 1.89 mt from the week before.
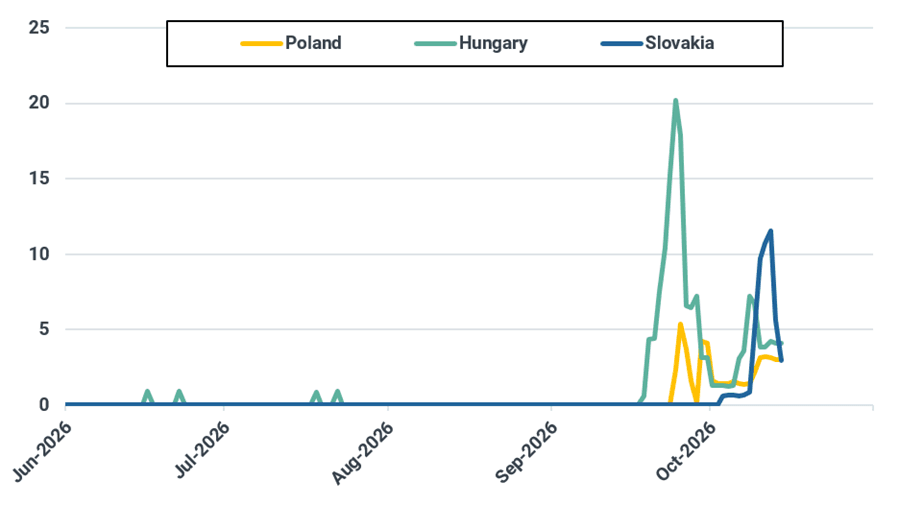
EU-27 net pipeline imports increased by 6.9% w/w to an estimated 2.94 bcm, the highest since the end of August. The increase was driven by higher Ukrainian exports to the EU, particularly via Slovakia. A looser Slovak balance allowed exports to Austria amid planned maintenance at VIP Oberkappel, and higher exports from Austria to Italy at Tarvisio. Higher flows from the East Corridor alongside slight increases in Norwegian exports to the EU more than offset marginal reductions in Algerian and Azeri flows to the EU. Looking ahead, Kpler Insight expects pipeline imports to edge lower into next week, as the heaviest period of planned maintenance at VIP Oberkappel comes to an end, which is likely to weigh on imports from Ukraine via Slovakia. In addition, upward revisions to unavailable capacity at Norway’s Karsto and Nyhamna processing plants and at the Troll and Kristin fields are expected to reduce exports to the continent.
Selected daily Ukrainian flows to the EU (mcm)
Source: ENTSOG
GASSCO scheduled unavailability for fields and processing plants (mcm/d)
Source: GASSCO, on 15 October 2026, 09:00 UTC
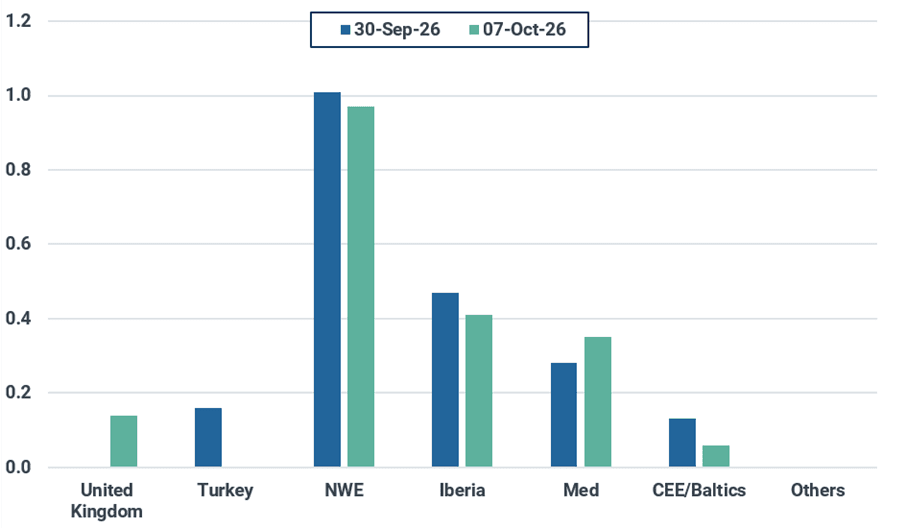
European LNG imports declined by 5.9% w/w to an estimated 1.93 mt, with lower arrivals across most of Europe, except for the UK and Mediterranean markets. Despite ongoing competition for flexible LNG supply from Asia and other importing markets, Europe remained an attractive destination for flexible cargoes, with three LNG cargoes reportedly diverted towards the continent over the past week, compared with just one diverted away. Overall, European LNG sendout edged lower w/w, averaging 300 mcm/d, down from 310 mcm/d the previous week. However, Dutch regasification remained at record-high levels, while strong sendout in France and Spain kept PEG and PVB day-ahead prices at significant discounts to TTF. Elsewhere, Italian and German sendout remained constrained by ongoing terminal maintenance. Looking ahead, LNG imports into Europe are expected to edge higher as regasification economics in Europe remain robust, with the NWE DES price increasing its discount to TTF by $0.08/MMbtu to $0.65/MMbtu as of 14 October.
European weekly LNG imports by region (mt)
Source: Kpler Insight. Data represents week commencing 23/09 and 30/09. NWE=FR, BEL, NL, GER. Iberia=ESP, POR. Med=ITA, HVR, GRE. Baltics/CEE=FI, LT, POL. Others=SWE, MT.
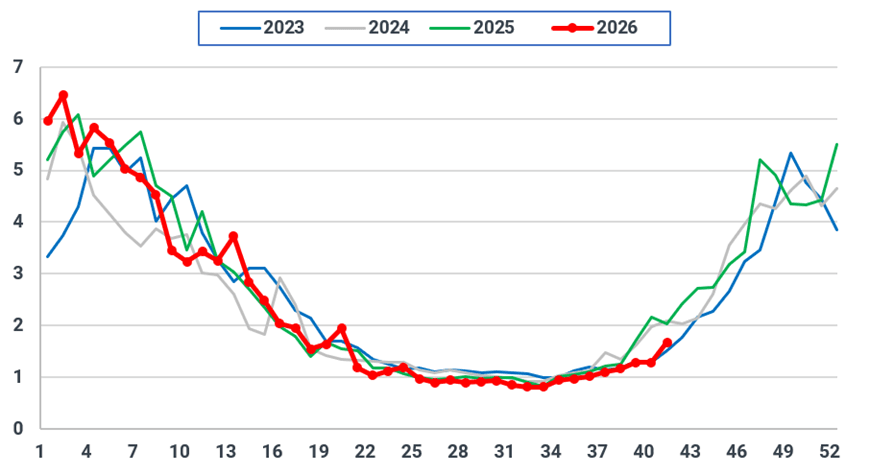
Local distribution consumption (LDC) across 16 EU countries increased by 30% w/w to an estimated 1.67 bcm but remained below levels seen in the past two years. The gains marked the start of the heating season across the continent and were driven by higher gas use in NWE where average temperatures fell by 3°C w/w. Looking ahead, Kpler Insight expects LDC to edge higher next week, as temperatures are forecast to fall below seasonal norms across much of the continent, before recovering towards the end of the week.
EU-16 weekly consumption in the local distribution sector (bcm)
Source: ENTSOG, ENAGAS, Eustream, AGCM, Kpler Insight. The EU-16 perimeter includes AT, BE, DE, CZ, FR, HU, GR, IT, NL, LU, PL, PT, RO, SL, SK, and ES.
Northwest Europe daily average temperature forecast (°C)
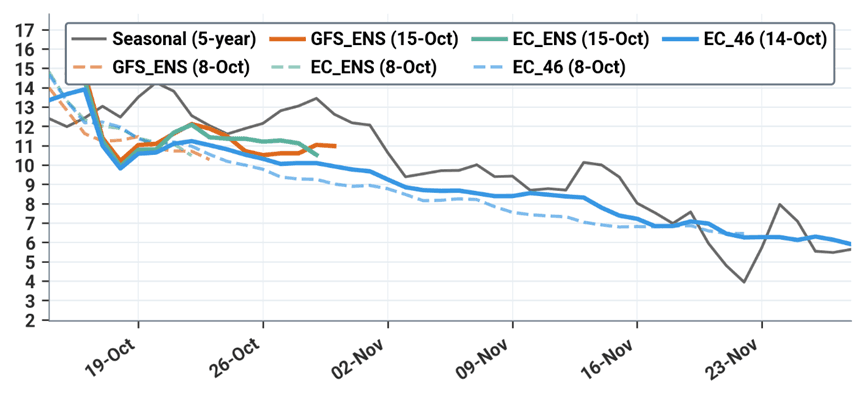
Source: Kpler Insight. Run comparison 15/10 (solid) vs. 08/10 (dotted), 00:00 UTC. Seasonal is a five-year average. NWE includes France, Belgium, Netherlands and Germany.
Southern Europe daily average temperature forecast (°C)
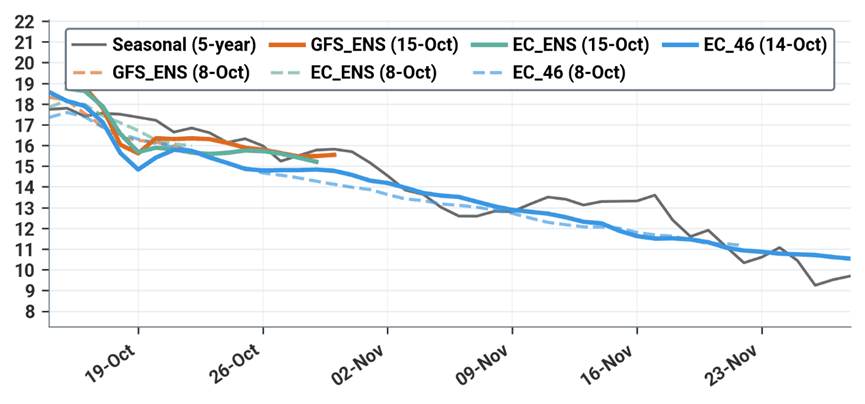
Source: Kpler Insight. Run comparison 15/10 (solid) vs 08/10 (dotted), 00:00 UTC. Seasonal is a five-year average. Southern Europe includes Portugal, Spain and Italy.
EU gas-fired generation declined by 18% w/w to an estimated 6.5 TWh. The decrease came despite a slight increase in power demand and was primarily driven by stronger-than-expected wind generation, which surged by nearly 65% w/w, alongside improved nuclear output. Together, these gains displaced thermal generation from the power mix, weighing on both gas- and coal-fired output. Looking ahead, we anticipate an increase in gas-fired generation as temperatures across the continent are expected to drop and wind speeds are forecast to decline sharply.
EU-25 weekly gas-fired generation (TWh)
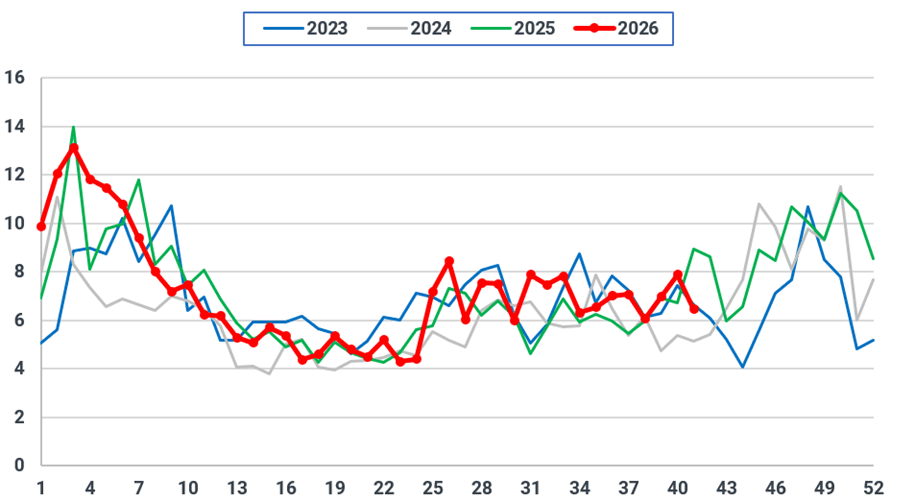
Source: Kpler Power, Kpler Insight.
EU-27 underground gas storage levels rose to 74% full as of 13 October, up 1.1 percentage points w/w. Average daily net injections slowed down last week amid higher gas consumption and reduced LNG supply into the continent. Looking ahead, Kpler Insight expects the pace of injections to slow into next week as overall supply is anticipated to decline amid higher consumption from lower temperatures and underperforming wind generation.
EU-27 daily UGS change since 1 April (bcm)
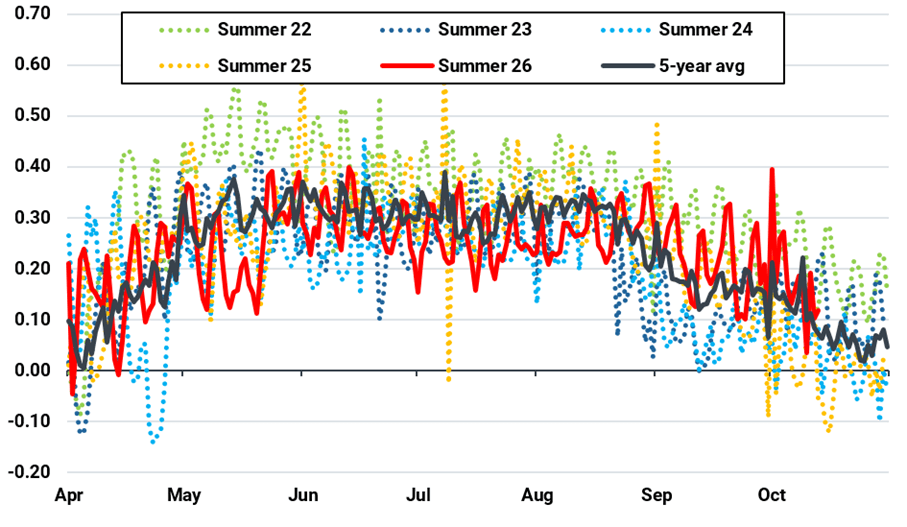
Source: GIE, Kpler Insight. Latest data as of 13 October 2026.
Asia: LNG prices to remain slightly bullish as TTF strength and Hormuz supply risks outweigh weaker regional demand
Asian spot LNG prices rose by $0.51/MMBtu w/w to $26.39/MMBtu on 14 October, supported by firmer European TTF prices, heightened Middle Eastern geopolitical risks, and selective Southeast Asian spot procurement. However, subdued Northeast Asian buying and elevated prices limited the demand upside, leaving Asian LNG prices increasingly influenced by European market strength and supply-side uncertainty.
We expect Asian spot LNG prices to remain slightly bullish over the coming week, as firm TTF prices and persistent uncertainty over Middle Eastern LNG supply outweigh weaker regional demand fundamentals. Softer Chinese industrial consumption, stronger South Korean coal generation and elevated Japanese utility inventories continue to limit Northeast Asian spot procurement, while selective buying across South and Southeast Asia provides modest support. Stronger European prices also favour Atlantic LNG deliveries into Europe, potentially restricting flexible supply available to Asia. The rollover to the higher-priced December contract should mechanically lift the quoted front-month assessment, bringing winter supply risks into sharper focus. Further geopolitical escalation remains the main upside risk, while improving Middle Eastern LNG availability and subdued Asian demand could cap gains.
Weather is expected to provide limited support to Asian LNG prices over the coming week, as easing cooling demand across Japan and South Korea outweighs residual cooling requirements in East and South China, India and Thailand. Emerging heating demand in northern China offers a partial offset, but temperatures trending towards seasonal norms across much of the region leave the overall weather impact neutral to slightly bearish for Asian LNG prices.
Forecasted average temperatures for Asian countries (°C)
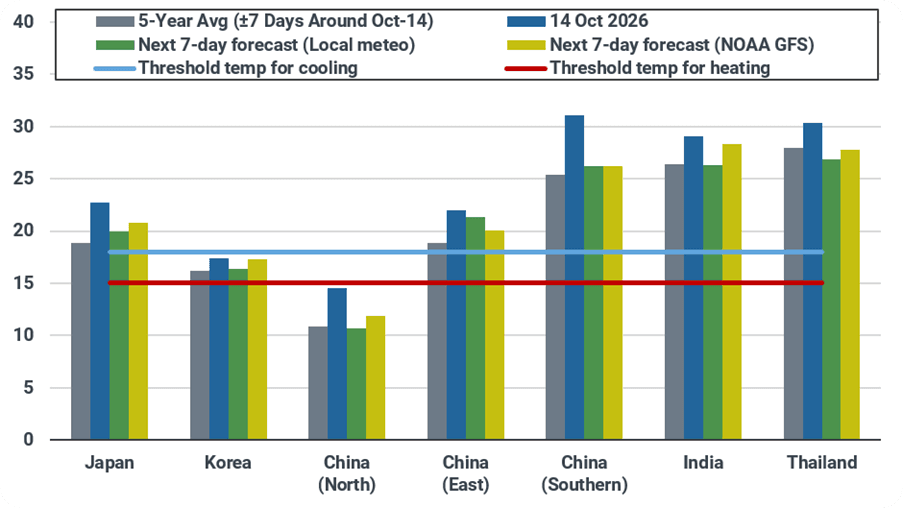
Source: Meteostat, Kpler Insight. As of 15 October 2026 00:00:00 UTC. Population-weighted average temperature of selected major cities across a country is shown for both historical and forecast.
Japan's prompt LNG demand remains subdued as major power utility inventories continue to build despite lower imports. Stocks rose 0.07 mt w/w to 2.64 mt as of 11 October, the highest since December 2023, while LNG imports declined to around 0.97 mt from 1.2 mt. Mild weather reduced electricity demand by around 2% w/w and gas-fired generation by around 3%, limiting inventory withdrawals. Elevated utility stocks reinforce Kpler Insight's outlook for reduced winter restocking requirements and limited near-term Japanese spot procurement, with potential surplus cargo resales adding downside pressure to Asian LNG prices.
Japan implied total LNG inventory forecast (mt)
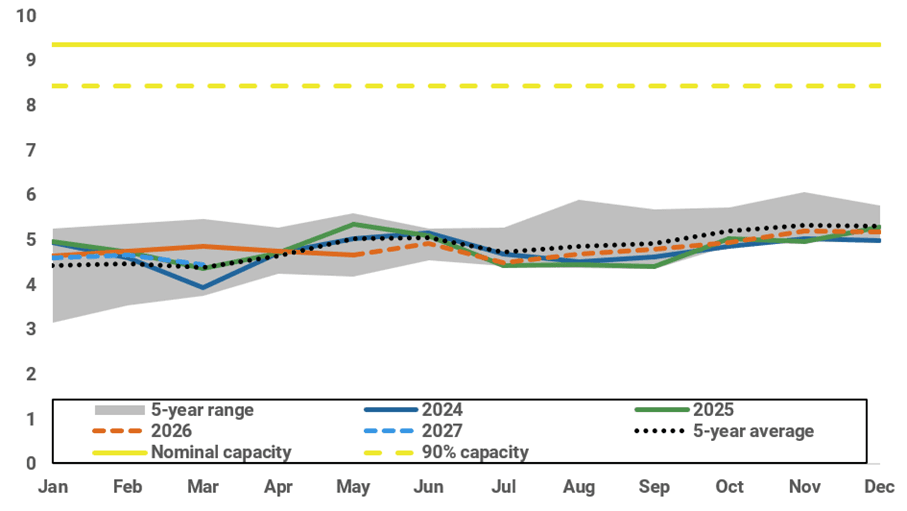
Source: METI, Kpler Insight
South Korea's stronger coal-fired generation and improving nuclear availability are expected to limit LNG demand through Q4. Indeed, Kpler Insight lowered its 2026 LNG demand forecast by 0.3 mt to 46.6 mt, reflecting weaker gas-for-power requirements. Available coal fleet utilisation is projected to average 63.5% in November–December, around 2% higher y/y, while LNG inventories are expected to rebuild from 4.2 mt at end-September to 4.8 mt by end-November, remaining below seasonal averages. Stronger competing generation and measured inventory rebuilding should limit discretionary spot purchases, exerting modest downward pressure on November–December Asian LNG prices.
Monthly coal plant maintenance (GW) and estimated coal-fired load factor in Korea (%)
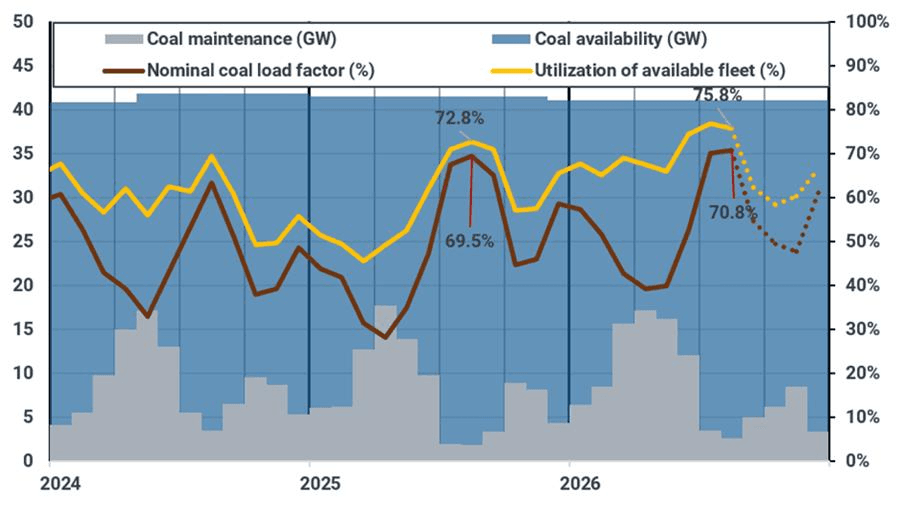
Source: KPX, Kpler Insight. Note: 1) Coal maintenance calculation methodology prioritises latest maintenance records and exclude older, placeholder records. 2) Nominal coal load factor is calculated based on actual coal-fired generation and nominal installed coal capacity; available coal load factor is calculated based on nominal capacity excluding units under maintenance.
South Korea monthly implied LNG inventory (mt)
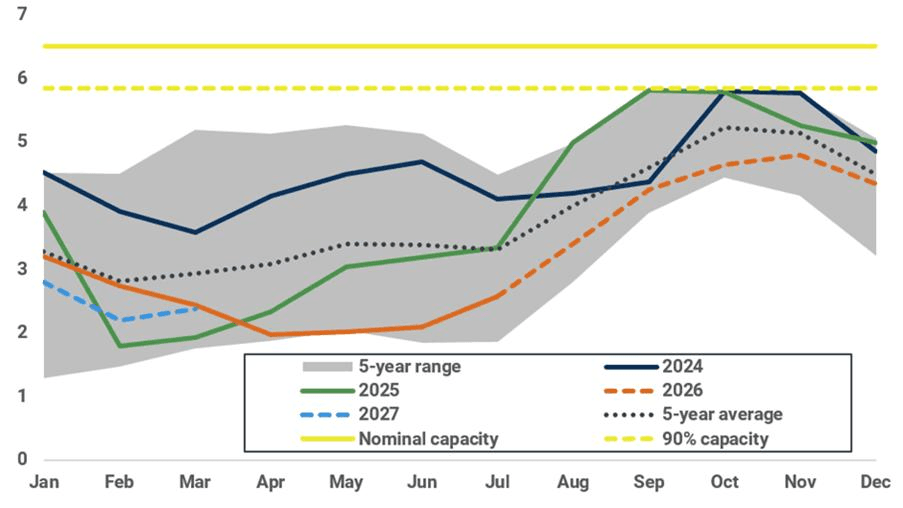
Source: Kpler Insight, KESIS
Korea available nuclear capacity by unit (GW)
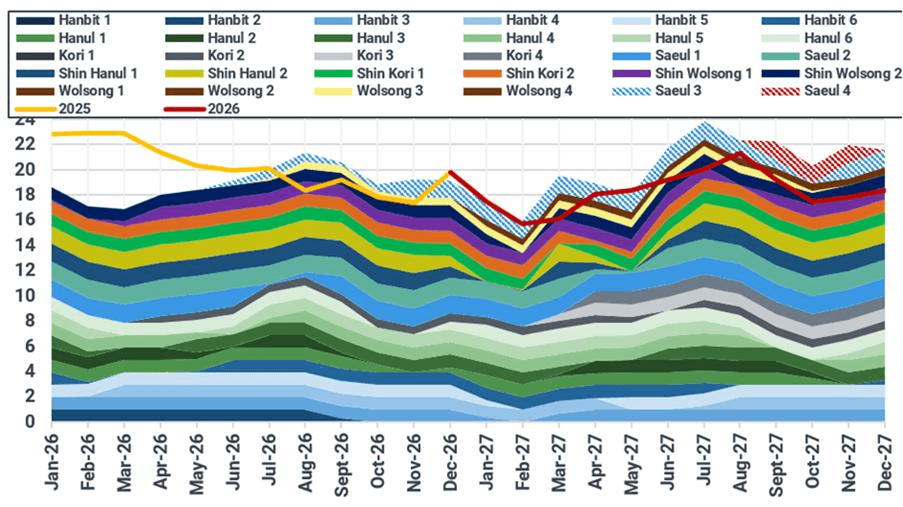
Source: KHNP, Kpler Insight
China remains a key bearish driver for November–December Asian LNG prices, as weaker industrial demand limits winter spot procurement. August apparent gas consumption fell 4.3% y/y, while weak manufacturing activity and deteriorating methanol economics prompted Kpler Insight to lower its 2026 LNG demand forecast by 0.6 mt to 61.3 mt. Preliminary September customs data reinforce this weakness, with LNG imports down 0.48 mt y/y to 5.2 mt, partly offset by a 0.34 mt increase in pipeline imports, broadly in line with expectations. Lower industrial gas requirements reduce discretionary winter spot buying, weighing on Asian LNG prices, although colder weather and tighter inventories remain upside risks.
Chinese methanol-to-olefins gross margins ($/ton)
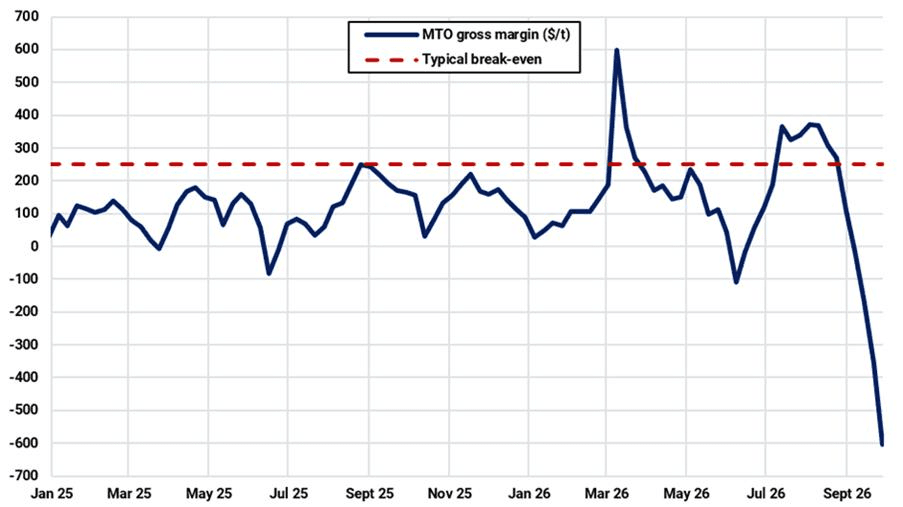
Source: Argus, Kpler Insight.
China’s annual gas demand by sector (Bcm)
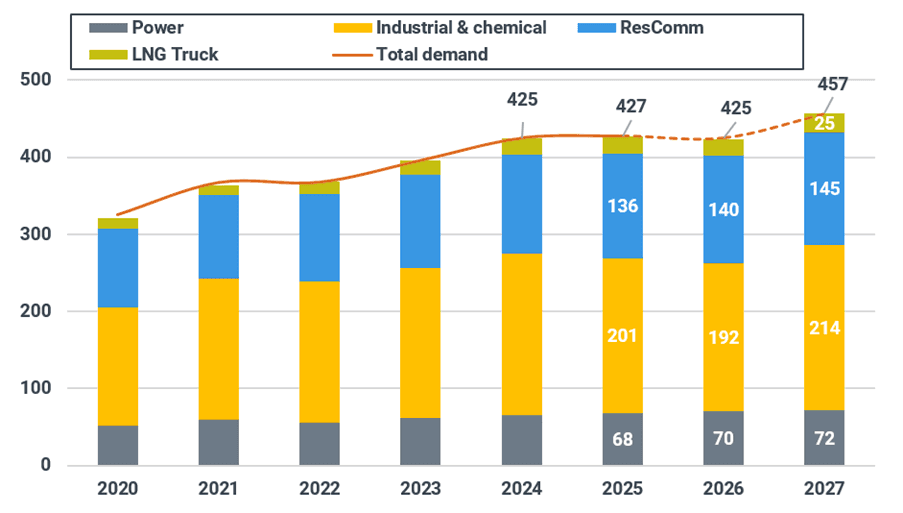
Source: NDRC, NBS, NEA, CEC, Kpler Insight
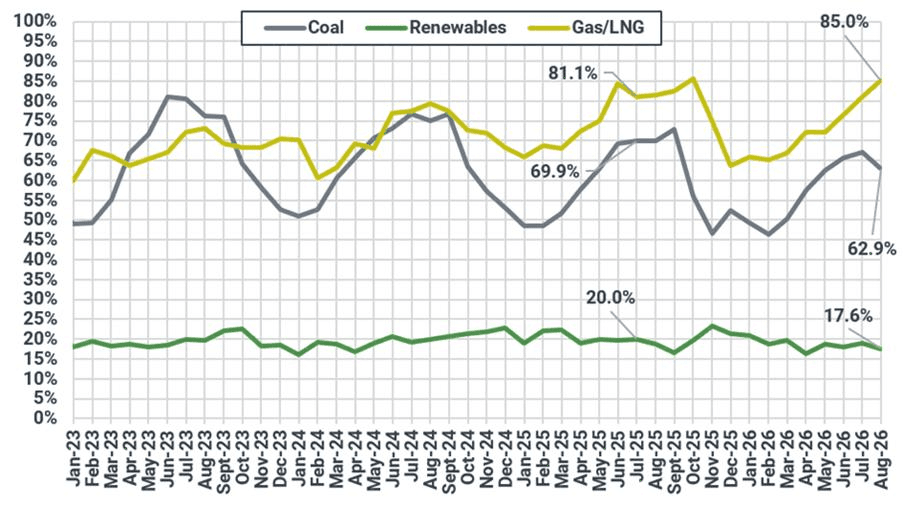
Taiwan provides a modest bullish offset to weaker Northeast Asian LNG demand, supported by lower coal utilisation and stronger gas-fired generation. Kpler Insight raises its 2026 LNG demand forecast by 0.1 mt to 24.6 mt, as coal utilisation fell 7.1 percentage points y/y to 62.9% in August, while gas-fired output rose 1.58 TWh y/y. Government policy prioritising gas and renewables limits gas-to-coal switching despite elevated LNG prices, reinforcing continued coal displacement. Incremental LNG requirements equivalent to around one to two cargoes provide slight upside to Asian LNG prices, contingent on additional spot procurement.
Historical and projected power generation y/y changes by fuel type (TWh)
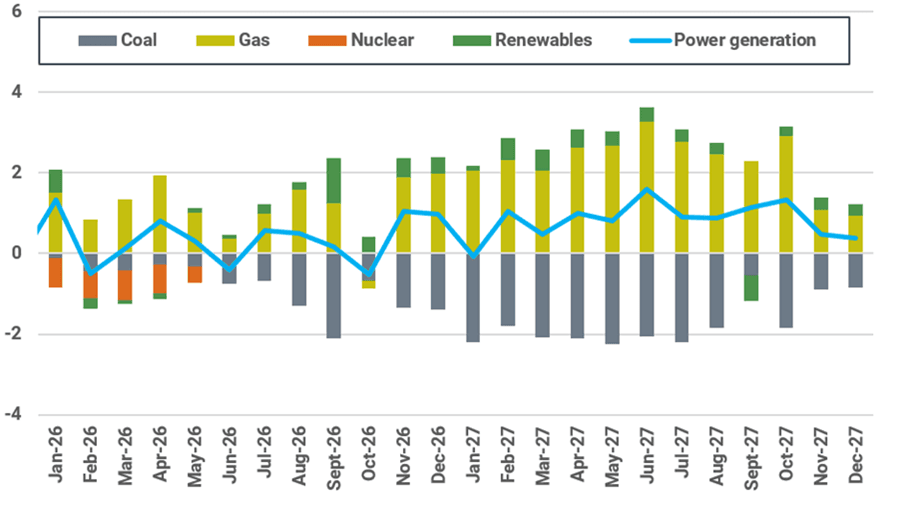
Source: MOEA, Taipower, Kpler Insight. Note: Taipower real-time data is used for September 2026. Kpler Insight forecast data starts from October 2026.
Historical monthly average utilisation by fuel type (%)
Source: MOEA, Kpler Insight
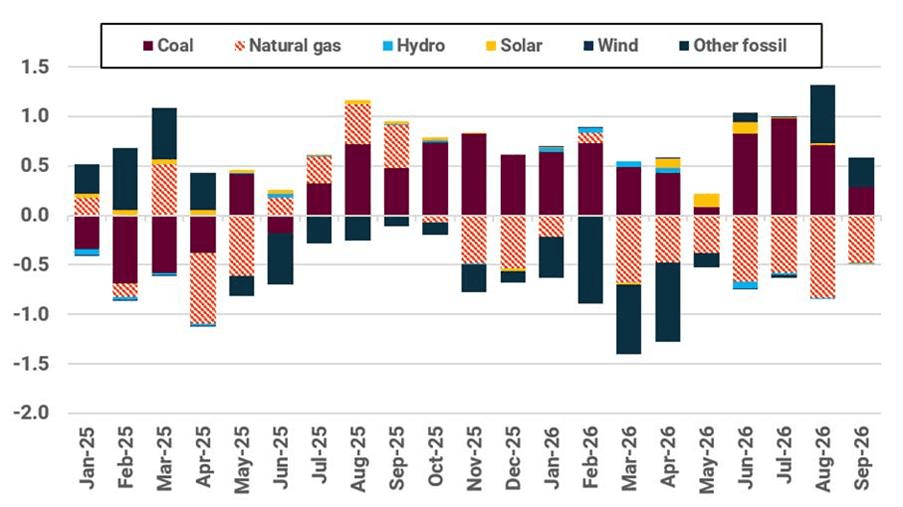
Bangladesh remains an active spot LNG buyer, although underlying demand offers limited additional upside. Kpler Insight maintains its 2026 LNG demand forecast at 6.7 mt, as constrained gas availability and competing coal and fuel-oil generation limit incremental gas-for-power requirements. Gas-fired generation recovered 3% m/m in September but remained 4% lower y/y during 1–11 October despite stronger electricity demand. Meanwhile, QatarEnergy's ongoing force majeure continues to disrupt contracted deliveries, sustaining replacement spot procurement through Q4. Bangladesh's buying requirements remain broadly in line with previous expectations, providing continued support to Asian LNG prices but limited incremental upside.
Bangladesh power generation y/y (TWh)
Source: Power Grid Bangladesh PLC
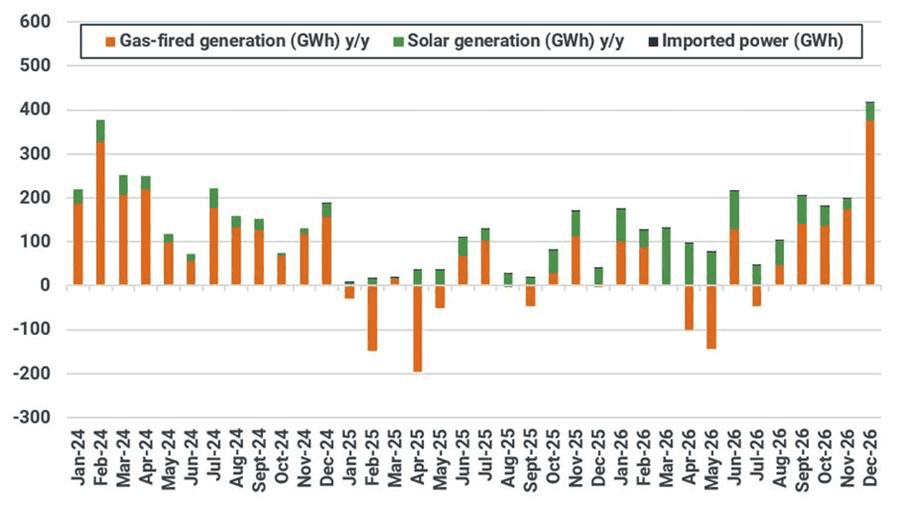
Singapore's LNG demand outlook remains stable despite firm gas-fired generation and cooling requirements. September gas-fired output rose 0.32 TWh y/y to 4.92 TWh, with above-normal October–November temperatures expected to sustain electricity demand. However, generation trends remain in line with our expectations, leaving Kpler Insight's 2026 LNG demand forecast unchanged at 5.0 mt. Pipeline gas availability and contracted LNG deliveries remain key determinants of incremental spot requirements, leaving Singapore's impact on prompt Asian LNG prices broadly neutral.
Year-on-year changes in Singapore’s monthly power generation by fuel (GWh)
Source: EMA, EMC, Kpler Insight. Note: Latest EMA data is as of June 2026, while EMC data is used for July-September 2026. Kpler Insight forecast starts from October 2026.
Meanwhile, recent tenders across South and Southeast Asia signal pockets of additional spot demand despite elevated LNG prices. Vietnam's PV Gas awarded a DES cargo for delivery to Thi Vai between mid-October and early November at $28.00–28.50/MMBtu, while India's GAIL secured a late-October cargo at $25.65/MMBtu. Thailand's Gulf Energy Development is also seeking an early-December cargo. These purchases sustain near-term competition for flexible LNG supply, with further upside possible from outstanding tenders. However, selective procurement rather than a broad-based demand recovery limits additional demand-led upside to Asian LNG prices.
US: Henry Hub to remain rangebound as above-average temperature forecasts reduce demand amid lower production following Hurricane Isaias
US Henry Hub front-month prices settled at $3.20/MMBtu on 14 October, trading flat with the previous week. After a larger-than-expected storage report on Thursday dragged prices down to $3.17/MMBtu, Henry Hub recovered to $3.22/MMBtu on Friday as roughly 1.2 Bcf/d of US natural gas production in the Gulf of Mexico was shut in due to Hurricane Isaias. However, the impacts of the storm on natural gas fundamentals proved muted, as power and production outages were relatively short-lived. This dynamic caused Henry Hub to retreat on Monday, settling at $3.17/MMBtu once again. However, further production curtailments due to pipeline maintenance activity and the recovery of feed gas flows into Freeport and Cove Point LNG pushed prices to $3.28/MMBtu on Tuesday. Though, this rally proved temporary as unsupportive two-week temperature forecasts and surging wind generation offset lower supply.
Kpler Insight expects Henry Hub to remain between $3.15-3.25/MMBtu for the coming week as weak weather-driven demand offsets bullish momentum from lower domestic gas production and a high likelihood of a below-average upcoming storage report.
US domestic gas consumption by sector (bcf/d)
Source: EIA
US gas consumption averaged 67 Bcf/d over the last seven days, down 3.3 Bcf/d from the previous week. Modest demand destruction from Hurricane Isaias and cooler temperatures in the Midwest and Northeast reduced gas-fired power burns by nearly 4 Bcf/d w/w to 35 Bcf/d. A brief surge of heat going into this week may bring gas consumption in the power sector back above 40 Bcf/d, after which seasonally mild conditions across much of the US reduces power demand.
Forecast of cooling degree days
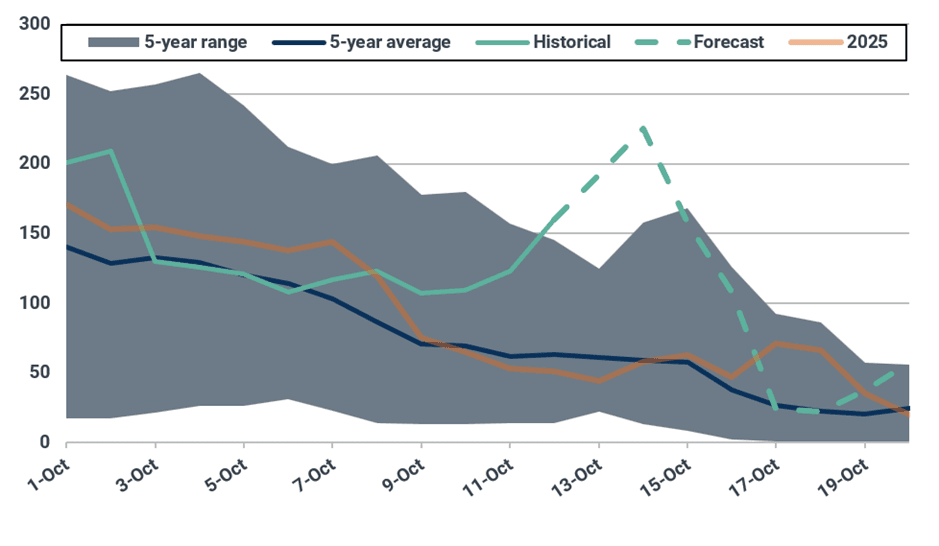
Source: National Weather Service
Forecast of heating degree days
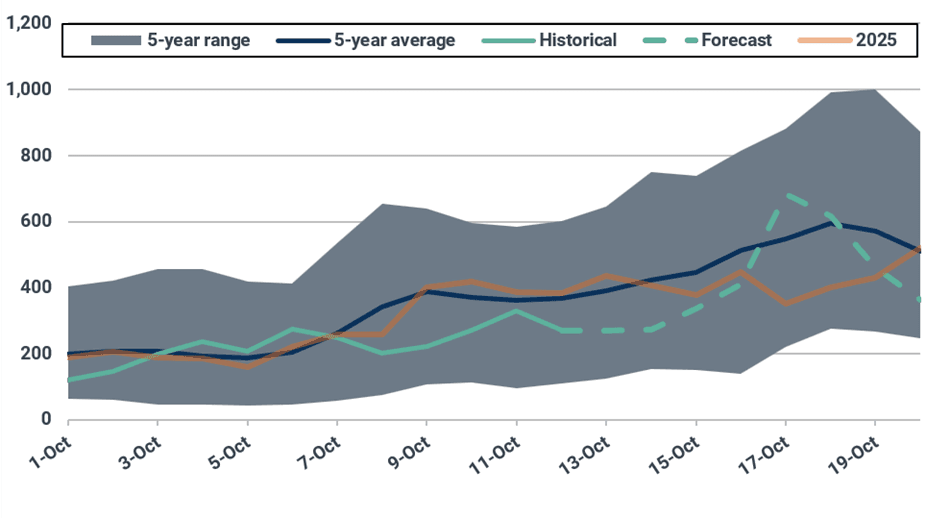
Source: National Weather Service
Dry gas production averaged 106-7 Bcf/d over the last week as Hurricane Isaias forced shut-ins at offshore fields and pipeline disruptions reduced output from Appalachia. Additionally, low local gas hub prices in the Northeast continue to support voluntary curtailments from operators in the region. Kpler Insight expects natural gas production to average 108 Bcf/d for the coming week as offshore supply recovers and some pipeline maintenance activities are completed. This is far below the 112 Bcf/d highs seen in mid-August.
Forecast of natural gas volumes in underground storage (bcf)
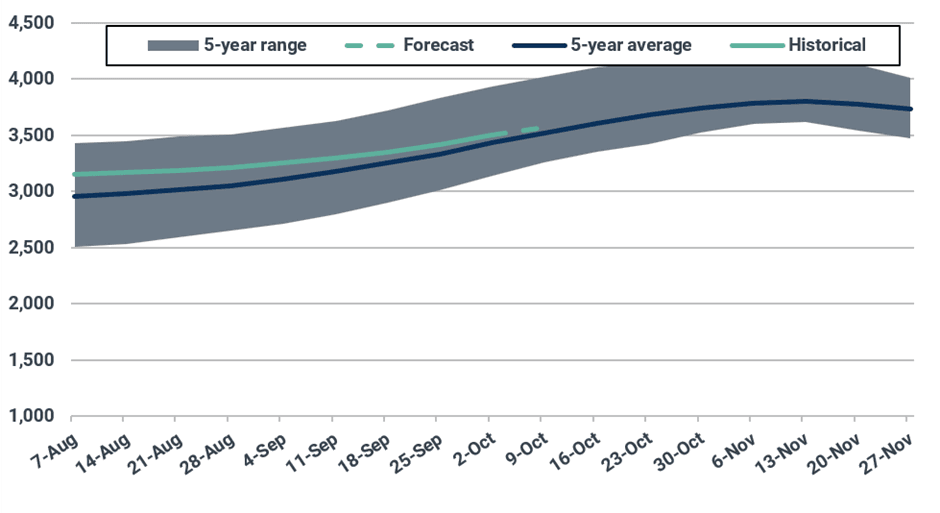
Source: EIA, Kpler Insight
The US injected 85 Bcf into underground storage for the week ending 2 October, coming in on the higher end of consensus estimates. Inventories rose to 3,500 Bcf, reducing the surplus above the five-year average to 2.0% from 2.4% the week prior. Another below-average net injection is expected for the week ending 9 October as lower production limited gas available for storage. Kpler Insight forecasts a net storage build of 71 Bcf in the upcoming storage report.
Global LNG supply: Russian Arctic LNG 2 loadings drive global export rebound to 8.14 mt last week
Global LNG exports rose by 0.37 mt w/w (+5%) to 8.14 mt last week, which left exports 0.22 mt above their four-week average, though still 0.46 mt below a year ago. Gross moves of about 0.9 mt up and 0.5 mt down across regions largely netted out. The main drivers were Russia's Arctic LNG 2 (+0.32 mt w/w), which loaded five cargoes after none the previous week, the Russian Far East (+0.17 mt w/w) and reload terminals (+0.15 mt w/w); primary exports rose by 0.22 mt to 7.93 mt. Lower Indonesian (-0.18 mt w/w), Nigerian (-0.16 mt w/w) and US (-0.11 mt w/w) exports were partial offsets.
Global LNG exports (mt, 10-day moving average)
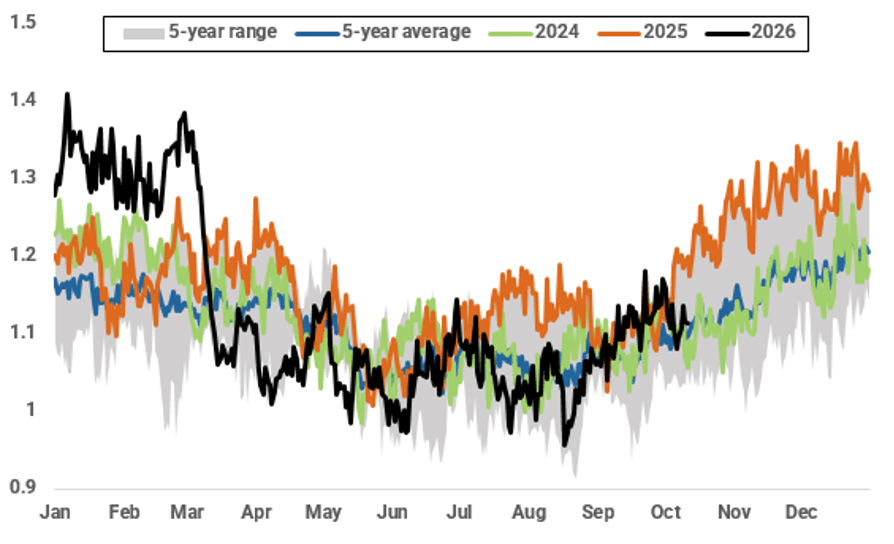
Source: Kpler Insight
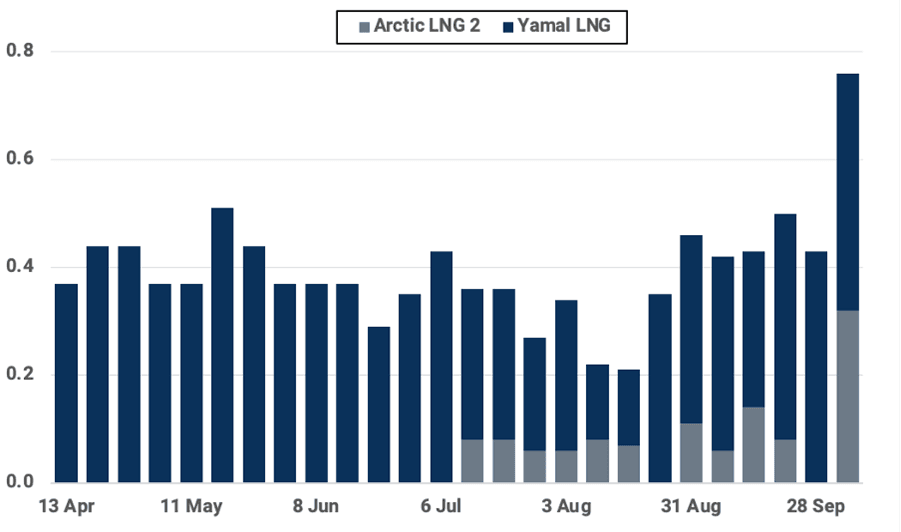
Northern Russia constituted the largest regional increase, rising by 0.33 mt w/w to 0.76 mt. This is the highest weekly total on record, equivalent to about 101% of nameplate capacity and 86% above the 13-week average of 0.41 mt. The w/w increase was driven by Novatek's 19.8 mtpa Arctic LNG 2, which loaded five cargoes (0.32 mt) after none the previous week. Yamal LNG held at 0.44 mt for a second week, equivalent to 132% of nameplate capacity, and therefore with little room to grow exports w/w. Early data for the week beginning 12 October show no Arctic LNG 2 loadings so far and 0.15 mt from Yamal, suggesting last week's surge may partly reflect clustered liftings rather than a step-change. However, both facilities are maximising their use of the Northern Sea Route season as the bulk of last week’s exports are headed for China.
Yamal LNG and Arctic LNG 2 exports (mt)
Source: Kpler Insight
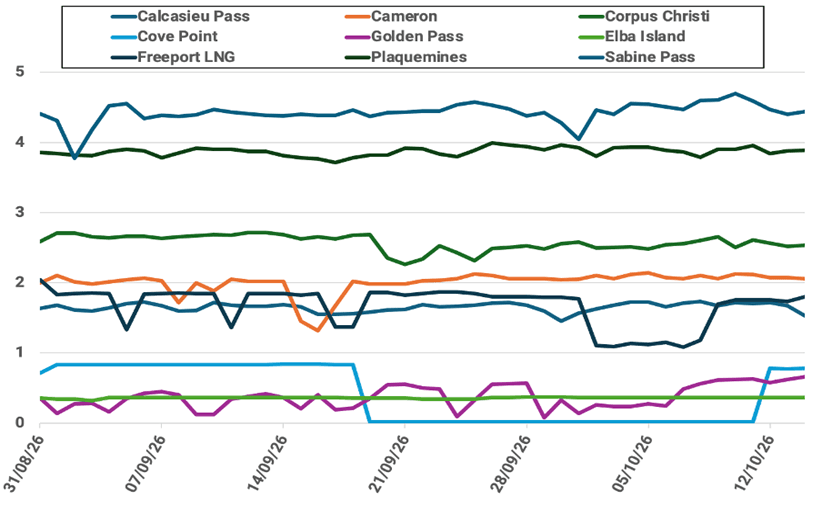
US exports fell by 0.11 mt w/w to 2.39 mt on account of seasonal maintenance. Freeport LNG more than accounted for the decrease (-0.17 mt w/w to 0.18 mt, an eight-week low), loading three cargoes versus five the previous week. Freeport LNG shut Train 2 for maintenance on a compressor system on 2 October but returned to full feedgas intake on 9 October. Early data for the week beginning 12 October show Freeport exports recovering (0.22 mt so far). At the 5.3 mtpa Cove Point facility seasonal maintenance finished, but cargo loadings are only expected to resume from 21 October via the Energy Universe, followed by the Gaslog Seattle. The plant’s October liftings are currently expected to be 0.13 mt. Elsewhere, one-cargo swings largely offset one another, leaving the other terminals 0.06 mt higher in aggregate. Midstream bottlenecks are currently one of the main issues for growing US LNG exports.
US feedgas deliveries by liquefaction plant (Bcf/d)
Source: Williams, Cheniere, Boardwalk, Sempra, Kinder Morgan, Venture Global, Berkshire Hathaway, Golden Pass Pipeline
West Africa fell by 0.08 mt w/w to 0.55 mt, the weakest week since August, mainly as Nigeria LNG's 22.2 mtpa Bonny complex shipped two cargoes less (-0.16 mt w/w to 0.28 mt), reversing the previous week's 13-week high. The dip looks temporary: early data for the week beginning 12 October already show 0.22 mt loaded from Bonny. The 5.2 mtpa Angola LNG plant loaded one cargo fewer (-0.07 mt w/w), but this was more than offset by a shipment each from Eni's two Congo FLNG units.
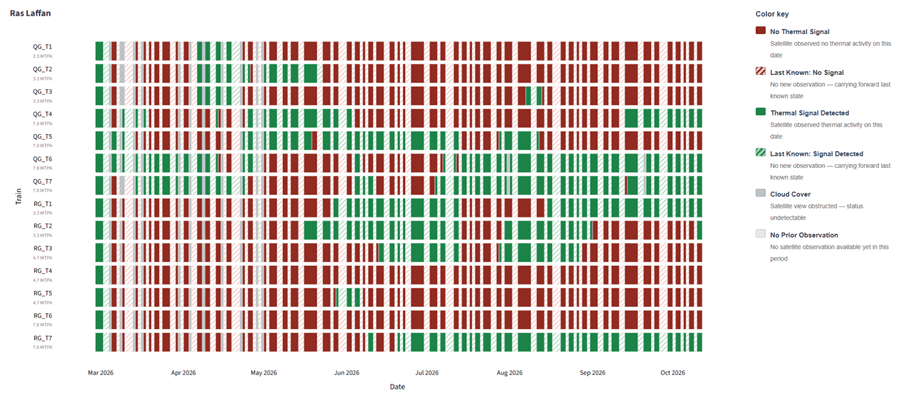
The number of detected dark transits through the Strait of Hormuz grew significantly. At the time of publication, eight vessels have been confirmed to have exited the Persian Gulf dark last week, with six carrying Qatari LNG and two ADNOC cargoes from the UAE’s Das Island plant. India received around 45% of these volumes, with a similar share likely en route to East Asia. The remaining ~10% was delivered to Pakistan on 8 October by the Q-Max Al Mafyar, which openly took the Iranian route (see Kpler’s Strait of Hormuz dashboard). The latest satellite imagery captured on 11 October showed Ras Laffan thermal activity increased to six trains, up from five during the past two weeks.
Ras Laffan thermal activity detected by satellite imagery on 11 October
Source: Kpler Insight
Elsewhere in the region, Omani loadings at the 11.4 mtpa Qalhat complex held at 0.15 mt for a second week, 33% below the 13-week average of 0.22 mt. Maintenance at Oman LNG’s 3.8 mtpa Train 1 seems to be ongoing following the start of scheduled work on 1 September. The current maintenance duration of more than one month exceeds the plant’s historic norm and an official end remains unknown. Oman LNG typically exports 3-4 cargoes a week.
Australian exports dipped 0.06 mt w/w to 1.50 mt, as scheduled six-week maintenance at Chevron’s 8.9 mtpa Wheatstone LNG began. Maintenance is due to last until 19 November, affecting 1.5–2 trains, and is expected to weigh on October–November supply by about 1.0–1.3 mt. Moreover, Australia's proposed domestic gas reservation policy poses a medium-term upside risk to Asian LNG prices, with no immediate impact on prompt supply. The proposed 20% domestic reservation requirement from 2028 could constrain uncontracted LNG exports, particularly from Queensland projects, although existing contracts and infrastructure constraints may limit the impact on export volumes.
Market Insights you can trust
Kpler delivers unbiased, expert-driven intelligence that helps you stay ahead of supply, demand, and market shifts.
Trade smarter. Request access to Kpler today.

See why the most successful traders and shipping experts use Kpler