

Gasoil and RBOB CTAs flip net short as crude liquidation deepens
Systematic liquidation on Nov 10 has pushed Gasoil and RBOB Trend CTAs net short for the first time in over four months, with substantial further selling potential across crude and products amid shifting US-Iran expectations.
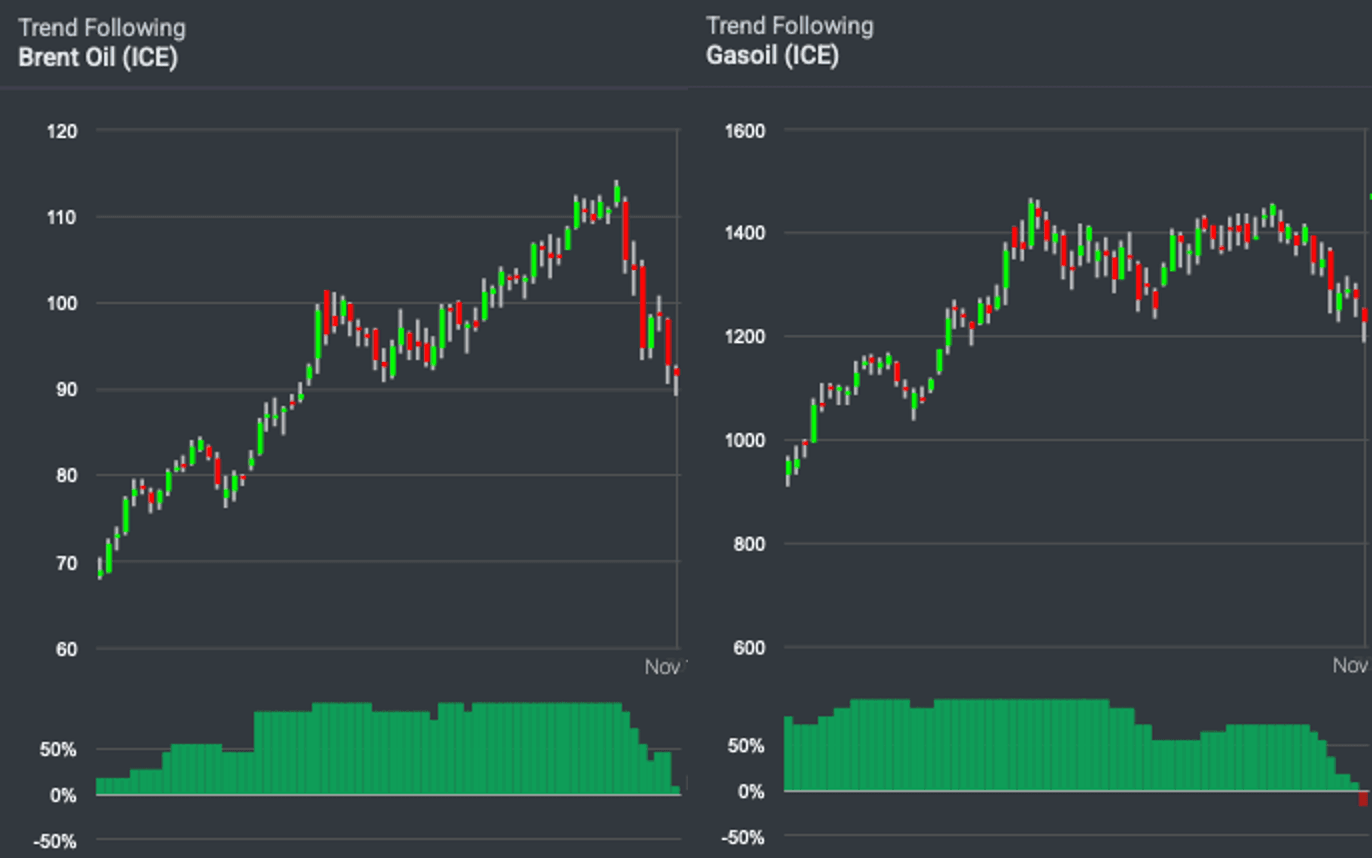
Trend-following CTA selling intensified across crude and refined products, with another ~50.0k lots (48.2 mbbl) sold on Nov 10, following heavy liquidation on Nov 4–5 (see here). Brent led with 35.7k lots (35.7 mbbl) sold, reducing exposure from 45% to just 9% long. Gasoil CTAs sold 6.7k lots (5.0 mbbl), flipping from 9% long to −18% short, the first net short since Jul 3. RBOB added 2.8k lots (2.8 mbbl) of shorts, reaching net short −18% for the first time since Jun 30. ULSD CTAs sold 4.1k lots (4.1 mbbl), reaching neutral, while Dubai trimmed another 570 lots (0.6 mbbl).
WTI's heaviest selling occurred earlier, with 19.6k lots (19.6 mbbl) sold on Nov 4 and 15.7k lots (15.7 mbbl) on Nov 5, leaving just 9% long exposure by Nov 9. Across all six markets, Trend CTAs have sold ~146k lots (141.4 mbbl) since Nov 3. Reversion CTAs remain at max short in Brent and WTI, −86% short in Dubai and −43% short in Gasoil and ULSD, while Value Pattern CTAs are neutral across all six markets. No Trend CTA executions have been completed on Nov 11, but further selling is underway in WTI and Dubai.
Substantial further Trend CTA selling capacity remains before reaching max short: 107.0k lots (107.0 mbbl) in Brent, 47.1k lots (47.1 mbbl) in WTI, 8.6k lots (8.6 mbbl) in Dubai, 20.2k lots (15.0 mbbl) in Gasoil, 15.2k lots (15.2 mbbl) in ULSD and 12.8k lots (12.8 mbbl) in RBOB. However, neutral Trend strategies in WTI, Gasoil, ULSD and RBOB retain a buy-to-open bias as of Nov 11.
Fundamentals: The liquidation coincides with an unwinding of geopolitical risk premiums, as expectations of US-Iran de-escalation following the US midterms weighed on crude. By Nov 10, Brent had fallen to $91.49/bbl and WTI to $84.86/bbl, with systematic selling reinforcing broader price weakness. However, uncertainty over the Iran conflict and a recent easing in Hormuz flows (see Kpler's latest tracker) continues to fuel volatility.
ICE Brent and gasoil: outright and trend-following long/short % ($/bbl, $/mt, %)
Source: Kpler Financial Flows
This report draws on Kpler Financial Flows. The full dataset delivers daily and intraday CTA positioning, order stacks, and flow estimates - allowing you to track systematic moves as they develop, rather than after the fact. Request access to Kpler Financial Flows here or contact your Sales representative for a personalized response.
If you'd like a copy of the methodology paper, or to see Financial Flows coverage across the markets you trade, you can request a demo here.

See why the most successful traders and shipping experts use Kpler