How port call activity can reveal a changing trade route
Structured over time, port calls reveal whether trade-related activity is rising, falling, shifting or recovering. For commodity and trade-flow analysts, the first sign of change often arrives before there's enough evidence for a full market view:
- A new route starts attracting traffic.
- Activity at an established export hub falls away.
- Vessels appear at a port that previously saw little of that segment.
- A disruption ends, but it's unclear whether trade has genuinely resumed or the first sailings are isolated exceptions.
At that point, the analyst isn't looking for a final answer — just whether vessel movements support the emerging thesis strongly enough to justify deeper investigation.
Historically, that meant exporting port call records, identifying the relevant vessel population, grouping calls into time periods, and repeating the exercise every time the market shifts — slow to build, hard to maintain, and often dependent on one person remembering how the original calculation was put together.
Port Call Trends shortens that process. It turns MarineTraffic's observed vessel movements and structured port call records into a historical view of arrivals and departures, filterable by port, country, vessel type, flag, capacity, owner, operator, commercial manager and other characteristics. The first release covers IMO vessels with up to five years of history, flexible time granularity, visual trend views, and access to the underlying rows behind each chart.
Reading a port call recovery at Chornomorsk
Commercial shipping from Ukraine's Black Sea ports was heavily disrupted following the invasion in February 2022. For those following regional agricultural exports, dry-bulk markets or the resilience of the Black Sea trade, individual vessel departures naturally attracted attention. Each sailing mattered, particularly during a period when access to Ukrainian ports was constrained and the continuity of maritime exports remained uncertain.
Yet individual sailings could not answer the larger questions:
- Was commercial traffic returning in a meaningful way, or were the reported movements isolated?
- Was the route beginning to operate consistently again, or was activity still too intermittent to be a recovery?
- Had vessel departures returned to their earlier range, or was the market simply reacting to a small number of exceptional voyages?
This example covers August 2021 to September 2024, focusing on departures, narrowed to bulk carriers and dry-bulk categories, viewed monthly to absorb individual sailings into a broader pattern. That configuration matters because the usefulness of any port call analysis depends on whether the metric matches the market question.
For an export corridor, departures are the more relevant starting point — still not equivalent to loaded cargo volume, but more aligned with the trade direction being investigated. Narrowing to bulk carriers strips out tugs, passenger vessels, tankers and other unrelated traffic that could otherwise mask the signal. The monthly view then adds enough distance from individual voyages to show whether a change persists.
The resulting chart shows Chornomorsk having an established baseline of bulk-carrier departures before February 2022, which then dropped sharply through 2022–2023. From late 2023, departures began rising month after month, passing 100 per month during 2024 and reaching roughly 140 per month mid-year — above both the suppressed period and the pre-war baseline.
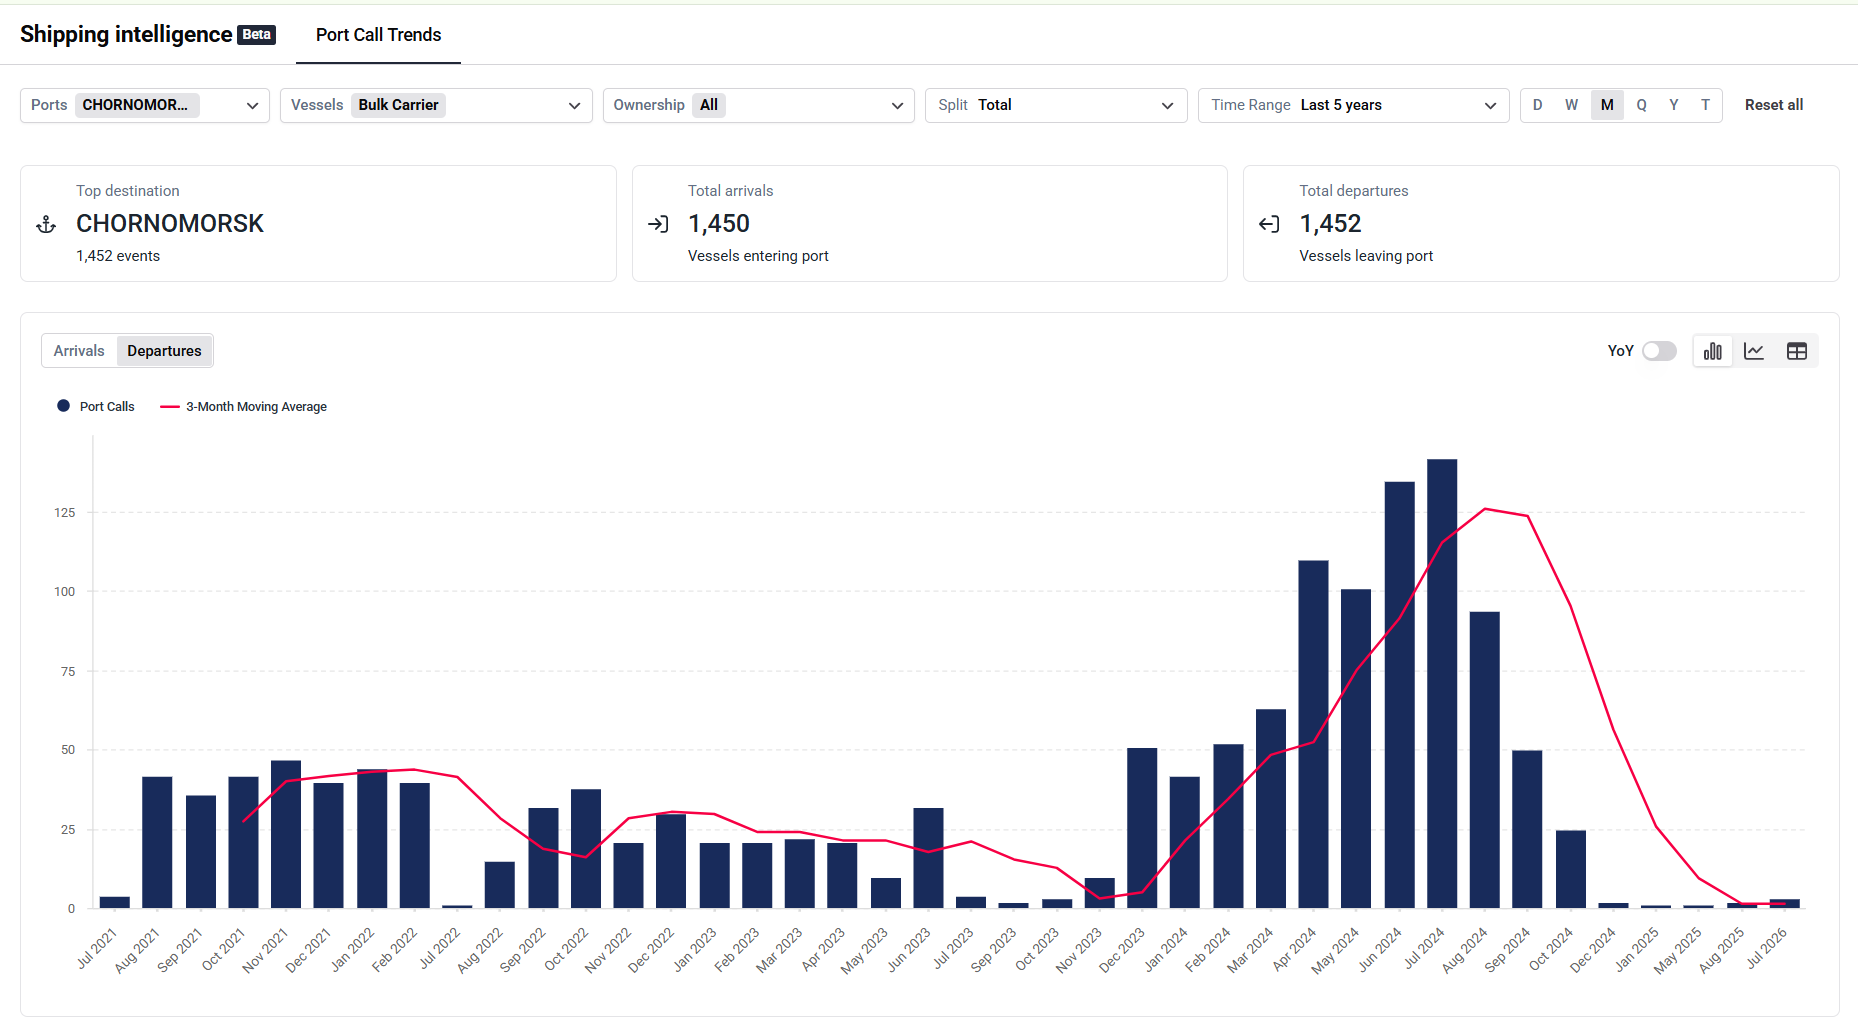
The distinction between a spike and a sustained increase is central. One busy month could reflect delayed sailings, weather, scheduling effects or a reporting anomaly. A run of elevated months is harder to dismiss. In Chornomorsk, departures didn't just tick up once — they gathered momentum from late 2023 and stayed elevated through 2024, supporting a stronger claim that bulk-carrier activity didn't just reappear, it recovered and scaled.
That's what turns port calls into a usable trade-flow signal.
Conclusions from Chornomorsk's port call record
Bulk-carrier departures were heavily constrained after February 2022, then began a sustained recovery from late 2023 — rising above 100 per month during 2024 and reaching roughly 140 around mid-year. The timing and persistence are consistent with the recovery and scaling of Ukraine's temporary maritime export corridor.
But the chart doesn't establish precise tonnage, identify cargo on any voyage, or confirm that vessels departed fully laden or carried comparable quantities. A vessel count and a cargo-volume measure answer different questions. If departures rise from 100 to 120 in a month, cargo volume won't necessarily rise 20%, as vessel mix, capacity and loading factors can all vary.
This is why Port Call Trends works best as a signal and investigative starting point, rather than as a substitute for commodity-flow data. The analyst spots the change, checks when it began and whether it's sustained, then decides what else is needed to explain it — cargo data, trade statistics, freight rates, vessel-level review, company announcements, policy developments or market reporting.
Why context changes the meaning of a port call trend
The same rise in departures can mean different things depending on port, vessel segment, timeframe and market conditions — a new export route, seasonal demand, or traffic diverted from elsewhere.
That's why a defensible workflow starts with a question, not a dashboard. For Chornomorsk, the question isn't "how many vessels departed?" but "does bulk-carrier activity show the Black Sea export corridor recovered?" That drives every choice, including:
- Departures (exports)
- Bulk carriers (dry-bulk corridor)
- A multi-year span (baseline, disruption, recovery)
- Monthly granularity (structural change, not daily noise)
A different question would mean a different setup — weekly data for a port closure, quarterly/yearly for long-term growth, a split by operator to see who's driving the increase, capacity filters to test vessel-size trends.
Port Call Trends is built for that flexibility. The same port call history can be filtered by geography, vessel profile and company, across different time periods, moving from chart to underlying rows without leaving the workspace.
A first result tends to raise the next question — which vessel sizes drove it, whether the flag mix shifted, whether a few operators or a broad population were behind it, whether nearby ports declined in parallel, whether the pattern was seasonal or structural. The value isn't just answering the first question quickly, but being able to refine it without rebuilding the dataset.
Separating structural change from normal variation
Port activity is rarely smooth. Shipping is seasonal and exposed to weather, congestion, maintenance and scheduling effects, so a single month's rise or fall isn't automatically a meaningful shift.
Historical range provides the context to tell ordinary variation from something more significant. For an economist or macro strategist, this is a core use case — a repeatable maritime activity signal, without repeated manual exports, that shows whether activity is expanding or contracting. Monthly, quarterly and yearly views offer different levels of perspective, while moving averages or year-on-year comparisons help separate noise from sustained change.
In Chornomorsk, the multi-year view stops the analyst from judging the 2024 increase against the depressed 2022 months alone. The pre-war period is a more credible reference, showing not just that activity recovered from a low, but how the new level compares with what existed before the disruption.
That distinction matters because a big jump can look dramatic if it starts from an unusually low point, even if things still aren't back to normal. While a small increase can actually be meaningful if it keeps going and goes beyond what's normal historically. The chart makes both comparisons possible at once — it's the shape of the whole sequence, not any single bar, that gives the analysis its explanatory power.
From port call observation to repeatable evidence
The question for analysts the becomes: how efficiently can you turn vessel activity into a consistent view?
A manual workflow means exporting port call records, filtering vessel types, standardising dates, handling duplicates, aggregating by month, charting, and storing the logic in a workbook — then starting much of it over for the next port, segment or period. This results in an analysis tied to one spreadsheet, inconsistent filters across teams, unclear methodology, and updates too slow for the market.
Port Call Trends doesn't remove the need for judgement — location, metric, segment and period are still the user's call. It removes the mechanical rebuild. History can be extended, the vessel population narrowed, the chart split by owner or operator, rows reviewed, or a nearby port checked for diverted traffic — all without starting over.
That makes the evidence more repeatable and easier to interrogate, and opens it to more users:
- A commodity desk testing a thesis;'
- A researcher tracking regional resilience;
- A consultant citing it as evidence;
- A commercial team spotting opportunity in a recovery.
The vessel activity hasn't changed. What changes is the question being asked of it.
Other use cases for port call analysis
The method transfers directly to other maritime trade flow data questions:
- Substitution between ports: if traffic at one regional port is falling while a nearby alternative rises, a comparison using the same vessel segment and time period can test whether activity is shifting rather than disappearing.
- New infrastructure: if a port begins handling a vessel type it previously saw rarely, the arrival series may show a structural break worth tracking for recurrence.
- Sudden disruption: monthly vehicle-carrier arrivals at Baltimore fell from roughly 47 in March 2024 to almost zero in April, following the Key Bridge collapse, before recovering as access was restored — the same analytical logic as Chornomorsk, applied to a sharp, time-bound interruption instead of a gradual recovery.
A workflow for validating a trade-route thesis
- Start with an observable development (a disruption, a policy change, a new route rumour).
- Identify the port, country or corridor most directly exposed to it.
- Choose arrivals or departures based on the direction of trade being tested.
- Filter to the relevant vessel type, flag, capacity or ownership dimension.
- Select a historical range long enough to establish a baseline.
- Check whether any change is sustained across multiple periods, not confined to a single month.
- If the pattern holds, move to cargo data, freight rates, trade statistics or market reporting to build the fuller picture.
Reading port calls as a signal, not a record
MarineTraffic has long shown users vessels, movements, and port calls. Port Call Trends applies a different lens to that foundation — not table versus chart, but individual events versus the pattern they create over time.
A port call record answers: which vessel arrived or departed, and when?
A trend view asks: is activity changing, where is it concentrated, and does it support the market question being investigated?
For Chornomorsk, that's the sustained recovery of bulk-carrier departures from late 2023 into 2024 — not the whole story of Ukrainian exports, and no substitute for commodity and market context, but clear evidence that maritime activity tied to the corridor recovered and scaled.
That's the practical value of port calls as a trade-flow signal: the point where scattered vessel movements become a coherent pattern, and a hypothesis becomes strong enough to investigate further.

See why the most successful traders and shipping experts use Kpler

Turn port call activity into actionable intelligence
.jpeg)