Hormuz Strait disruptions trigger a price spike in TTF and Asian LNG, while Middle East exports come to a halt
Geopolitical tensions in the Middle East halted LNG transit through the Strait of Hormuz, sending TTF and Asian LNG prices sharply higher. The loss of Qatari exports and growing competition for Atlantic cargoes are tightening global LNG balances. Meanwhile, Henry Hub shows a muted reaction, holding near $3.00/MMBtu.
Market & Trading Calls
European TTF front-month price outlook: Bullish, as the war in the Middle East, worries on Qatari supply, and higher competition with Asian buyers will put upward pressure on prices. Milder temperatures and ample gas supply for the week ahead will somewhat offset this bullish pressure.
Asian LNG front-month price outlook: Bullish, as Hormuz supply risk could remove up to 5.8 mt of Middle East LNG in March, tightening balances and forcing Asia to compete for Atlantic Basin cargoes, with early signs of US and Atlantic LNG diversions toward the Pacific as the inter-basin arbitrage widens.
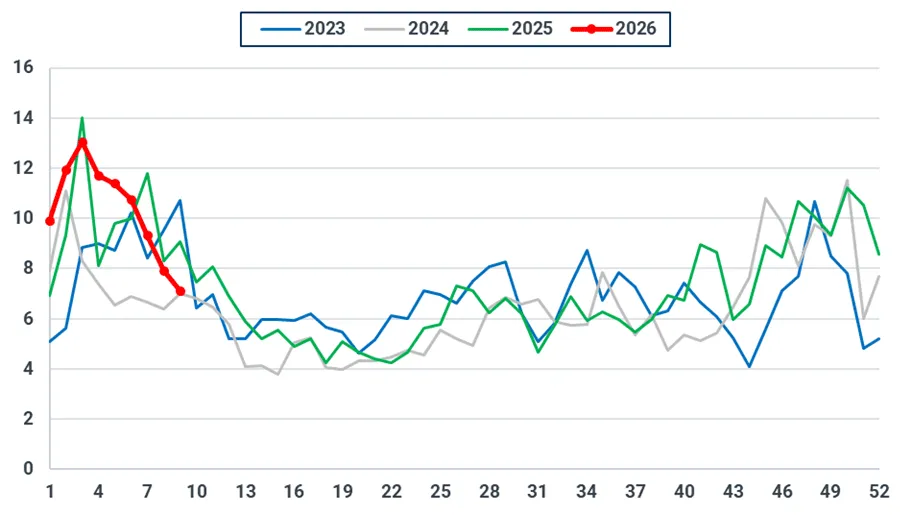
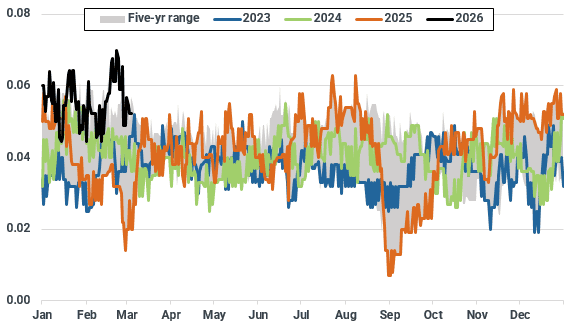
Asian LNG – TTF spread outlook: stable, as both indices are set to rise on the back of the conflict in the Middle East. The TTF premium widened to $1.54/MMBtu on 4 March, with TTF outpacing Asian LNG prices in recent trading sessions.
US Henry Hub front-month price outlook: Stable as bearish temperature forecasts and strong production offset the impacts of geopolitical risk and robust LNG feed gas demand.
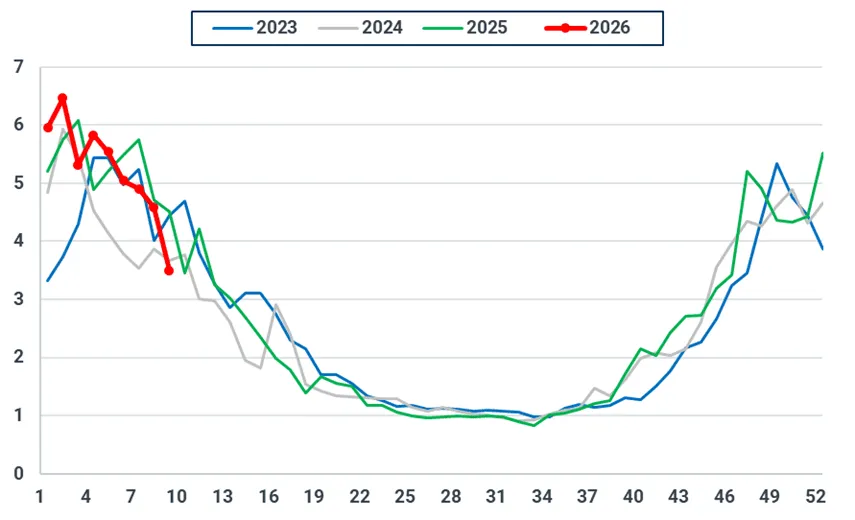
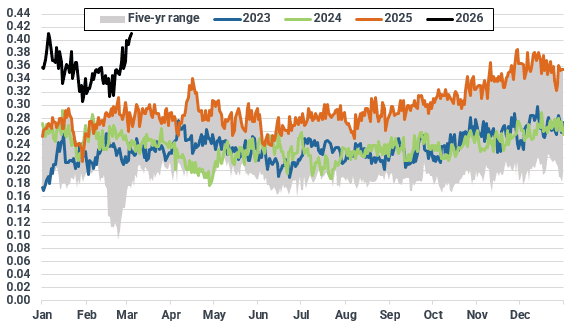
Key natural gas and LNG front-month prices ($/MMBtu)
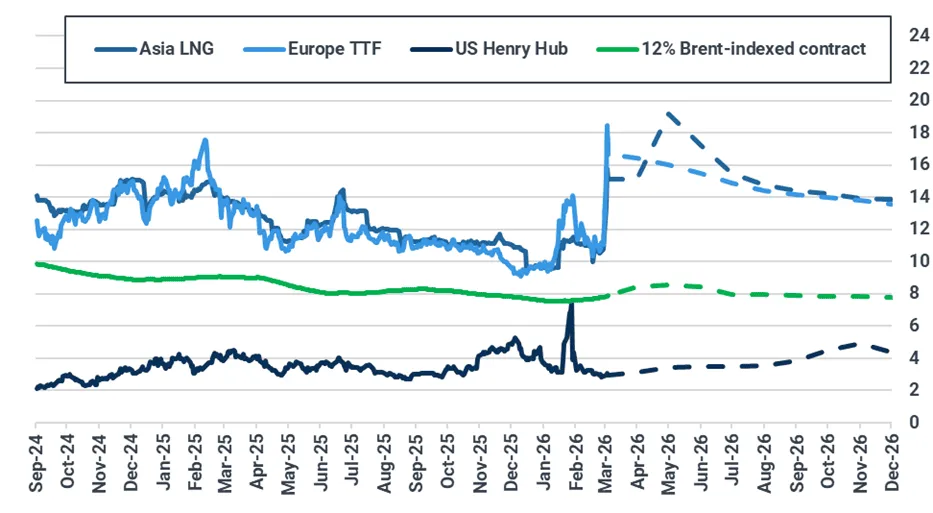
Source: ICE, NYMEX, Spark Commodities. Brent-indexed price represents 12% slope of 90-day moving average of Brent contract.
Asian LNG-TTF front-month spread ($/MMBtu)
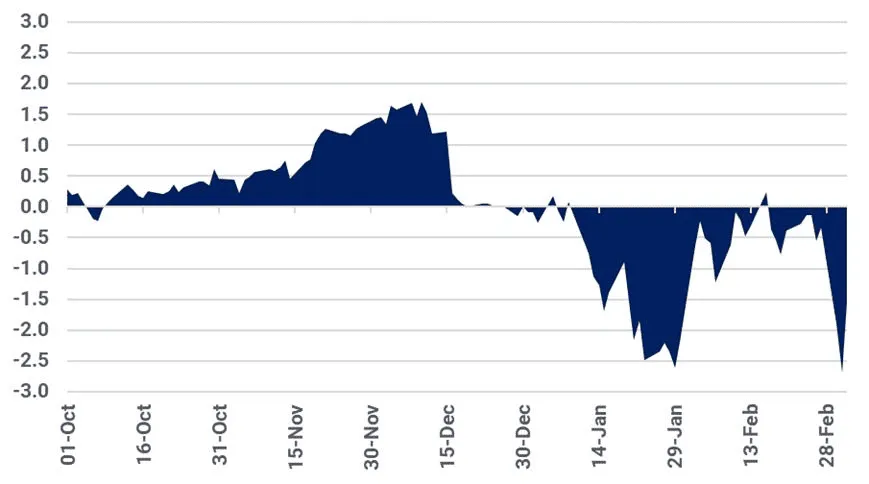
Source: ICE, Kpler Insight
Europe: Bullish pressure on TTF amidst halted Hormuz transit
The European TTF front-month contract strongly increased to $16.7/MMBtu on 4 March, up 55% from $10.72/MMBtu on 25 February. This was due to the effective halt in LNG traffic via the Hormuz Strait and the shutdown of Qatar’s 77 mtpa Ras Laffan plant on Monday, due to the ongoing conflict in Iran and the wider Mideast Gulf. This is the highest level reached since February 2023, when Europe was adjusting to the loss of Russian pipeline gas.
Looking ahead, Kpler Insight maintains a bullish view on the TTF front-month contract for next week. Most indicators point to higher prices, mainly driven by the ongoing geopolitical situation in the Middle East. One of the strongest bullish factors will be the increased competition with Asian buyers for uncommitted Atlantic cargoes, which could weigh on European LNG imports next week. LNG on the water set to discharge in Europe next week remains slightly under weekly averages and could continue to decline. On the demand side, lower expected wind generation across Europe w/w could also put some pressure on gas-for-power demand, although this could be offset by higher forecasted solar generation next week. The factors that could soften the bullish pressure are the warmer-than-average expected temperatures set to hit mainly NWE and the CEE region, thus limiting gas for heating demand. Relatively ample pipeline supply is also set to continue.
On the supply side, EU net pipeline imports were stable w/w and reached an estimated 2.86 bcm (-1% w/w). This was mainly due to a slight drop in Norwegian flows, which was offset by robust volumes from all other suppliers. Looking ahead, Kpler Insight expects net pipeline imports to remain stable next week. While there has been some minor revision for Gassco maintenance, Norwegian flows should remain strong, while Azeri and Algerian flows are also set to remain robust.
Gassco fields and processing plants scheduled unavailability next 30 days (mcm/d)
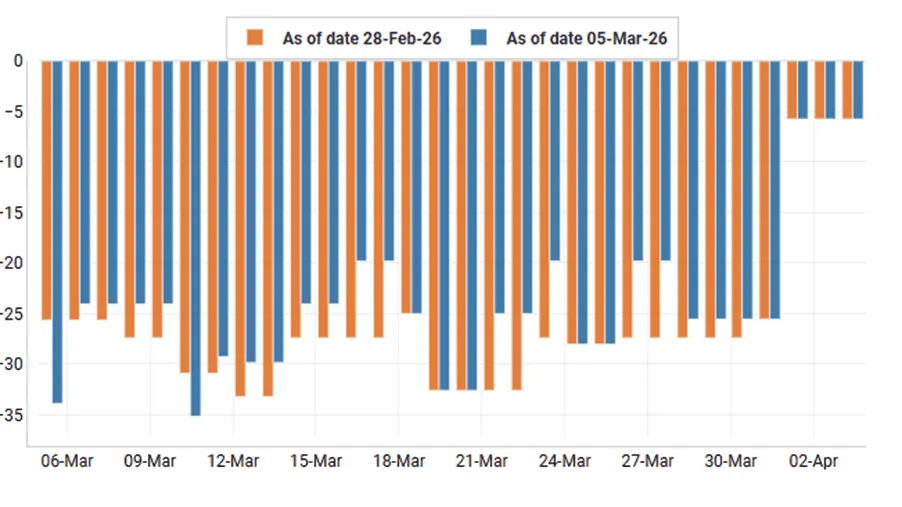
Source: GASSCO, Kpler Insight.
Polish and Romanian pipeline flows to Ukraine saw an uptick last week, averaging around 11 mcm/d and 3.8 mcm/d, respectively, with daily Romanian flows now almost on par with Slovakian volumes. Some of this Romanian pipeline supply is likely being sourced via LNG imported into Greece, which imported two full cargoes last week. This was on the back of full monthly capacity being booked for Route 1. Going forwards, flows to Ukraine are expected to remain robust, thus putting some pressure on the CEE region.
EU-27 LNG imports slightly fell to 3.3 mt (-15% w/w), as higher imports into Iberia and Turkey were offset by a drop in NWE volumes. However, this drop in NWE volumes did not reflect demand destruction in the region, but rather a return to the usual volume of weekly imports (~1 mt) after a record level reached the previous week (1.6 mt). The increase in Turkish volumes was likely driven by low wind generation in the country, which in turn increased gas-fired generation into the country.
Looking into next week, Kpler Insight expects LNG imports to slightly decrease. While there is enough LNG on the water from Qatar and the US currently heading to Europe to keep supply stable for the week ahead, diverted Atlantic cargoes remain a key risk to European supply. Indeed, three cargoes have already diverted (one from Nigeria and two from the US) amidst a US arb that has remained open to Asia for the past two days. While LNG supply for this week is set to reach ~3mt, this is likely to fall as more diversions occur, putting bullish pressure on TTF.
EU-27 weekly LNG imports by region (mt)
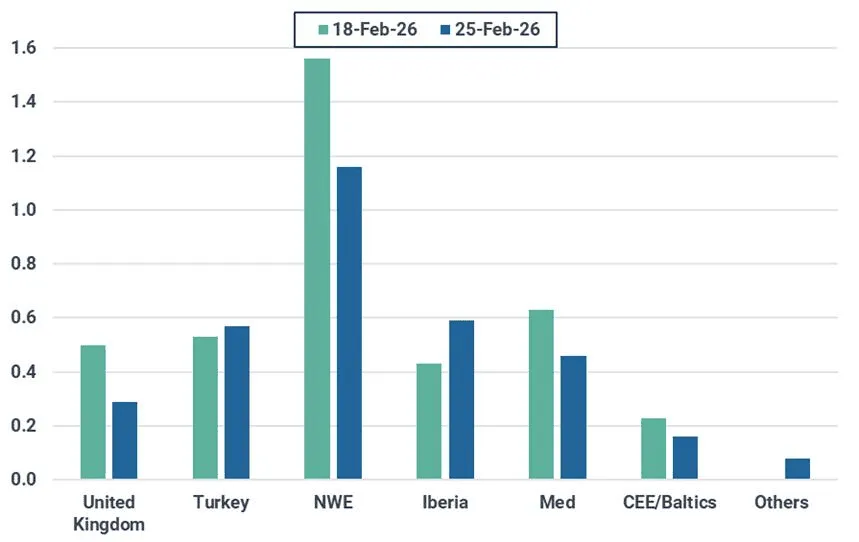
Source: Kpler Insight. Data represents week commencing 18/02 and 25/02. NWE=FR, BEL, NL, GER. Iberia=ESP, POR. Med=ITA, HVR, GRE. Baltics/CEE=FI, LT, POL. Others=SWE, MT.
Regarding Qatari LNG, 0.98 mt has already left the Hormuz Strait and is currently in transit towards Europe, with most vessels set to discharge within the next 4 weeks. However, if the Hormuz Strait remains blocked until then, European buyers will be forced to secure alternative supply in the meantime, thus fuelling additional bullishness to TTF prices.
On the demand side, aggregate local distribution demand across 16 EU countries strongly declined by 23.7% w/w to an estimated 3.5 bcm. This was mainly driven by warmer temperatures across NWE, southern Europe and the CEE region. For next week, Kpler Insight expects local distribution demand to slightly decline, as temperatures are forecasted to remain above the 5-yr average across NWE and the CEE region, thus limiting heating-related gas consumption.
EU-16 weekly consumption in the local distribution sector (bcm)
Source: ENTSOG, ENAGAS, Eustream, AGCM, Kpler Insight. The EU-16 perimeter includes AT, BE, DE, CZ, FR, HU, GR, IT, NL, LU, PL, PT, RO, SL, SK, and ES.
On the power side, EU-25 gas-fired generation continued to decline to an estimated 7.1 TWh (-10% w/w), mainly due to strong wind generation in NWE displacing gas in the power mix and warmer-than-average temperatures. Looking ahead, lower wind generation is forecasted across most of Europe, putting upside pressure on gas-for-power demand. However, favourable forecasts for solar generation across the bloc next week will help to somewhat offset this.
EU-25 weekly gas-fired generation (TWh)
Source: Kpler Power, Kpler Insight.
Average forecast temperatures for NWE, excluding the UK (°C)
Source: Kpler Insight. Run comparison 05/03 (solid) vs. 26/02 (dotted), 00:00 UTC. Seasonal is a five-year average. NWE includes BE, NL, FR, DE
EU-27 underground gas stocks declined to 29.8% full as of 03 March, down 1 percentage point w/w. Looking ahead, the warmer temperature forecasts should help to soften the pace of withdrawals next week. Furthermore, the TTF day-ahead/month-ahead spread has entered further into negative territory as of 04 March, trading at -1.6 €/MWh, thereby limiting incentives to accelerate withdrawals. However, the possibility of tightening LNG supply due to the risk of more cargo diversions away from Europe could put pressure to pull additional gas from storage.
NWE was in a more vulnerable situation storage-wise, with France reaching 22% full, Germany 21% and the Netherlands a mere 11%. This will likely put pressure on withdrawals in those countries, with the PEG and the THE likely to rise relative to the TTF. Southern Europe was more comfortable, with Spanish UGS 56% full and Italian UGS 47% full.
EU-27 daily UGS change (bcm)
Source: GIE, Kpler Insight. Latest data as of 03/03/26.
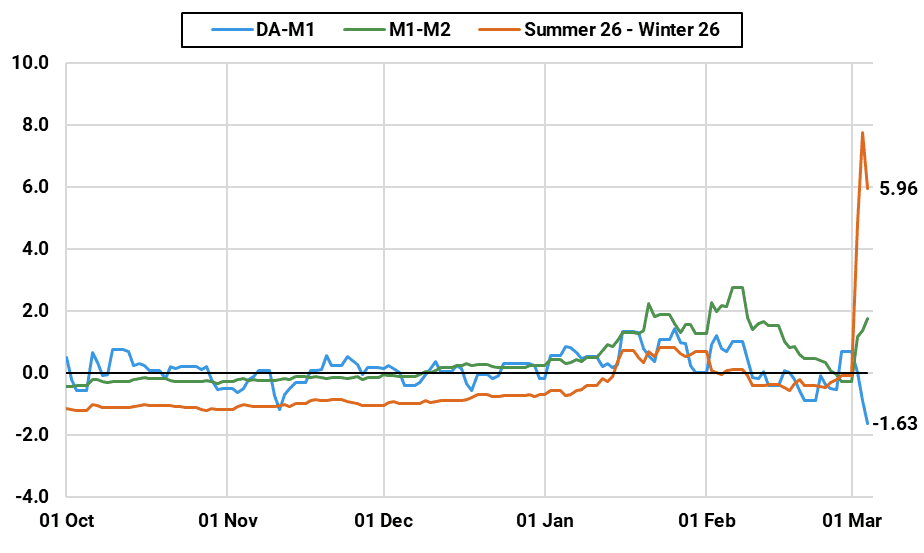
The summer/winter TTF spread has also surged since the beginning of the conflict and is now positive, reaching +6€/MWh on 03 March (even surpassing +7.8€/MWh the day before), as the magnitude of the summer price increase outweighed that of the winter one. If this trend persists, it will offer no incentive for gas injections. This is particularly important considering we are less than four weeks away from the start of the injection season in April. While the +7.8€/MWh spike is behind us, Kpler Insight expects the spread to remain positive as long as there is no additional clarity about the return of Qatari LNG supply to the market.
Selected TTF spreads (€/MWh)
Source: Argus, Kpler Insight. Latest datapoint 04/03/26.
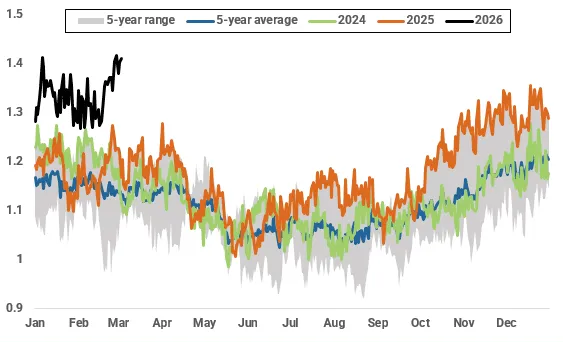
Asia: LNG prices to remain firmly bullish on Hormuz disruption risk
Asian LNG prices rose by $4.51/MMBtu week on week to $15.11/MMBtu on 4 March from $10.60/MMBtu, driven by the Strait of Hormuz geopolitical risk premium and looming supply disruption as 20% of the world’s LNG supply is currently shut-in. On Tuesday, Asian LNG prices closed at $15.77/MMBtu – the highest level since December 2023.
Asian LNG prices are likely to remain bullish in the week ahead, supported by Hormuz-driven supply risks. A LNG supply disruption removing up to 5.8 mt of Middle East LNG in March could significantly tighten balances and force Asia to compete for Atlantic Basin cargoes, with early signs of Atlantic cargo diversions—including US LNG—toward Asia as the inter-basin arbitrage widens.
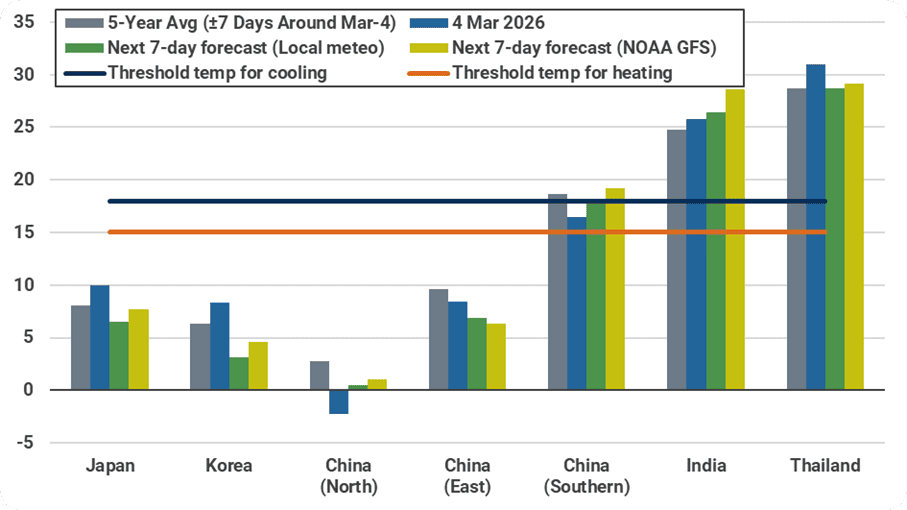
Into next week, temperatures across Korea, Northern and Eastern China are forecast to track below seasonal norms, slightly boosting heating-related gas demand. South Asia is expected to see above-normal temperatures and marginally higher cooling-related gas demand. Overall, the temperature profile points to modest weather-driven demand upside w/w, adding to the bullish price bias.
Forecasted average temperatures for Asian countries (°C)
Source: Meteostat, Kpler Insight. As of 5 March 2026 00:00:00 UTC. Population-weighted average temperature of selected major cities across a country is shown for both historical and forecast.
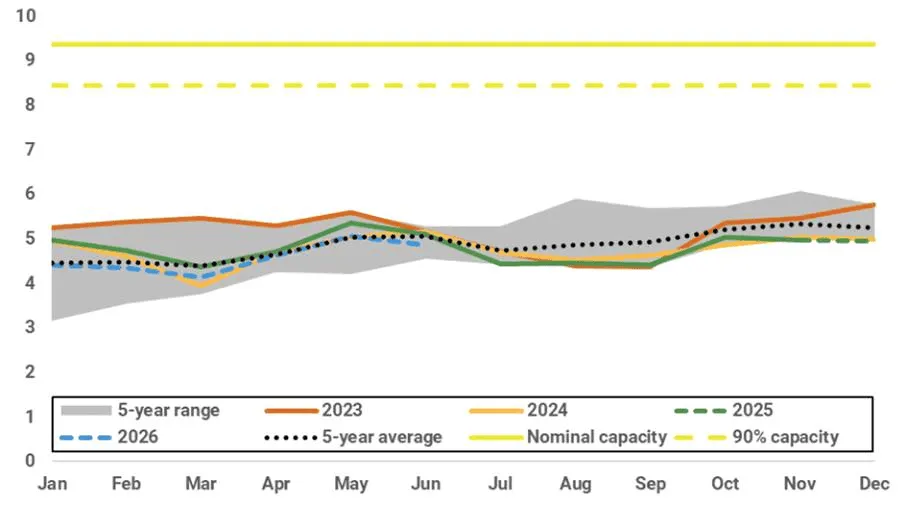
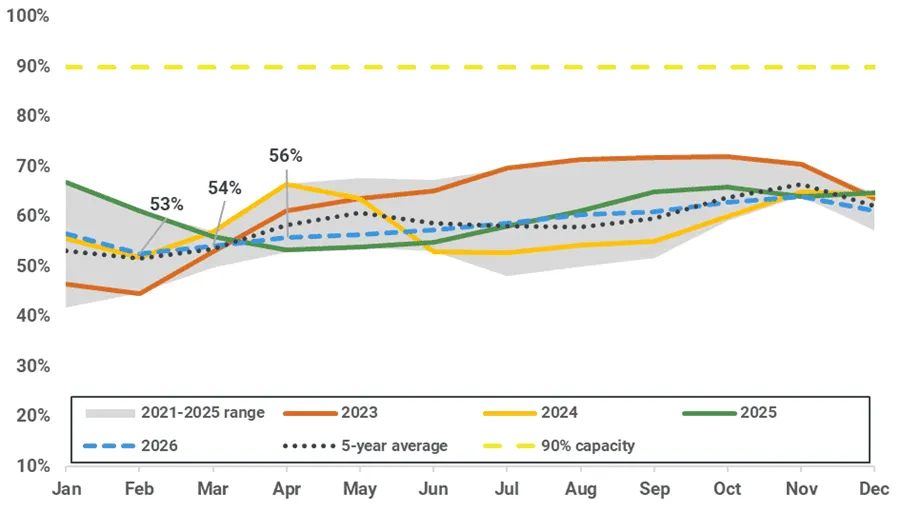
Japan’s major utility LNG inventories held steady week on week at 2.19 mt as of 1 March, with warmer weather limiting drawdowns and near-term power demand soft, but a 60% probability of hotter-than-normal summer temperatures and weaker solar output lifts our 2026 LNG demand forecast by 0.4 mt to 64.8 mt (~10 additional summer cargoes)—a supportive backdrop for Asian spot LNG into June–August that could tighten quickly if a prolonged Hormuz disruption coincides with stronger summer power demand despite Japan’s comfortable end February ~4.4 mt implied LNG inventories and relatively limited direct Hormuz exposure.
Japan implied total LNG inventory forecast (mt)
Source: METI, Kpler Insight
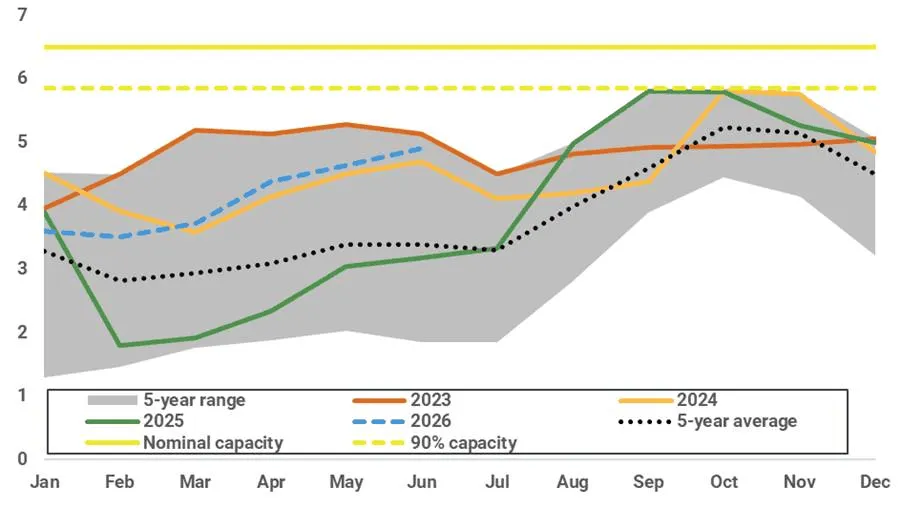
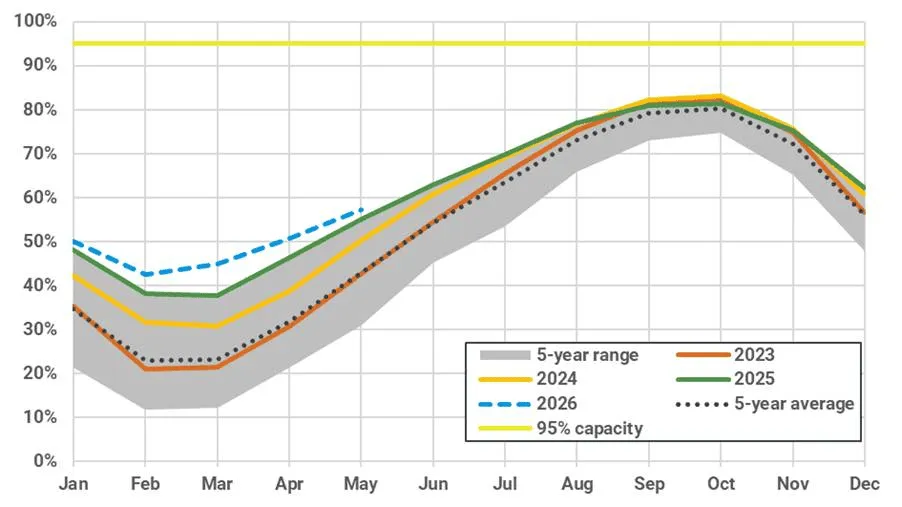
South Korea’s LNG inventories stood at 5.0 mt at end-December 2025, with only a 0.3 mt m/m draw as weak gas-for-power demand slowed withdrawals. Implied stocks are projected at 3.5 mt by end-February, 3.7 mt by end-March, and 4.1 mt by end-April—all above seasonal norms—while February LNG imports undershot expectations at 4.5 mt due to warmer weather. Kpler Insight cuts 2026 LNG demand by 0.7 mt to 46.3 mt, pointing to soft near-term fundamentals; however, with 14% of imports exposed to Qatar and the UAE, the Hormuz disruption is expected to keep bullish pressure on broader Asian LNG prices despite Korea’s comfortable LNG inventory levels and weaker spot appetite.
South Korea monthly implied LNG inventory (mt)
Source: Kpler Insight, KESIS
China’s implied LNG inventories declined to 7.6 mt (53% full) by end-February, broadly in line with seasonal norms, while underground gas storage is estimated to trough at ~17.3 bcm (43% full) before recovering to ~18.7 bcm (45%) by end-March. At current import rates of around 1 mt/week, LNG stocks provide roughly 7-8 weeks of cover against Hormuz-linked flows, with UGS offering an additional buffer. However, with around 30% of LNG imports sourced from Qatar and the UAE, the duration of any Strait of Hormuz disruption remains the key risk—prolonged disruption would gradually erode these buffers and shift the Asian LNG market decisively bullish despite China’s current storage cushion.
China implied LNG inventory forecast (%)
Source: Kpler Insight
China implied monthly UGS inventory forecast (% of total working capacity)
Source: Kpler Insight
South Asia is the most exposed region to any Strait of Hormuz disruption, with Qatar and the UAE supplying around 53% of India’s LNG imports in 2025, 72% of Bangladesh’s, and 99% of Pakistan’s. If disruption persists, the adjustment is likely to come through demand destruction rather than replacement buying, as Pakistan and Bangladesh are unlikely to purchase spot LNG at current prices while India becomes increasingly price sensitive. Industrial curtailment, fuel switching, and lower LNG consumption in India could partially offset lost volumes, effectively making South Asia the shock absorber of the Asian LNG market—tightening regional supply availability and reinforcing the bullish bias in Asian spot LNG prices.
Spot LNG vs. alternative fuel prices in India ($/MMBtu)
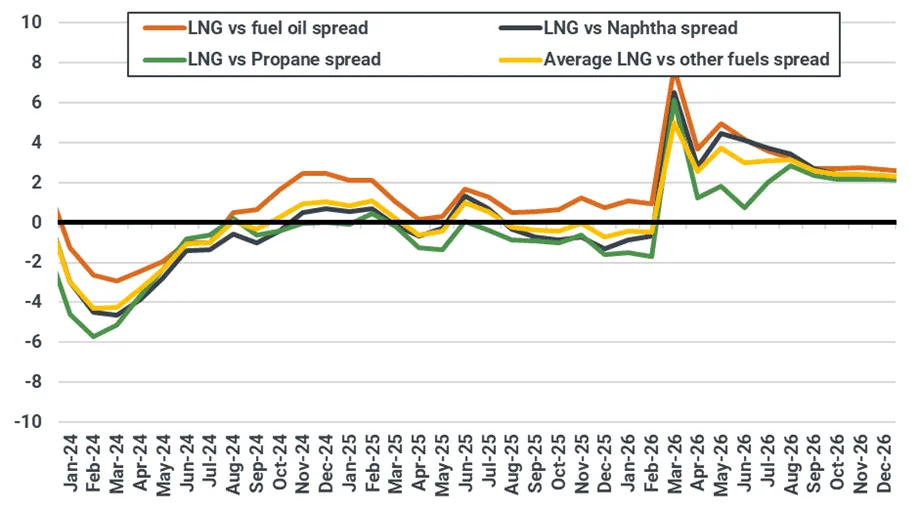
Source: Argus, Kpler Insight. Note: Forecast date starts from March 2026.
Buyers across Southeast Asia remain cautious as elevated prices and supply uncertainty delay procurement decisions. Several tenders remain unresolved—including Vietnam’s PV Gas April tender and recent Thai tenders—as buyers wait for clearer signals on Hormuz disruption risk and price direction. If prices remain elevated, spot demand is likely to stay muted, with procurement deferred until market volatility eases—reducing near-term buying interest but leaving Asian LNG prices supported by constrained supply and geopolitical risk premiums.
US: Henry Hub offers muted reaction to global market turmoil as domestic fundamentals continue to drive market
US Henry Hub front-month prices settled at $2.92/MMBtu on 4 March, down from $2.97/MMBtu on 25 February. Prices fell late last week as the imminent arrival of warm temperatures across the US put bearish pressure on futures, with Henry Hub settling at $2.86/MMBtu on Friday. Prices rose in early trading on Monday due to colder temperature model revisions and risk associated with the US-Israeli joint military strikes on Iran. While prices edged towards $3.20/MMBtu intra-day, bouts of profit taking activity ultimately led to the front-month settling at $2.96/MMBtu on 2 March. Henry Hub prices rallied slightly on Tuesday, settling at $3.05/MMBtu, on colder revisions to the EU weather model for mid-March, largely agnostic of geopolitics. Fundamentals continued to serve as the primary driver of price movement on Wednesday, as Henry Hub fell on bearish revisions to both the US and EU weather models.
US domestic gas consumption by sector (bcf/d)

Source: EIA
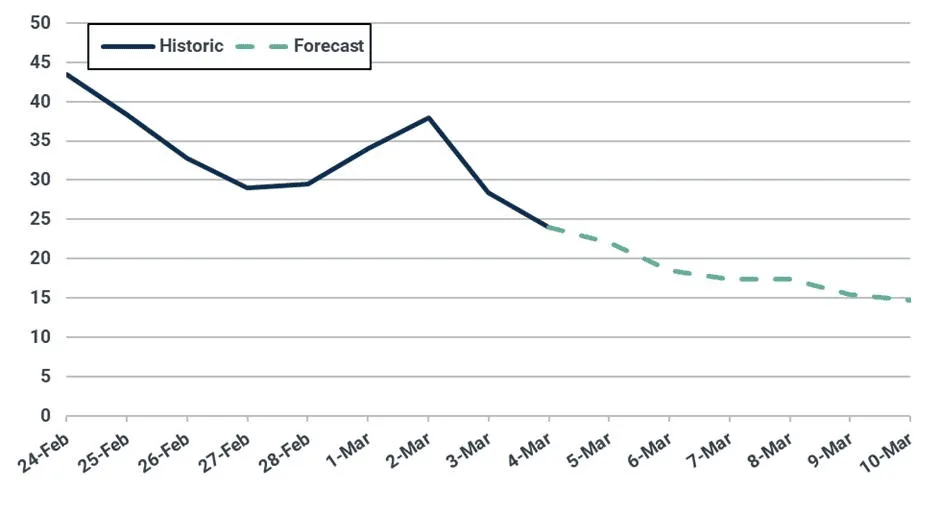
Residential and commercial heating demand rose over the week as a wave of cold impacted the Midwest, Mid-Atlantic, and Northeast, reaching a peak of 38 Bcf/d on 2 March. However, temperatures are set to warm nationwide over the next two weeks, with demand having already fallen to an estimated 25 Bcf/d on 4 March. Heating requirements are forecast to bottom out near 15 Bcf/d by 10 March before rising modestly in mid-March as a cold front passes over the northern US. Current projections suggest warmer temperatures will return in the latter third of the month. Kpler Insight expects Henry Hub prices to hold near $3.00/MMBtu over the coming week.
Forecast of residential and commercial demand (bcf/d)
Source: National Weather Service
Forecast of heating degree days
Source: National Weather Service
US dry gas production averaged 109 Bcf/d over the last week, remaining robust despite falling demand. Supply is expected to remain near current levels over the next week.
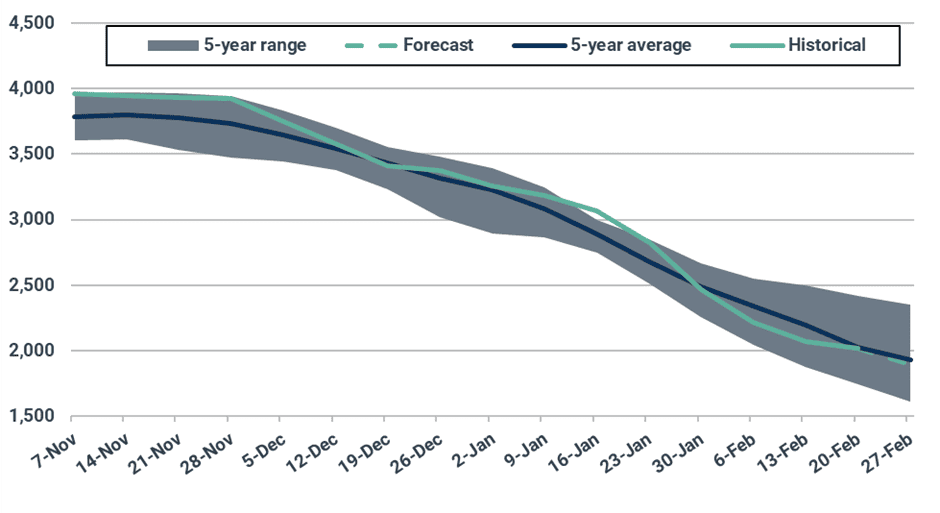
Forecast of natural gas volumes in underground storage (bcf)
Source: EIA
The US withdrew 52 Bcf from underground storage for the week ending 20 February, bringing inventories to a 0.3% deficit to the 5-year average, a sharp increase from the 5.6% deficit from the week prior. Another sizable withdrawal is expected for the week ending 27 February, with the deficit to the 5-year average to grow slightly. However, several very bearish storage pulls are likely for the subsequent weeks as national demand decreases and production holds steady. Kpler Insight projects a 126 Bcf withdrawal for the week ending 27 February.
Global LNG Supply: Strait of Hormuz closure to slash Middle East exports despite US at record highs
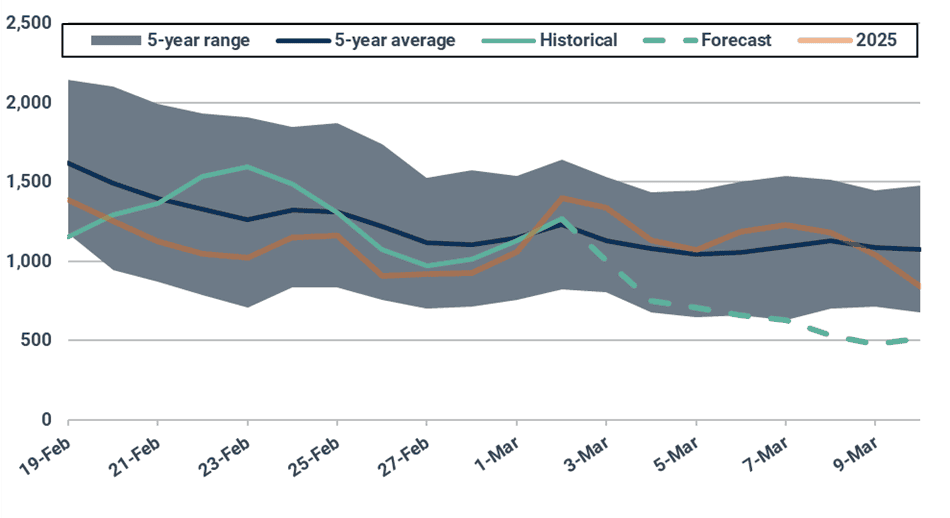
Global LNG exports edged lower by 0.12 mt w/w to 9.9 mt last week, marking the second-highest weekly export figure on record after the 10 mt milestone reached the previous week. The modest decline was largely driven by lower Qatari (-0.24 mt w/w) and Nigerian (-0.11 mt w/w) exports, while gains in the US (+0.35 mt w/w), Malaysia (+0.16 mt w/w), and Australia (+0.08 mt w/w) partially offset the drop.
Global LNG exports (mt, 10-day moving average)
Source: Kpler
However, the real impact of the escalating Israel-Iran conflict is expected to materialize in the coming week. Following Iranian drone attacks on 2 March, QatarEnergy declared force majeure on some long-term contracts after halting production at the 77 mtpa Ras Laffan complex. The Strait of Hormuz remains effectively closed, with no LNG tanker transits observed since 28 February. Kpler Insight estimates a potential supply loss of 1.4-1.6 mt from the Middle East next week alone.
In a typical week, Qatar loads around 20 vessels (1.7 mt). This week, a maximum of five vessels are expected to complete loadings, implying exports could fall toward just 0.4 mt next week, a reduction of roughly 75%. While two vessels remain berthed at Ras Laffan, all have been docked since 28 February with no observable draught changes, suggesting loading activity has stalled.
Qatar LNG exports (mt, 10-day moving average)
Source: Kpler
The disruption is highly significant given Qatar accounted for nearly 19% of global LNG exports in 2025 (80.97 mt), with approximately 90% delivered to Asia. On a volume basis, China and India are most exposed, but countries such as Pakistan and Bangladesh have a very heavy reliance on Qatari LNG with less diversified supply.
Elsewhere, US LNG exports surged to a new all-time weekly high, rising by 0.33 mt w/w, supported by consistently strong feedgas flows above 18 bcf/d across all terminals. Sabine Pass (+0.16 mt w/w), Cameron (+0.09 mt w/w) and Freeport (+0.08 mt w/w) were the main contributors.
However, volatility remains. On 2 March, Cameron LNG temporarily shut down during a flaring event, with feedgas flows dropping from 2.22 bcf/d to 0.63 bcf/d. Despite this, the 174,000 m³ Orion Spirit docked on 3 March and is already en route to Montoir and 174,000 m³ Hua Shan is as of 5th March docked at the terminal berth and loading, suggesting limited export disruption.
US LNG exports (mt, 10-day moving average)
Source: Kpler
Looking ahead, US exports are expected to remain robust and could partially offset Middle Eastern supply losses. Market participants anticipate Atlantic Basin volumes being redirected toward Asia amid tightening Pacific supply. Early signs of this shift are already emerging. The 200,000 m³ Clean Mistral, originally bound for Spain, has diverted toward Asia, while the 174,000 m³ Simsimah, which had been heading to Europe, has also changed course toward Asian markets, reflecting the growing pull from the Pacific Basin.
Nigerian exports eased from 0.46 mt to 0.35 mt w/w. Importantly, export destinations are already shifting. While last week’s cargoes were fully Europe-bound, this week’s first two loadings, 148,000 m³ LNG Ondo and 141,000 m³ LNG Adamawa, are heading to Asia, reflecting a potential rebalancing of flows toward the Pacific Basin as Hormuz remains shut. We have also observed the first cargo diversion from Europe, with the 162,500 m³ BW Brussels, originally bound for France, redirecting toward Asia.
Bonny LNG exports (mt, 10-day moving average)
Source: Kpler
Malaysia posted a strong rebound, with exports rising to 0.68 mt (+0.16 mt w/w), driven by higher output from the 29.3 mtpa Bintulu complex (+0.13 mt w/w) and PFLNG 2 (+0.04 mt w/w).
Malaysia LNG exports (mt, 10-day moving average)
Source: Kpler
Australian exports also rose modestly (+0.08 mt w/w), supported by continued loadings from the recently restarted Darwin plant. The 160,000 m³ Kool Husky loaded last week, marking another cargo from the facility. Australian supply is expected to remain firm in the near term.
Kpler continues to monitor Peru’s 4.5 mtpa LNG plant, where exports have ceased. The 174,000 m3 Gaslog Glasgow, bound for South Korea, was the last vessel to load at the plant on 25 February.
Market insights you can actually trust
Kpler delivers unbiased, expert-driven intelligence that helps you to track critical LNG market developments for your own analysis. Our precise forecasting empowers smarter trading and risk management decisions. In times of conflict and geopolitical uncertainty, our real-time data keeps you ahead of supply disruptions and price volatility.
Unbiased. Data-driven. Essential. Request access to Kpler today.

See why the most successful traders and shipping experts use Kpler