Independent performance benchmarks derived from vessel behaviour across terminals, not self-reported records.



8,700+
1,200+
6+
770+
Challenges
- You walk into SLA and port rotation negotiations with only your own operational records.
- The terminal disputes every berth time and dwell time figure you present.
Solutions
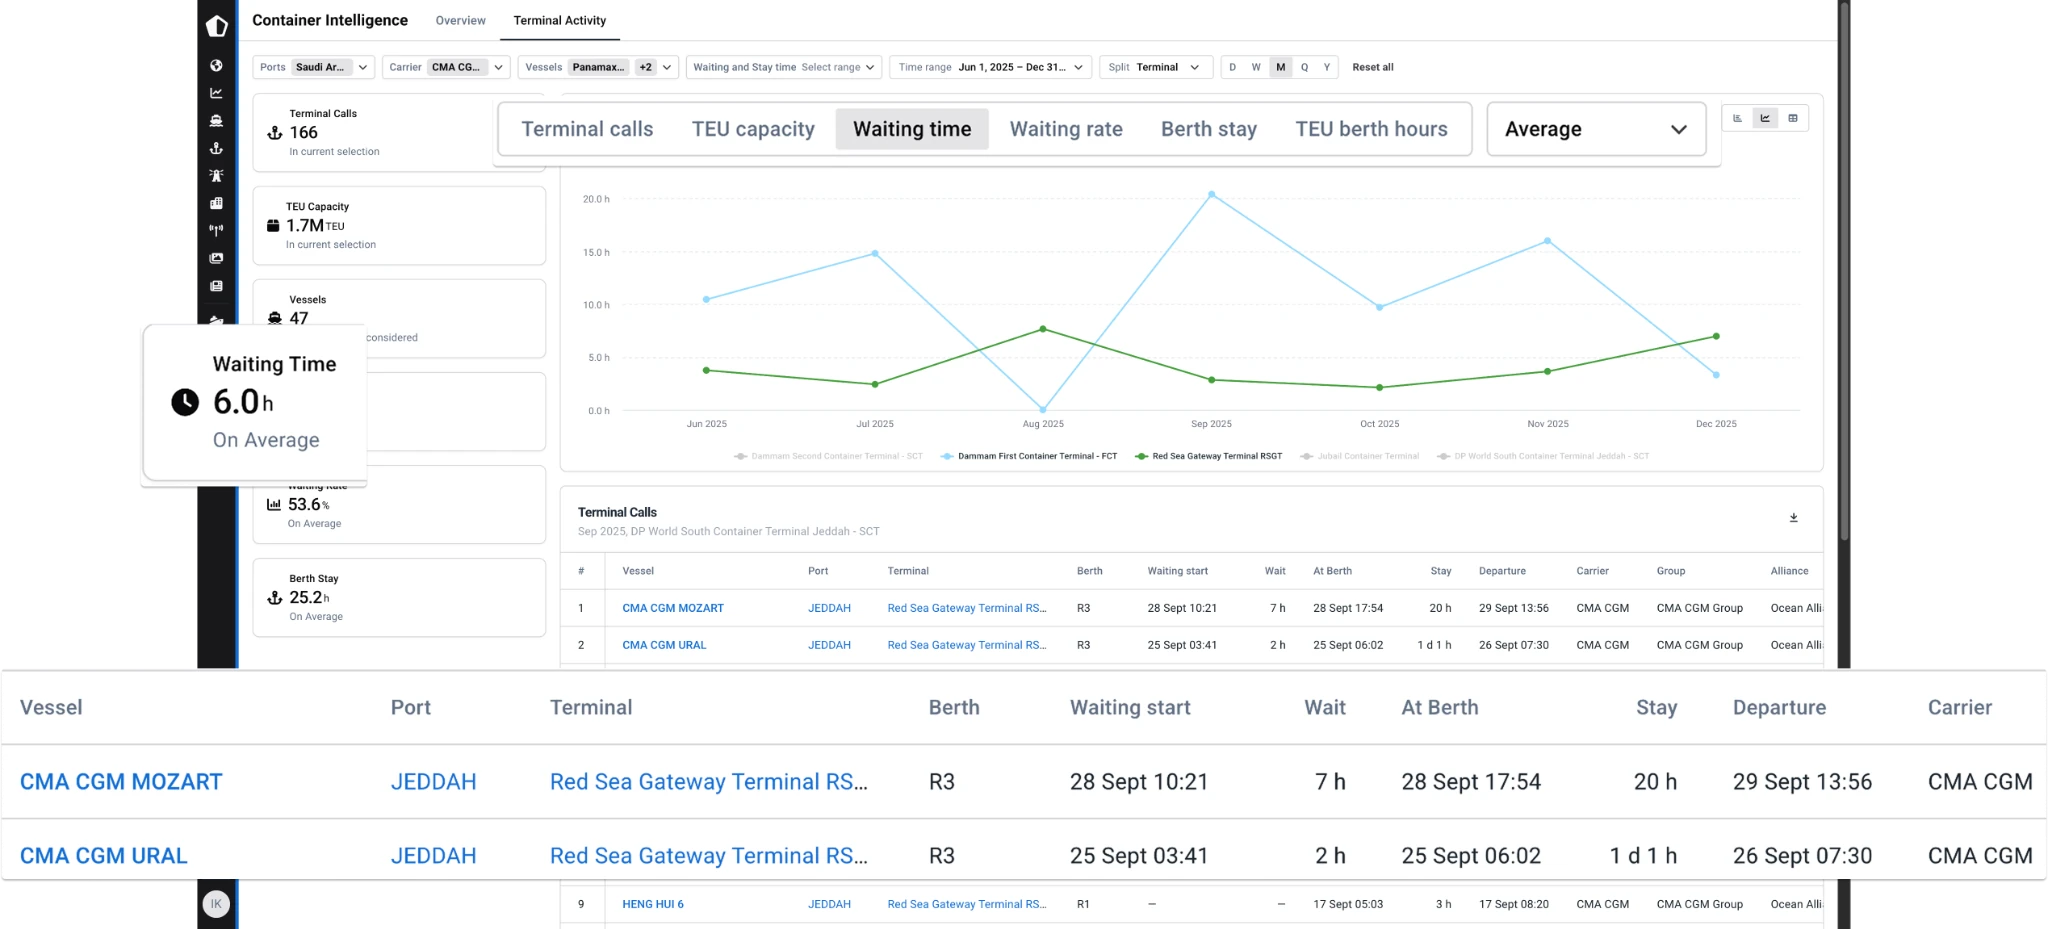
- Negotiate terminal SLAs and port rotations with independent benchmark data.
- Walk into berth window and rotation discussions with third-party waiting time figures your counterpart can verify.
Challenges
- Carriers challenge your pricing and capex investment case.
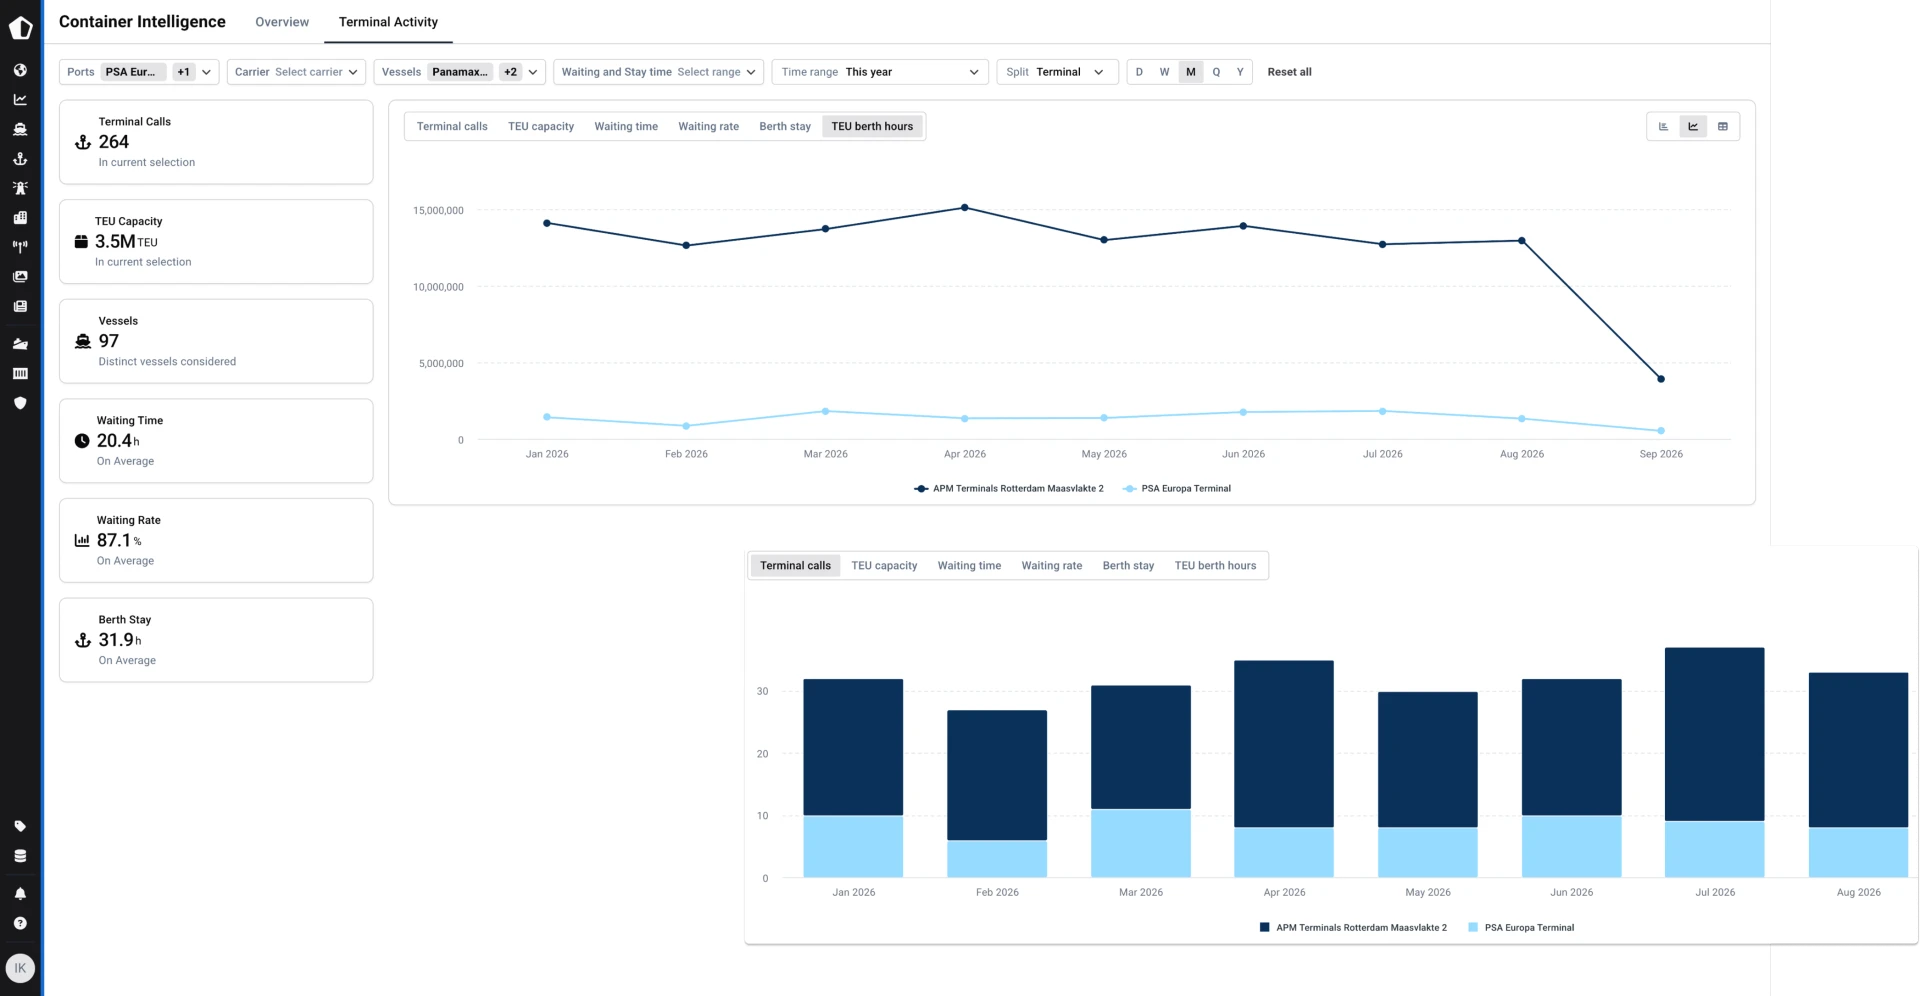
- You have no independent evidence of how your terminal's dwell time, anchorage time, and vessel turnaround compare to peer terminals regionally.
Solutions
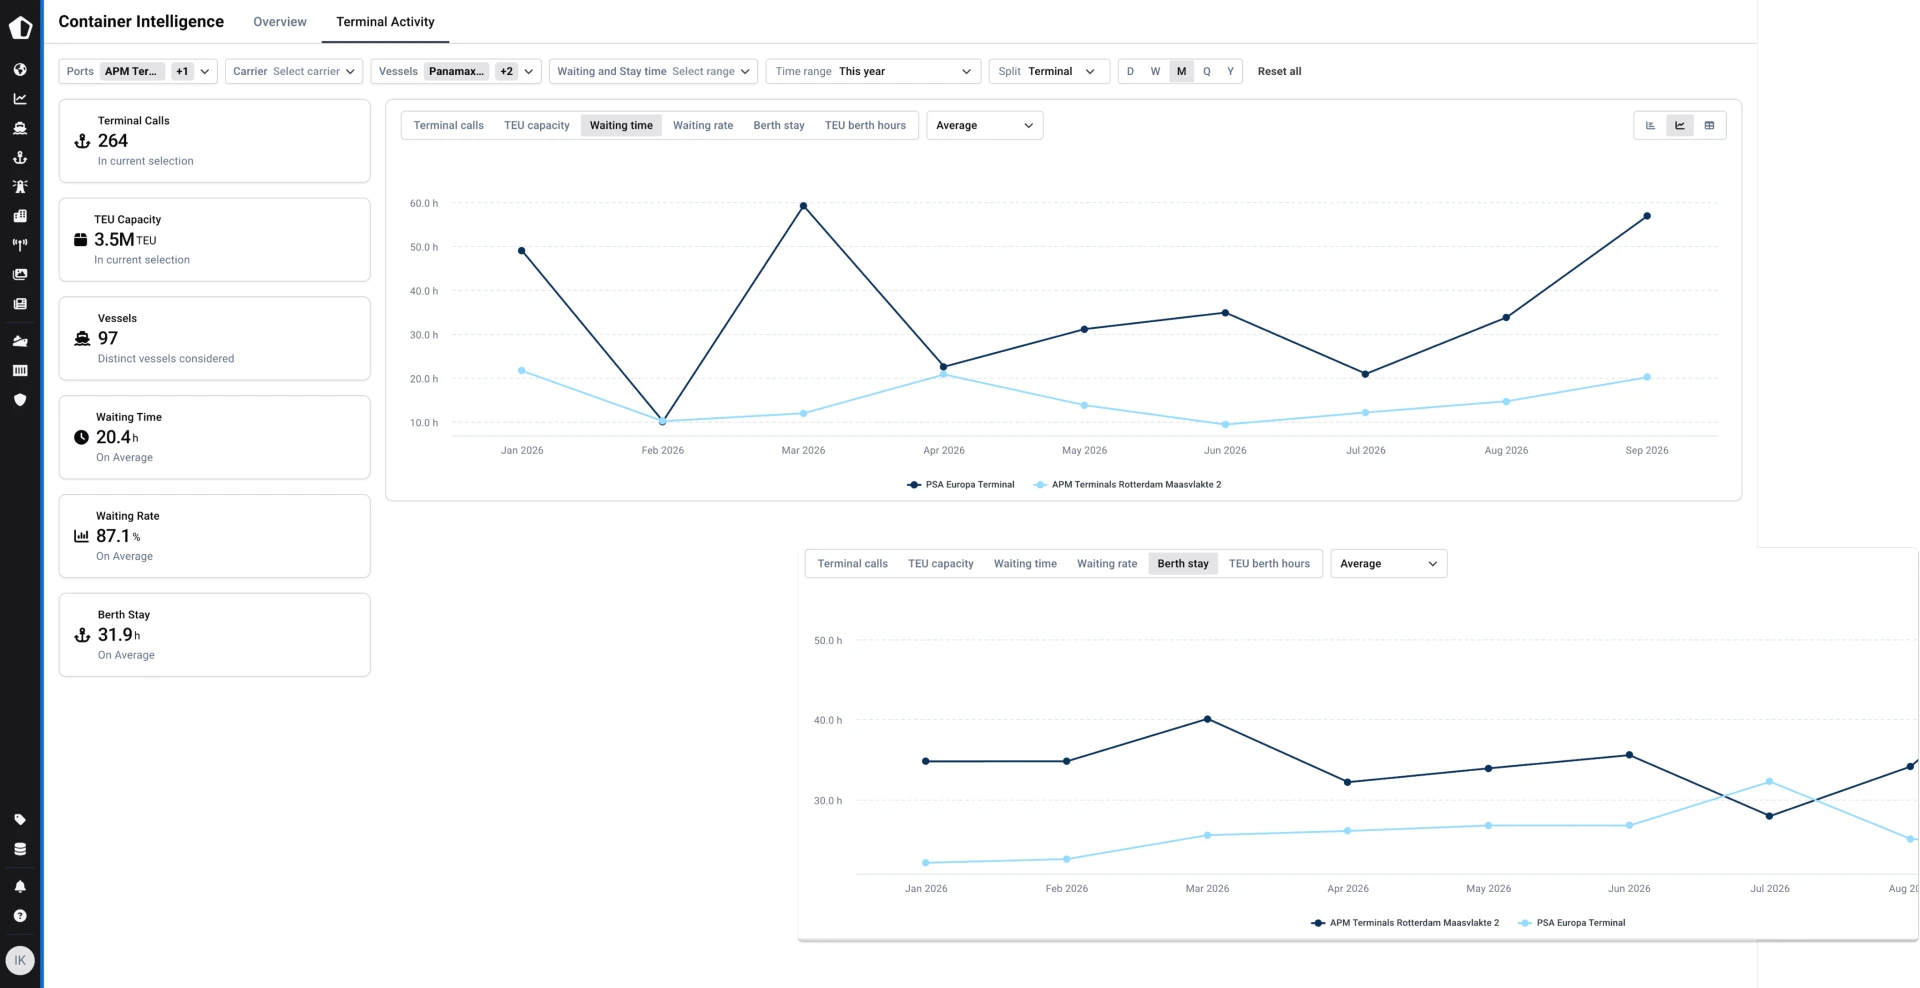
- Defend pricing and attract carrier volume with a neutral view of your competitive position against peer terminals by region and operator group.
- Underperformance becomes the strongest internal capex argument.
Challenges
- Capex proposals stall at board level without independent evidence that your terminal's throughput and turnaround times lag competing facilities.
- Internal performance data is compiled from your own operational records — the same records carriers and analysts will challenge the moment you present them.
Solutions
- Justify investment to the board with TEU×h load comparisons and waiting time trends versus competing terminals.
- Answer the question: "How do we compare to rivals?" with neutral data.
Challenges
- Carrier schedules obscure terminal-driven delay risk.
- Routing and carrier selection decisions carry hidden congestion exposure that only becomes visible after cargo is committed.
Solutions
- Factor terminal performance into carrier and routing decisions.
- Anticipate delays with port congestion data before cargo is committed
- Anticipate congestion-driven delays before they hit your inbound supply chain or trigger D&D charges.
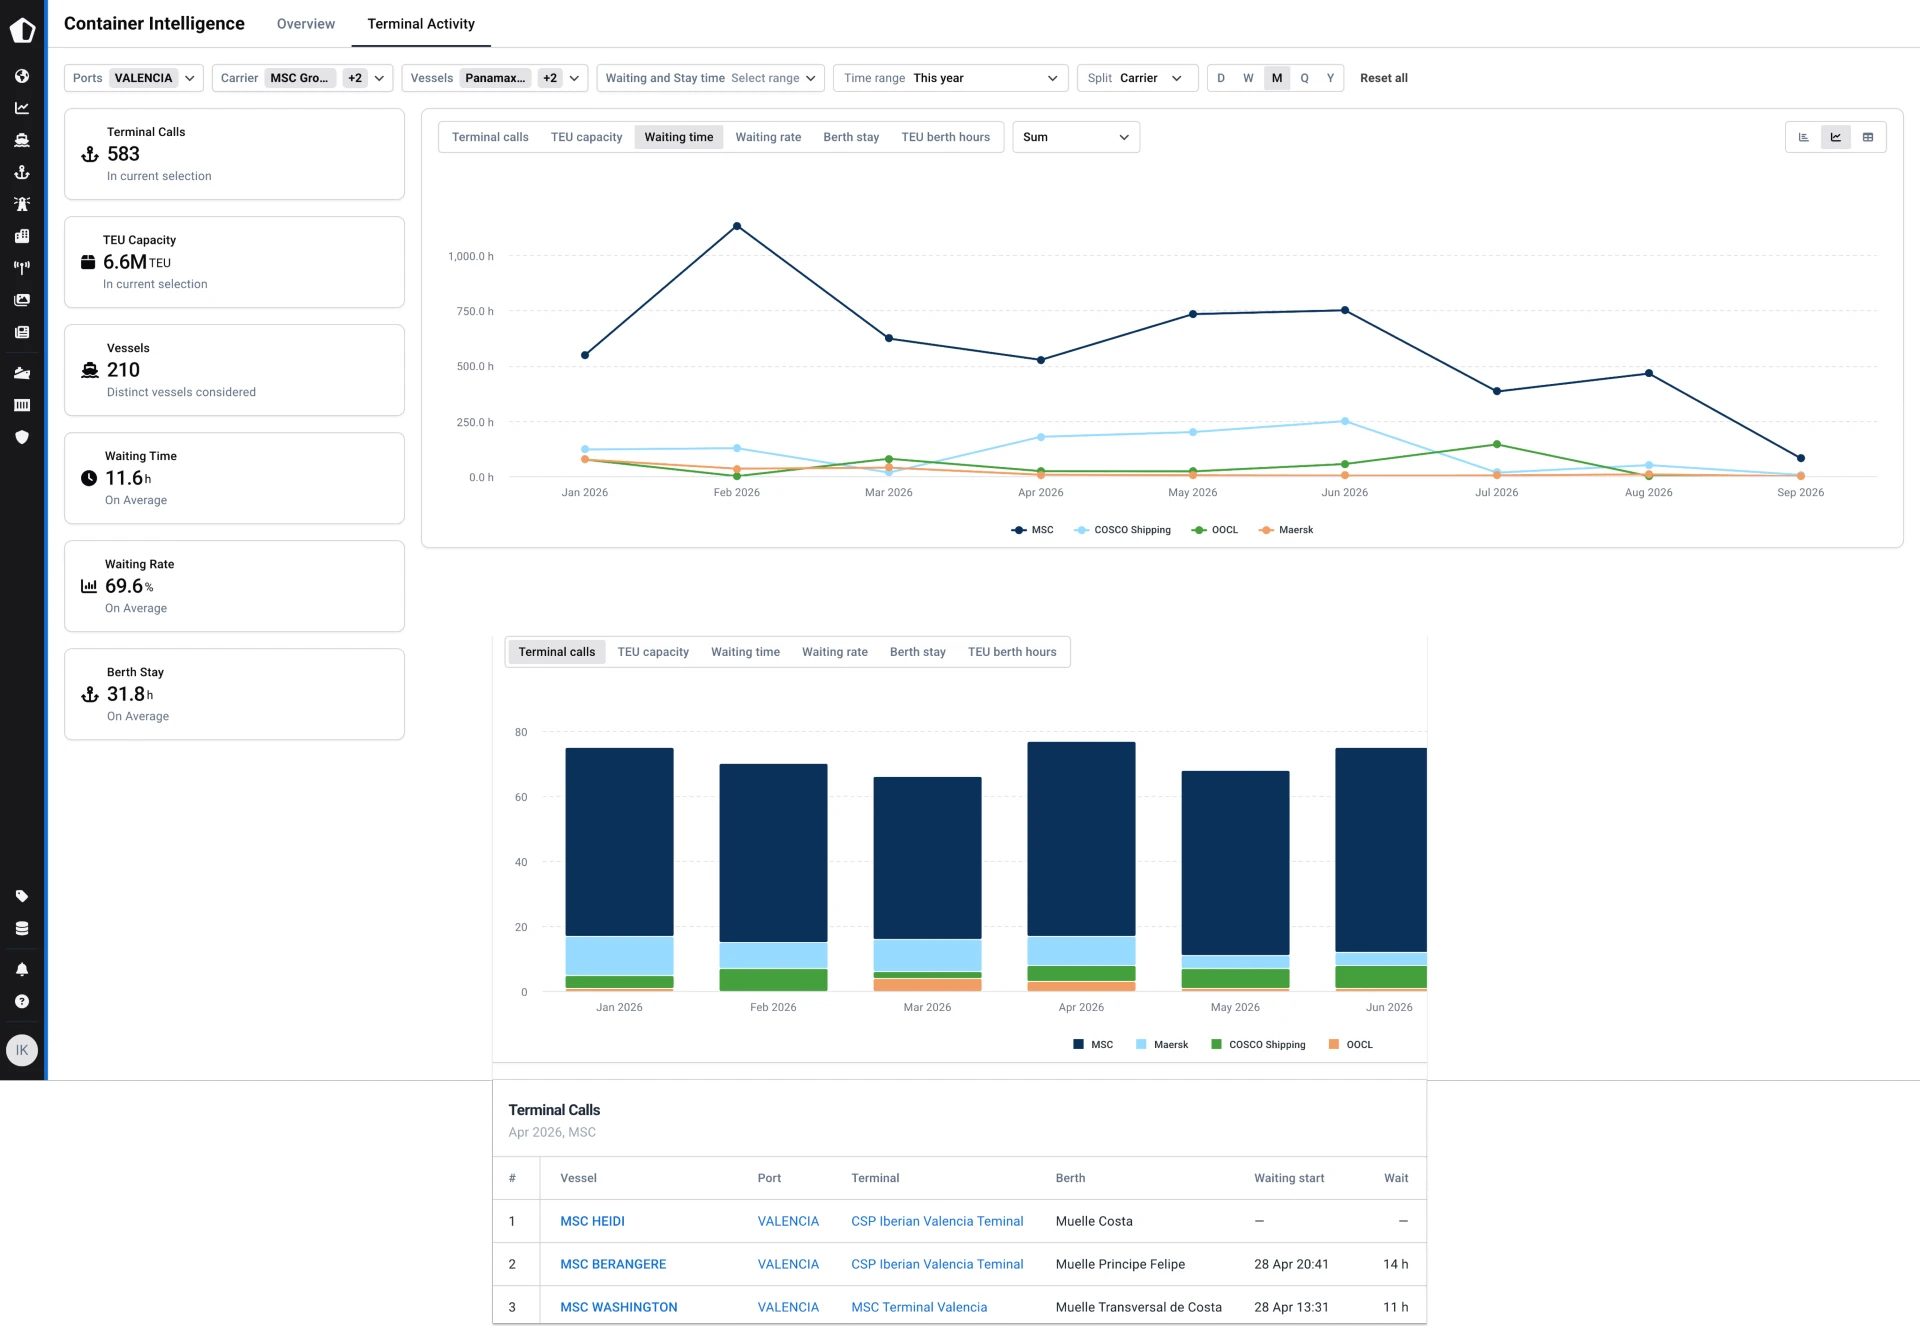
The full picture in one workspace, from sea to berth
Every terminal performance metric, live vessel call, and disruption signal in a single workspace, so procurement, operations, and commercial teams act on the same independent data.

“We had no real-time visibility on our container shipments. Now, we can proactively manage disruptions before they impact production.”
Alexandre Royer
Inbound Process Engineering, Renault Group

“Shipment insights are accurate and updated in just a few minutes.”
Keerthi Subawickrama
Import / Export Manager

“Initially, our goal was to track around 175,000 containers a year. Since then, customers have grown and we’re tracking upwards of around 1 million containers a year.”
Bob Broome
VP of eSolutions

“The accurate, real-time tracking of our shipments ensures that we can provide our customers with precise delivery estimates, which is crucial for their cash flow planning.”
Lizette du Plooy
Logistics Manager, Green Farms Nut Company
Explore our case studies for maritime markets
The latest news & insights
FAQ
Container terminal performance data measures how a vessel actually moved through a terminal, waiting time, berth time, and call volume, computed independently from AIS and port geometry rather than taken from a carrier’s or terminal’s own operational records. Because it’s derived the same way for every terminal and carrier worldwide, it gives both sides of a negotiation a figure neither one produced.
Container Intelligence’s global congestion map shows a live congestion index, vessels currently in queue, and average waiting and berth stay by terminal, refreshed continuously rather than published on a delay. That makes it possible to spot container terminal congestion building at a specific berth before it turns into a missed routing or carrier commitment.
Congestion shows up as extended pre-berth waiting time, extended berth stay, or both, and the causes (vessel bunching, equipment availability, labor, weather) vary by port and period. What stays consistent is the measurement, every terminal and carrier is scored against the same AIS-derived definitions of waiting time and berth time, so congestion at one terminal can be compared directly against another rather than assessed in isolation.
Container terminal benchmarking compares a terminal’s waiting time, berth stay, and call volume against regional peers and operator groups, split by vessel size class and carrier. Terminals use the gap to either defend pricing with evidence of outperforming peers or build a capex case around where they underperform, and carriers use the same comparison to support SLA and rotation negotiations.
Port-level figures average across every terminal at a gateway, which can hide a problem concentrated at one specific facility, or hide strong performance at one terminal behind a weaker port-wide number. Terminal-level data, split down to the individual berth, shows which specific terminal is driving a port’s overall congestion or reliability figure, rather than treating a multi-terminal port as a single data point.
Schedule reliability depends on both halves of a port call, how predictable it is to get into berth, and how long a vessel stays there once alongside. Tracking waiting time and berth stay together, rather than either one alone, surfaces delay risk before it’s committed to a routing or carrier decision, rather than after a shipment is already exposed to it.
Yes. Terminal Activity splits waiting time, waiting rate, and berth stay by carrier, carrier group, and alliance at the same terminal, so a BCO, forwarder, or carrier can see whether a congestion pattern is specific to one carrier’s calls or affects every carrier using that terminal equally.