Galveston didn't just get busier. Its port call pattern changed shape.
In late 2022, Galveston opened a third cruise terminal and welcomed its first Oasis-class ship, backed by a $125 million facility and a long-term Royal Caribbean commitment. But announcements only signal intent. They don't reveal how fast a market absorbs new capacity, whether rivals follow, or whether the boost outlasts one season.
That gap matters in cruise shipping, where schedules are published years ahead and ports celebrate deployments long before ships arrive. An itinerary shows what's planned. Passenger statistics later show what happened. Between them lies the real question of when Galveston's operations actually shifted.
Historical port activity answers that. Galveston didn't just get busier. It moved into a new operating range, with higher winter peaks, a broader mix of operators, and enough staying power to suggest a lasting gain in the US cruise network rather than just a temporary bump.
The problem with reading a seasonal market
Galveston has always been a seasonal cruise port. Winter schedules lift activity, summer patterns shift, and individual months can be distorted by holidays, repositioning voyages, weather and turnaround timing. A single busy month therefore tells little, and even a large year on year jump can mislead when the comparison period was unusually weak.
The pandemic complicates the baseline further. Cruising from Galveston was suspended for roughly fifteen months and resumed in July 2021. The port passed one million passengers again in 2022, but that milestone reflected recovery from an extraordinary interruption as much as organic growth. A chart starting in 2021 will naturally show a steep rise. The harder question is whether the market kept climbing once recovery had largely run its course.
That's where a multi year view matters. Recurring winter peaks establish the market's normal shape, and their height establishes its normal range. When later winters repeatedly exceed that range, the interpretation changes. The port isn't just following its seasonal cycle anymore. The cycle itself has shifted upward.
What port call data adds
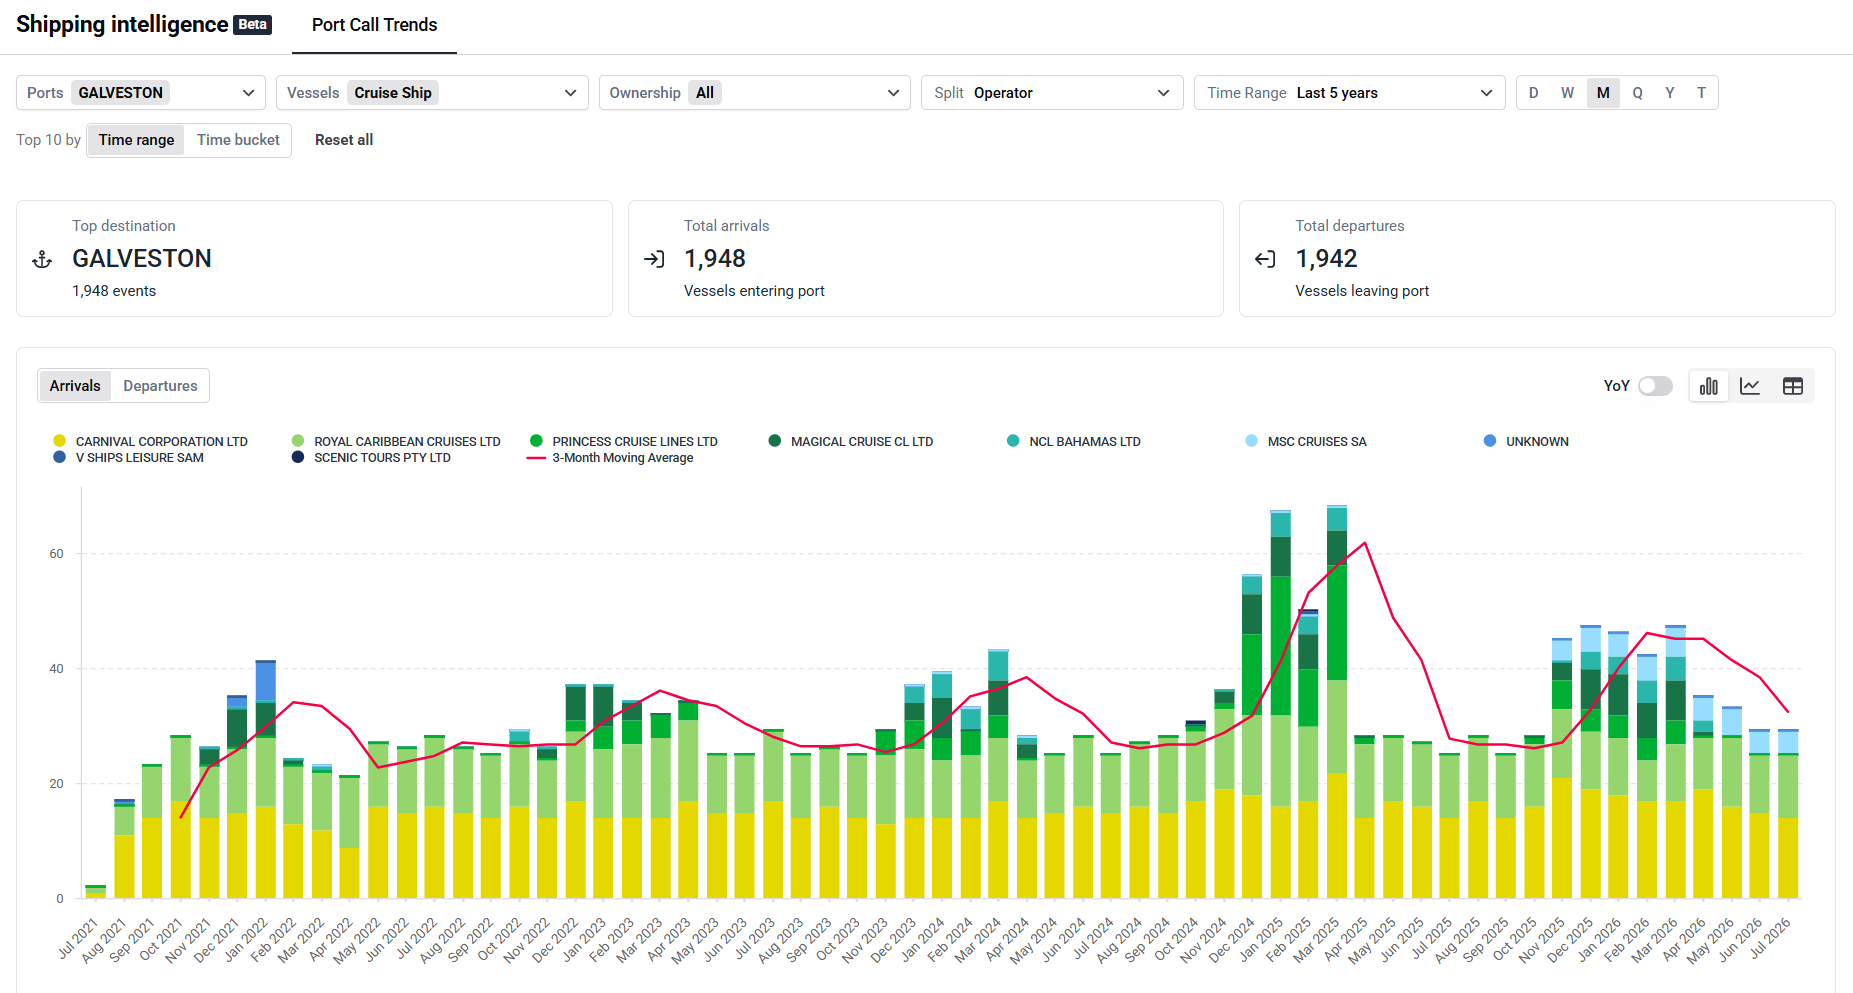
The Galveston series shows the same winter rhythm repeating, but later peaks rise into a visibly higher band. Earlier seasons generally stay below about 45 cruise ship arrivals in a month. In the 2024/25 winter season, the peak moves into the mid fifties and, in some months, close to the upper sixties. The following season stays elevated rather than dropping back to the earlier ceiling.
That's a more meaningful signal than a single record month. A temporary redeployment can create a spike, and a schedule change can shift calls across a month boundary. A sustained increase across comparable winter periods instead shows the port handling a denser programme. The seasonal pattern remains, but the level around it has changed.
Composition matters just as much. Carnival still accounts for a large share of Galveston's cruise business, but the later period shows greater weight from Royal Caribbean and a more visible contribution from other operators. The rise isn't simply the incumbent adding a few more sailings. It reflects a broader deepening of the market.
Annual passenger totals can't reveal this kind of change on their own. Passenger numbers show how many people passed through the terminals. A vessel trend shows when the operating pattern changed, how regularly the added capacity was used, and whether more than one cruise line participated in the expansion.
This comparison only works if the underlying vessel record is consistent from season to season. Kpler's maritime data environment combines MarineTraffic AIS coverage with historical port call events and vessel identity data, tying repeated arrivals back to the correct ships and operators. In a market like Galveston, that continuity matters more than the novelty of any single call. The analytical value comes from watching the same seasonal market repeatedly, then recognising when its level and composition begin to change.
Why schedules and announcements are not enough
Cruise schedules are indispensable but prospective. They tell ports, agents and travellers what's planned, not what actually happened, whether voyages were cancelled, how programmes changed mid season, or how one operator's activity compared with the rest of the market over several years.
Announcements have a similar limitation. The arrival of Allure of the Seas in 2022 was a major milestone, but one ship doesn't make a structural shift. Stronger evidence came later, when repeated calls from large Royal Caribbean vessels sat alongside continued Carnival activity and new commitments from other lines. The operating record turned a capital project story into a network story.
Traditional port statistics can obscure the transition too. Annual passenger totals are published after the fact and combine the effects of more sailings, larger ships and higher occupancies. A rise in passengers may reflect fuller vessels rather than more vessel activity, while call counts can rise even when passenger growth is modest. Both measures matter, but they describe different parts of the market.
A vessel based view is especially useful in the gap between a deployment announcement and a full year of official statistics. It shows whether the promised programme is actually appearing and whether the change is broadening beyond the original commitment.
A wider homeport strategy emerges
Galveston's subsequent decisions reinforce the interpretation. The port's 2019 master plan envisaged doubling its cruise terminals from two to four. After Terminal 10 opened, Galveston moved ahead with Terminal 16, a $156 million conversion of former cargo buildings designed to homeport MSC Cruises and Norwegian Cruise Line Holdings ships. The terminal opened in November 2025, with MSC Seascape beginning year round sailings.
That sequence matters because infrastructure often follows evidence of sustained demand, while new infrastructure can in turn enable further deployment. The port didn't stop after one successful terminal. It committed to another facility, another operator and another layer of year round capacity. By 2025, it was forecasting more than 400 sailings and almost 3.6 million passenger movements.
The vessel history helps place those investments in context. It shows the market climbing into a higher operating range before the fourth terminal opened. The new facility wasn't an attempt to build a cruise business from scratch. It was an expansion of a market whose vessel activity had already become denser and more diverse.
Growth is not the same as a record
Ports often describe growth through records: the busiest month, the millionth passenger, the largest ship, the highest annual total. Records are useful markers, but they can overstate how permanent a change is. A record may come from one exceptional programme or one unusually strong season.
Structural growth is more demanding. It requires comparable periods to operate at a higher level, the increase to persist, and the composition of traffic to support the same conclusion. Galveston meets that test more convincingly than a simple headline would suggest. Later winter peaks exceed the earlier range, the elevated pattern continues, and the operator base broadens.
That doesn't answer every question. Vessel calls don't show occupancy, ticket yields, onboard spending or terminal profitability, and larger ships can carry more passengers without increasing call frequency. The port's passenger statistics remain essential for understanding throughput, while company reporting and itinerary data add commercial context.
But the vessel record captures something those sources don't: the physical rhythm of the market. It shows how often cruise ships returned, when the seasonal ceiling moved, and whether the expansion was concentrated or shared.
The value of seeing port call trends as they happen
For port planners, timing matters. Berth demand, parking, road access, security staffing and terminal operations are shaped not just by annual totals but by how calls concentrate on specific days and seasons. Galveston's own public discussion of traffic management illustrates the point. Growth put pressure on Harborside Drive and led the port to invest in internal roads, parking design and other changes around its cruise terminals.
For cruise lines, the operator mix reveals competitive density. A port may be growing, but the commercial meaning differs depending on whether the increase comes from one dominant line or several companies building programmes at once. For service providers, the same pattern indicates whether demand is becoming regular enough to justify staffing, supply and partnership decisions.
For investors and advisers, the main benefit is chronology. Public announcements show when a terminal was approved or a ship assigned. Annual reports show what the year ultimately delivered. Port call trends show the transition between those milestones, the point where an announced deployment becomes repeated operating activity, and the point where repeated activity starts to look structural.
What Galveston's port call record ultimately shows
Galveston's cruise growth wasn't hidden. The new terminal, larger ships and passenger records were all public. What was harder to see was the shape of the change: how winter peaks moved beyond their earlier range, how the higher level persisted, and how the operator mix broadened as the port's homeport role deepened.
That's the real contribution of historical port call analysis. It doesn't replace passenger statistics, schedules or port reporting. It connects them, giving the market a time series against which announcements can be tested and annual totals interpreted.
In Galveston, the evidence points to more than a rebound and more than one successful terminal. The port moved into a higher, more diversified operating range, then backed that growth with a fourth terminal and additional year round programmes. The seasonal cycle remained, but the ceiling changed.
MarineTraffic Port Call Trends makes that change visible in the vessel record as a pattern built from repeated arrivals over time.
Sources and further reading
- Port of Galveston, “2023 Port Performance Exceeds Expectations,” 16 January 2024
- Port of Galveston, “Galveston Wharves 2024 Budget Forecasts Record Growth”
- Port of Galveston, “Port of Galveston Sets Record with 1.5-Millionth Cruise Passenger,” 9 December 2024
- Port of Galveston, “Galveston Port Moving Forward with Master Plan Update,” 7 February 2025
- Port of Galveston, “Galveston Port Managing Traffic as Cruise Business Grows,” 1 July 2024
- Royal Caribbean, “New Royal Caribbean Terminal Opens, Welcoming Largest Cruise Ship and the Best Family Vacations in Texas,” 9 November 2022
- Port of Galveston, “New Cruise Terminal on Track for November Opening,” 5 May 2025

See why the most successful traders and shipping experts use Kpler

Turn port call activity into actionable intelligence