What port call data reveals about Tarifa's new operator
In commercial shipping, a company's geography is rarely as simple as the map on its website. A ferry group may have offices in several countries, vessels registered through different legal entities and routes operated through subsidiaries acquired at different times. None of that shows where the business is most active today or whether its position is strengthening.
That distinction became unusually visible in the Strait of Gibraltar during 2025. For years, the high frequency link between Tarifa in southern Spain and Tangier Ville in Morocco was associated with FRS Iberia/Maroc. DFDS agreed to acquire the business in 2023, bringing three Strait routes into its network. Yet by May 2025, DFDS had withdrawn from Tarifa Tangier Ville and directed customers toward its Algeciras services. Baleària began operating the Tarifa route on 8 May, initially with four daily departures from each side, before adding a second fast ferry and increasing frequency as summer developed.
To a reader following press releases, the sequence looks straightforward: an acquisition, a concession decision, a change of operator. To someone assessing competitive presence, account potential or regional exposure, it raises a harder question. Did the route simply change branding, or did the pattern of commercial activity change with it?
The answer sits in the vessel record. A time series of ferry calls at Tarifa shows the route's return after the pandemic era interruption, the seasonal intensity of the market, the period when DFDS linked activity dominated, and the point when Baleària's vessels established a new operating rhythm. Seen this way, the route isn't just a line on a network map. It's a measurable commercial footprint that can expand, contract and transfer between operators.
A strategic announcement is not yet an operating footprint
Shipping companies communicate through intentions. They announce acquisitions, concessions, newbuild programmes and route launches because those events matter to customers and investors. But an announcement is a statement about what a company plans to do. It doesn't show how quickly the plan becomes visible in day to day deployment, how many vessels are committed, whether frequency is sustained, or how the move changes the company's wider regional balance.
DFDS's acquisition of FRS Iberia/Maroc illustrates the point. The transaction expanded DFDS into what it described as one of Europe's significant ferry markets and added routes across the Strait of Gibraltar. That was strategically important, but it didn't make every route equally central to the acquired business. When DFDS later stopped operating Tarifa Tangier Ville, the change wasn't obvious from the acquisition headline alone. It became clear through the route level operating pattern.
Baleària's entry created the opposite challenge. The company had already built a substantial Spain Morocco presence, but Tarifa was new to its network. Its January 2025 announcement set out a 15 year concession and a longer term plan for two zero emission electric fast ferries, expected to enter service in 2027. The strategic ambition was clear months before the operating footprint existed.
The first commercially meaningful evidence came later. Baleària confirmed that Avemar Dos would start the route on 8 May 2025. Within weeks, Jaume I was added, taking the offer from four to six departures per day from each country and creating capacity to reach eight to twelve daily sailings as demand increased. The progression from one vessel to two, and from launch frequency to a fuller summer schedule, is the point at which corporate intent became repeated maritime activity.
Why company research misses the shape of port call data
A fleet database can identify the vessels associated with an operator. A corporate website can show the routes a company markets. Port schedules can tell a traveller which departures are available today. Annual reports can show passengers carried across an entire international business. Each source is useful, but each compresses the geography differently.
Fleet lists are static, showing capability and control rather than the intensity of deployment at individual ports. Route maps are curated snapshots that rarely explain whether a service is year round, seasonal, newly established or in decline. Timetables are operationally precise but forward looking, showing the planned schedule rather than the accumulated history of what actually called. Annual traffic figures arrive later and tend to aggregate several countries and routes into a single result.
Baleària reported that international passenger traffic grew by 68% in 2025, reaching close to two million passengers, and identified Morocco as its main international market. The company also said that opening Tarifa Tangier Ville contributed to that expansion. The figure establishes the strategic importance of the move, but it doesn't isolate Tarifa from Baleària's other Moroccan routes or reveal how quickly the new service built frequency.
The port call record occupies the space between these sources. It's granular enough to show the route and the vessels, but historical enough to show whether activity persisted. It can reveal the difference between a ceremonial first call and a genuine operating presence, or between a company that appears in a country once and one that has embedded itself in the local transport system.
The Tarifa pattern: recovery, concentration and transfer
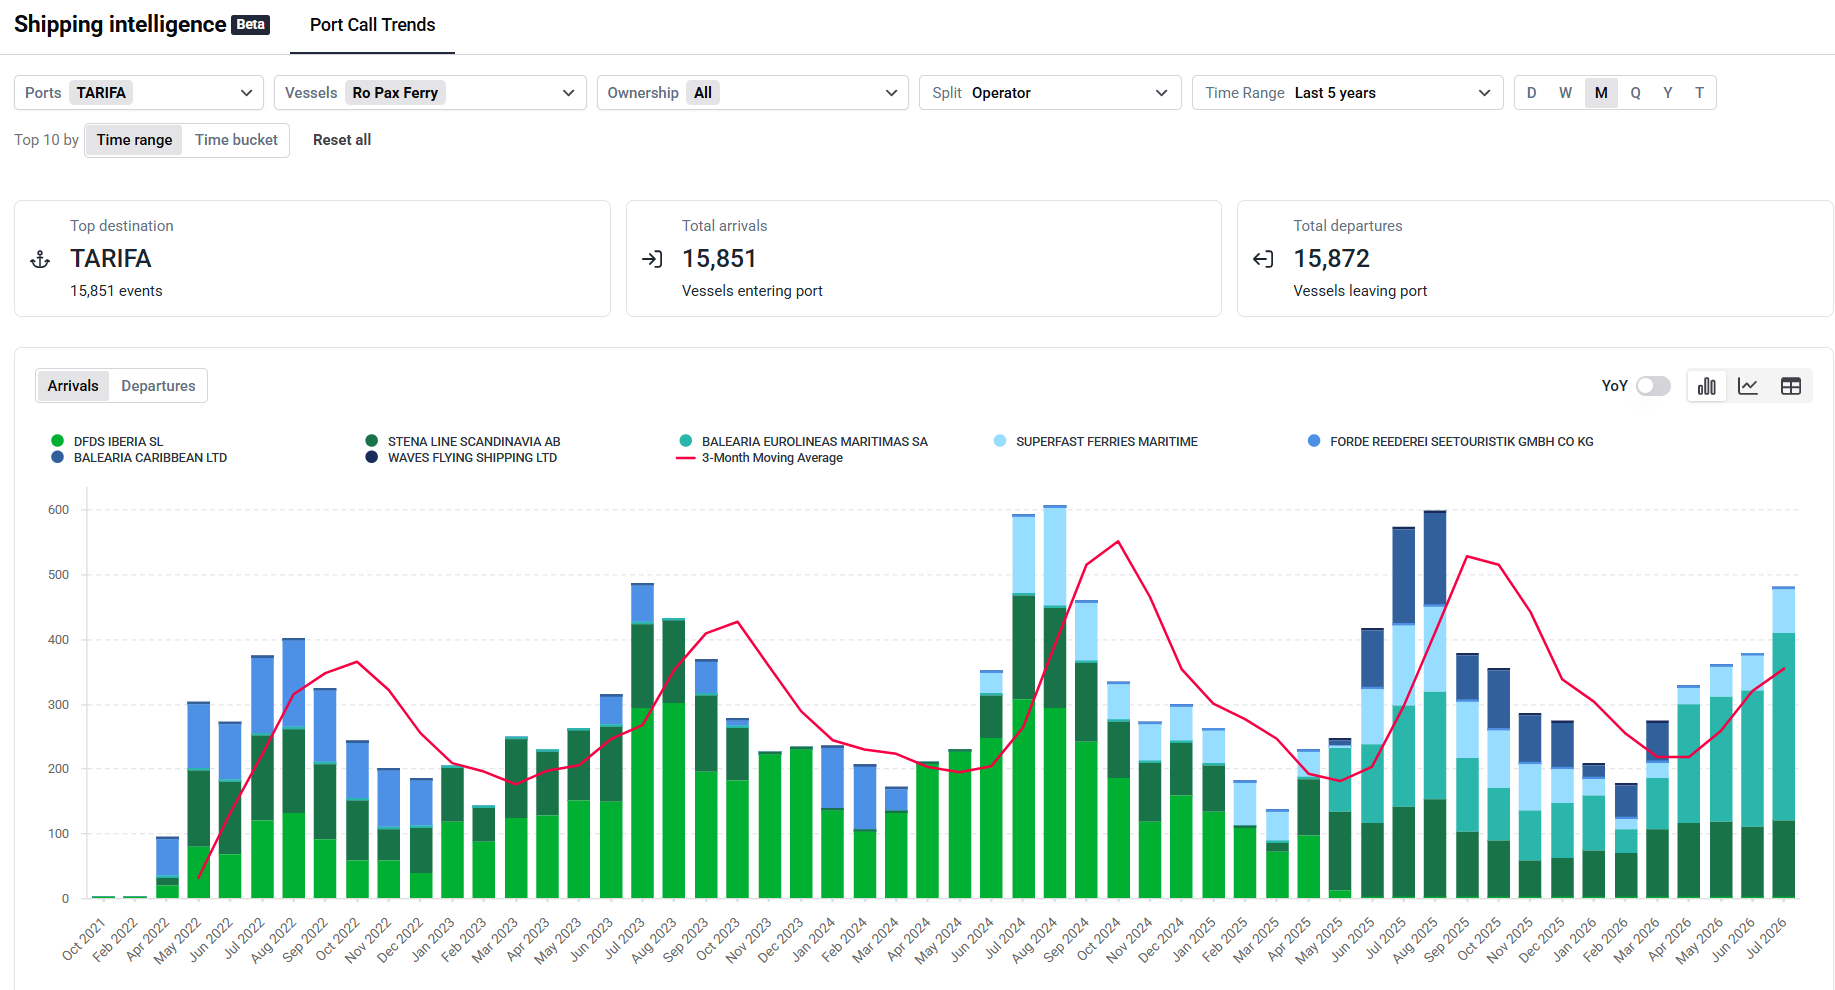
Tarifa is especially useful because the market has a pronounced rhythm. Ferry activity is high frequency and strongly seasonal, with summer peaks reaching several hundred arrivals in a month. That makes the route commercially significant, but it also makes isolated observations hard to interpret. A single vessel sighting says little about who controls the market over a season.
The longer view tells three stories:
- Recovery: recurring RoPax and fast ferry activity returned in 2022 and quickly re-established a clear summer pattern.
- Concentration: through 2022, 2023 and 2024, most visible activity was associated with the FRS/DFDS business.
- Transfer: from May 2025, Baleària linked calls rose rapidly and became the defining operator signal at the port.
This matters because a total traffic line would show only that the market was active, not that commercial control had changed. The route could maintain a similar level of ferry calls while presenting a very different account landscape to a port supplier, a travel distributor, a maintenance provider or a competing operator.
The distinction between total activity and company activity is central to geographic footprint analysis. A port can stay busy while one operator leaves and another enters. From the port's perspective, headline throughput may look stable. From a commercial perspective, the identity of the customer, decision maker and fleet has changed completely.
A company footprint is a pattern of repeated decisions
The phrase "geographic footprint" is often used loosely to mean the places where a company has ever operated. That definition is too broad to be useful. A more meaningful footprint is the pattern created by repeated deployment decisions: which countries and ports receive regular calls, how those calls are distributed across the year, which markets are gaining weight and which are becoming peripheral.
For Baleària, Tarifa didn't appear as an isolated experiment. It joined an established Morocco network that already included links from Algeciras, Motril, Almería and other Spanish gateways. The company's 2024 reporting described Morocco as representing 18% of customers and 22% of its international traffic base. By 2025, Morocco had become the group's principal international market, while Tarifa provided a new high frequency connection directly into Tangier city.
That broader context changes the interpretation of the port calls. The vessels at Tarifa weren't evidence of a company testing an unfamiliar geography from scratch. They were evidence of an operator deepening an existing regional position and adding a route with a distinct passenger proposition. The planned electric ferries, port electrification and 15 year concession reinforce the expectation that this is meant as a durable part of the network rather than a short seasonal charter.
The same logic applies to any commercial operator. A cluster of calls in a new country may indicate expansion, but its significance depends on whether the company already has adjacent routes, local infrastructure or other vessels in the region. A decline at one port may represent withdrawal, or it may show substitution toward a nearby gateway. The footprint becomes meaningful when the local movement is read as part of a wider deployment pattern.
Attribution without turning port call data into an ownership exercise
Shipping data attaches several companies to the same vessel. The legal owner, beneficial owner, technical manager and commercial operator may all be different. For a geographic footprint, the useful relationship is the one that best reflects deployment decisions.
The Tarifa case makes this practical rather than theoretical. DFDS acquired FRS Iberia/Maroc, but route activity during the integration period could still appear under entities inherited from the acquired business. Baleària, meanwhile, could deploy vessels held through individual owning companies while the commercial service is clearly presented to the market under the Baleària brand. A footprint built only from registered ownership risks fragmenting what customers experience as one operator network.
Kpler and MarineTraffic maintain multiple layers of vessel and company information precisely because maritime corporate structures can't be reduced to one name. The commercial operator or commercial manager is often the most relevant lens when the question concerns where a company is deploying tonnage and building market presence. Ownership remains important, but it answers a different question.
The objective isn't to produce an ownership chart. It's to attribute activity to the company whose commercial decisions are shaping the route. That attribution makes it possible to follow the footprint consistently across ports, even when the vessels, legal entities or management arrangements change.
What port call data adds to the Tarifa story
By the time Baleària began selling tickets, much of the strategic story was already public. The tender had been awarded. The 15-year horizon was known. The electric-ferry project had been announced. What remained uncertain was how the transition would play out in practice.
Observed calls supplied that missing layer. They showed when DFDS-linked activity ceased, when Baleària's vessels began appearing and whether the new pattern was sustained beyond the first week. They also allowed the route to be viewed against earlier seasons, making it possible to distinguish normal summer acceleration from the effect of a new operator increasing frequency.
This is the broader value of a historical operator view. Corporate announcements fix attention on milestone dates, but commercial markets usually change through accumulation. One vessel arrives, then returns. A second vessel joins. Frequency rises. The new operator begins to occupy a larger share of the port's activity. By the time annual statistics confirm the shift, the operating record has already documented how it happened.
For commercial teams, that sequence can matter more than the headline. A supplier deciding when to approach a new operator does not only need to know that a concession was won. It needs to know whether vessels are now calling often enough to support a service proposition. A port studying competitive behaviour needs to know whether a company has merely announced a market entry or has established a recurring presence. A consultant assessing regional strategy needs evidence of deployment, not just corporate language.
Reading expansion and withdrawal without overclaiming
Port calls show presence and frequency. They don't, on their own, establish profitability, passenger load factors or market share. Baleària's rising activity at Tarifa demonstrates that the company established and expanded a service. It doesn't reveal how full each sailing was or what financial return the route generated. DFDS's departure from Tarifa shows a change in route participation, not the performance of its wider Gibraltar business, which continued through Algeciras Tangier Med and Algeciras Ceuta.
This is why geographic footprint analysis is most useful when it stays close to the observed movement. It can say that a company's calls became more frequent, that a new port entered its recurring network, or that activity moved from one operator to another. The commercial explanation can then be developed using tenders, schedules, company reporting, port statistics and local market context.
Tarifa offers an unusually clean example because the external events are well documented. The operator change has a clear date. Baleària's initial and expanded frequencies were announced. DFDS publicly confirmed its withdrawal. The subsequent rise in Baleària linked vessel activity is therefore not an unexplained correlation. It's the maritime expression of a known commercial transfer.
From one route to a wider view of competitive geography
The same operator-linked history can be extended beyond Tarifa. Looking across Baleària's calls in Spain, Morocco and Algeria would show whether 2025 represented a single-route addition or a broader international acceleration. The company's own reporting suggests the latter: international passenger traffic grew sharply, Morocco became its leading international market and new Algerian routes also contributed to expansion.
A country-level footprint would show the changing balance between domestic and international activity. A port-level view would reveal which gateways were responsible. The time dimension would show whether growth was spread evenly across the year or concentrated around summer demand. None of this requires the article to assume what the company's strategy must be; the deployment pattern provides the evidence from which the strategy can be discussed.
For competitors, the insight is not simply that Baleària entered Tarifa. It is that the company added a durable concession to an already expanding North African network. For service providers, the relevant fact is not the number of vessels in the corporate fleet, but the ports where those vessels now generate recurring demand. For ports, the question is whether an operator's growth elsewhere is creating a gap in their own route network or an opportunity to attract adjacent services.
The route map after the press release
The Tarifa-Tangier transition demonstrates why a commercial operator's footprint cannot be read from a single corporate source. The acquisition announcement described DFDS' entry into the Strait. The concession announcement described Baleària's long-term ambition. Timetables described the services available to passengers. Annual reports later showed the scale of international growth.
The vessel's history connected those moments. It showed how the route recovered, which operator dominated the established pattern and when that pattern transferred. It also placed the change in its seasonal context, preventing the summer rise from being mistaken for growth that belonged solely to the new operator.
That is the value of Port Call Trends in company analysis. It does not turn vessel movements into a claim about corporate strategy. It makes the geography of commercial activity visible: the ports where a company repeatedly appears, the markets gaining weight and the moments when a network changes shape.
A company may call itself global, regional or corridor-focused. The operating footprint is more precise. It is the accumulated record of where its vessels are actually being deployed - and, in Tarifa, that record shows a route changing hands in real time.

See why the most successful traders and shipping experts use Kpler

See the shift before the headlines catch up