Global data & analytics for refined product markets


.webp)


450+
14k+
17+
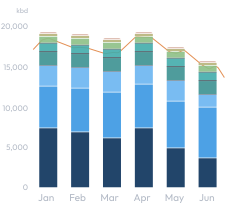
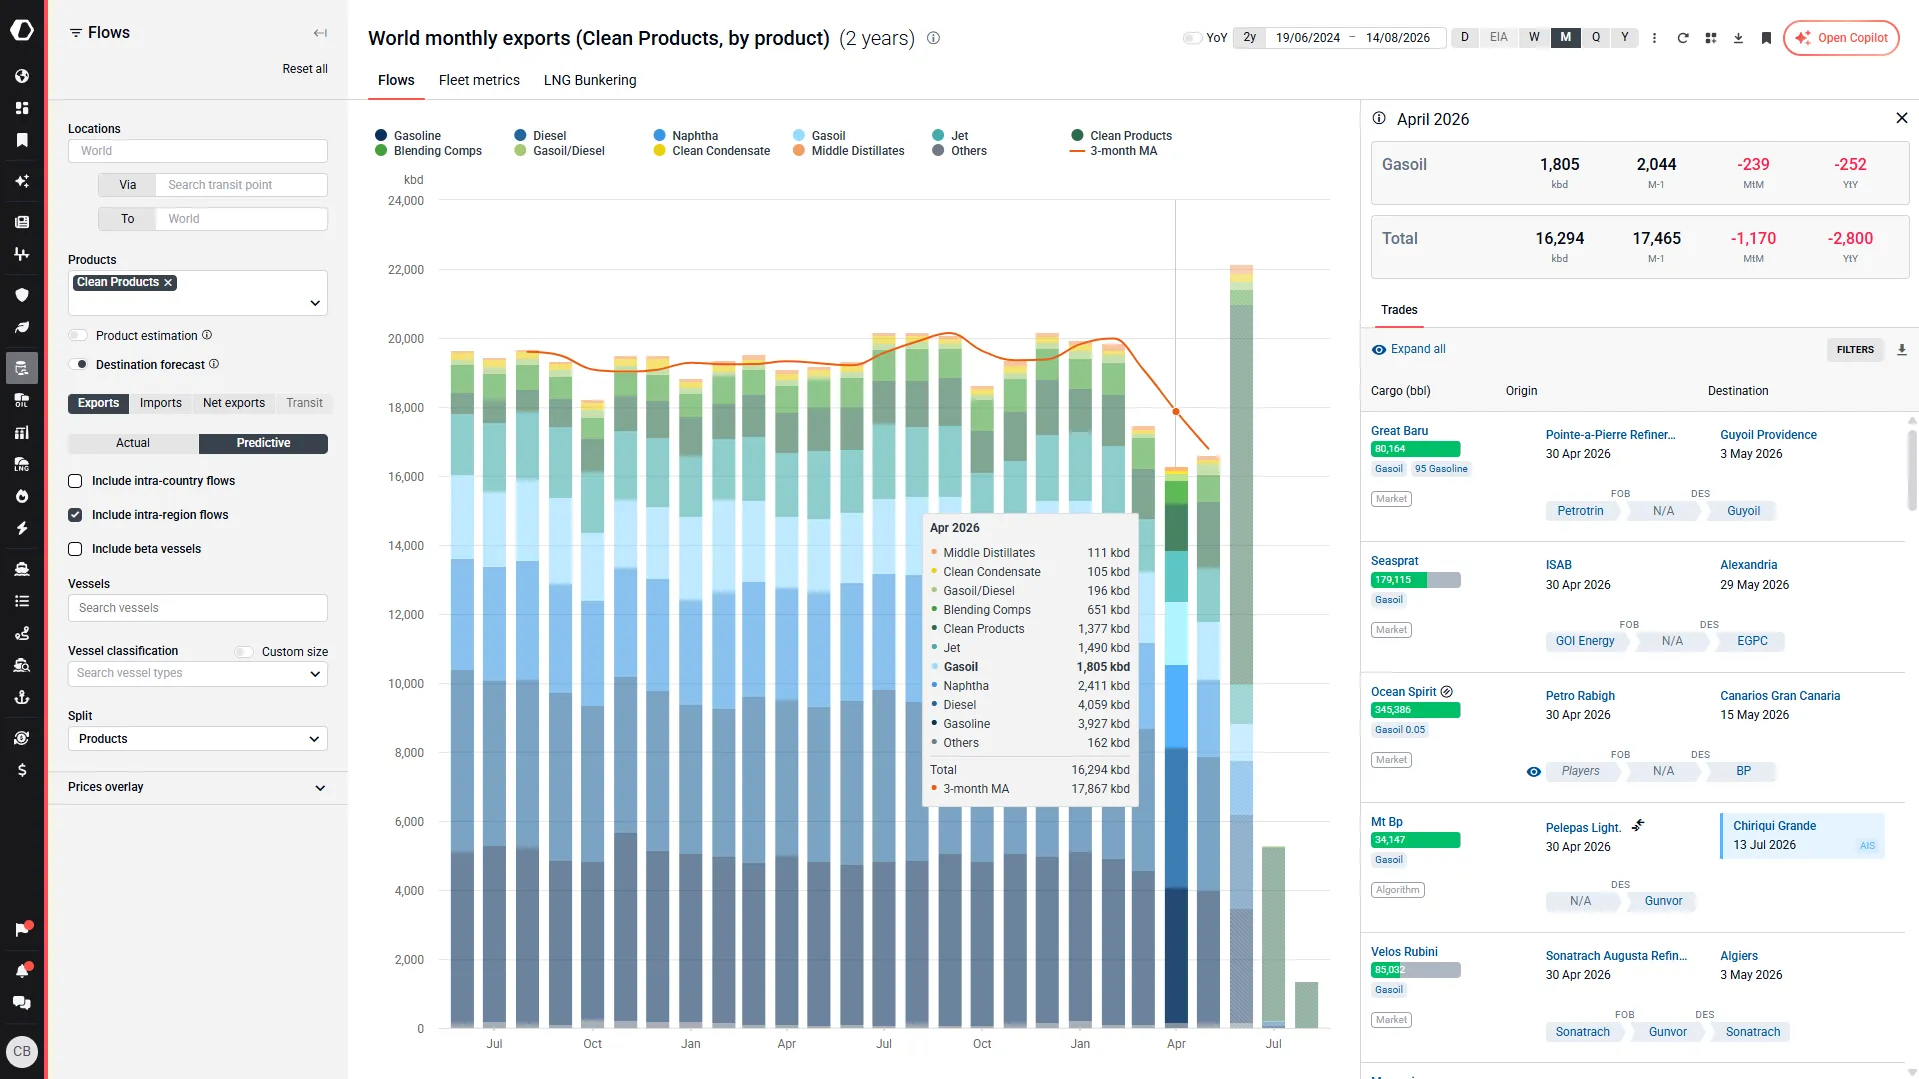
- Cargo and trade flow tracking across the full light ends value chain — gasoline, naphtha, condensates, blending components, and oxygenates — covering fuel and petrochemical markets
- Gasoline grade and blendstock coverage: RBOB, CBOB, Eurobob, PBOB, multiple octane grades, ethanol blends, catalytic cracked, straight run, and pyrolysis gasoline — plus alkylate, reformate, isomerate, MTBE, ETBE, and TAME
- Naphtha and condensate tracking across light and heavy naphtha, virgin and catalytic naphtha, GTL naphtha, and condensate-derived products
- Middle distillate coverage across gasoil, diesel, heating oil, and jet fuel — including ULSD, marine diesel, and gasoil grades from 50ppm to high sulphur specifications
- Kerosene and jet fuel tracking across Jet A-1, JP grades, and SAF-blended jet — supporting aviation fuel and energy transition analysis
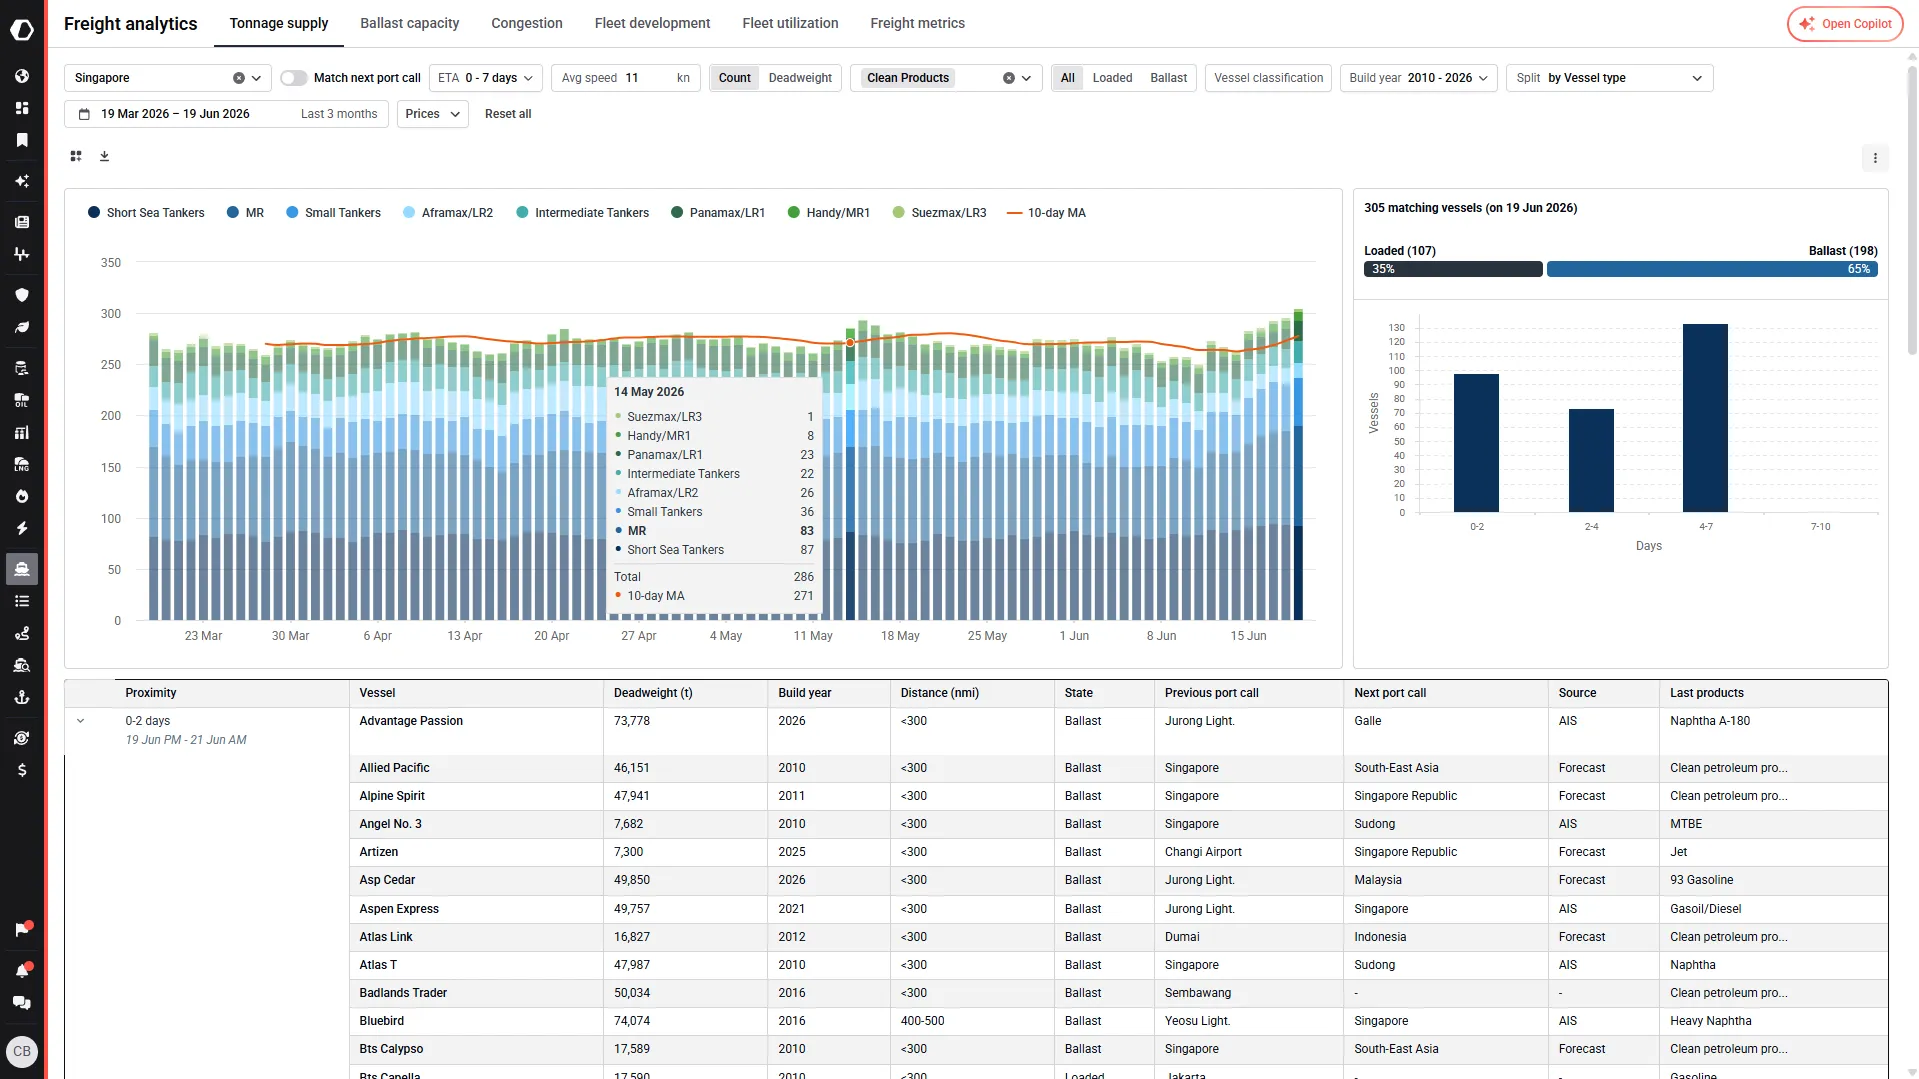
- Tanker fleet analytics by geography, ownership, vessel status, and deadweight — tracking laden, ballast, idle, and in-transit vessels across gasoline, naphtha, diesel, and jet fuel trade routes
- Port congestion visibility at major refined product hubs — vessel queues, waiting times, and operational constraints to support cargo planning
- Ton-mile demand and vessel speed indicators by vessel class and cargo state — assessing freight demand, trade patterns, and operational efficiency across global clean product routes
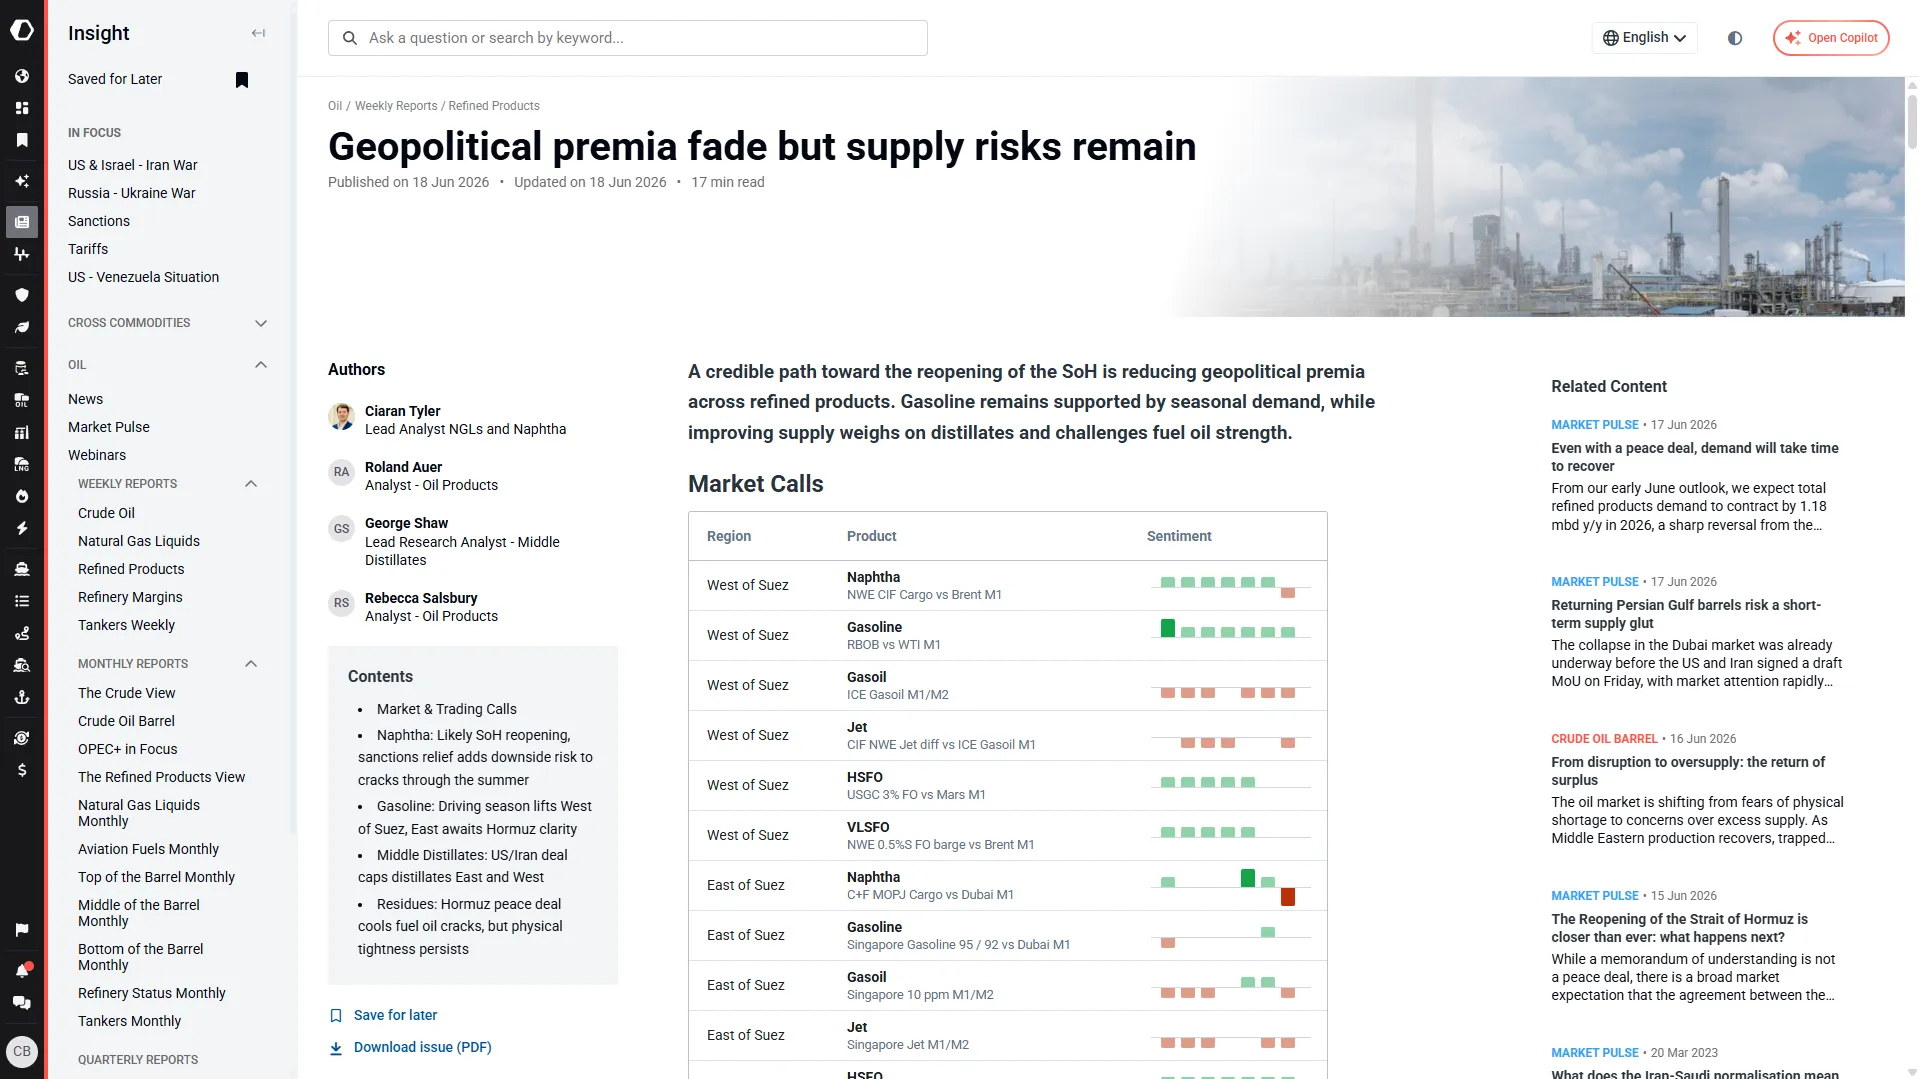
- Regular research across gasoline, naphtha, gasoil, diesel, jet fuel, and LPG — connecting price movements with physical supply, demand, refining activity, and freight across the Atlantic Basin, Asia, and the Middle East
- Fundamental analysis covering refinery run cuts, export restrictions, inventory changes, seasonal demand, feedstock switching, and geopolitical disruptions — from Hormuz events and Chinese export policy to USGC refinery activity and Asian cracker run cuts
- Freight and refining economics context — East-West arbitrage, transpacific flow shifts, freight constraints, and margin changes assessed for impact on prompt balances
- Market commentary integrating crack spreads, arbitrage flows, and regional supply-demand balances — from Asian gasoline shortages and naphtha tightness to European diesel risks and LPG dislocations
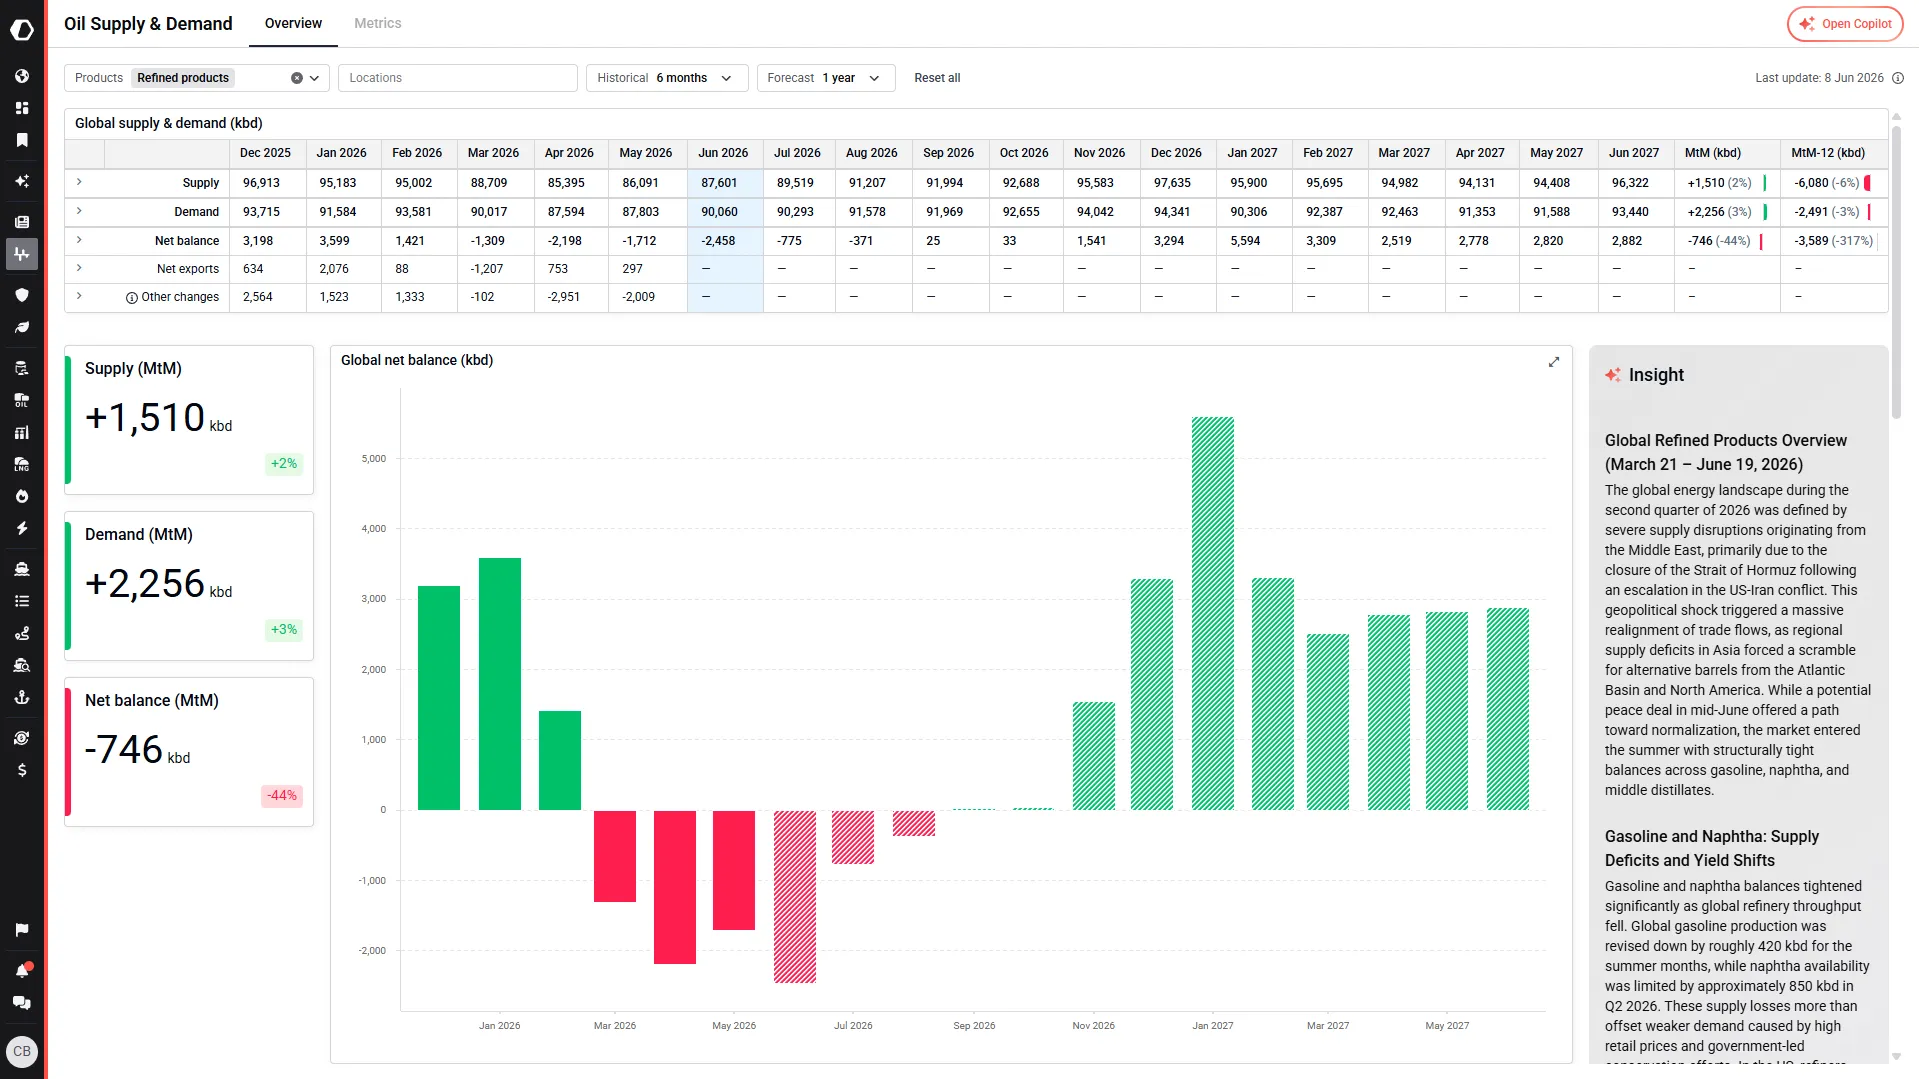
- Structured supply, demand, stock, and trade flow balances across LPG, naphtha, gasoline, jet/kero, and gasoil/diesel — with 18-month forward views across key regional hubs
- Monthly regional balances and stock changes combined with long-term refining capacity outlooks — assessing market tightening, refinery run impacts, and arbitrage dynamics
- Monthly and annual price forecasts linking refining capacity growth, supply disruptions, export availability, and demand trends to market direction
- Integrated framework combining supply-demand data, stock trends, and regional balances to surface emerging risks across global clean product markets
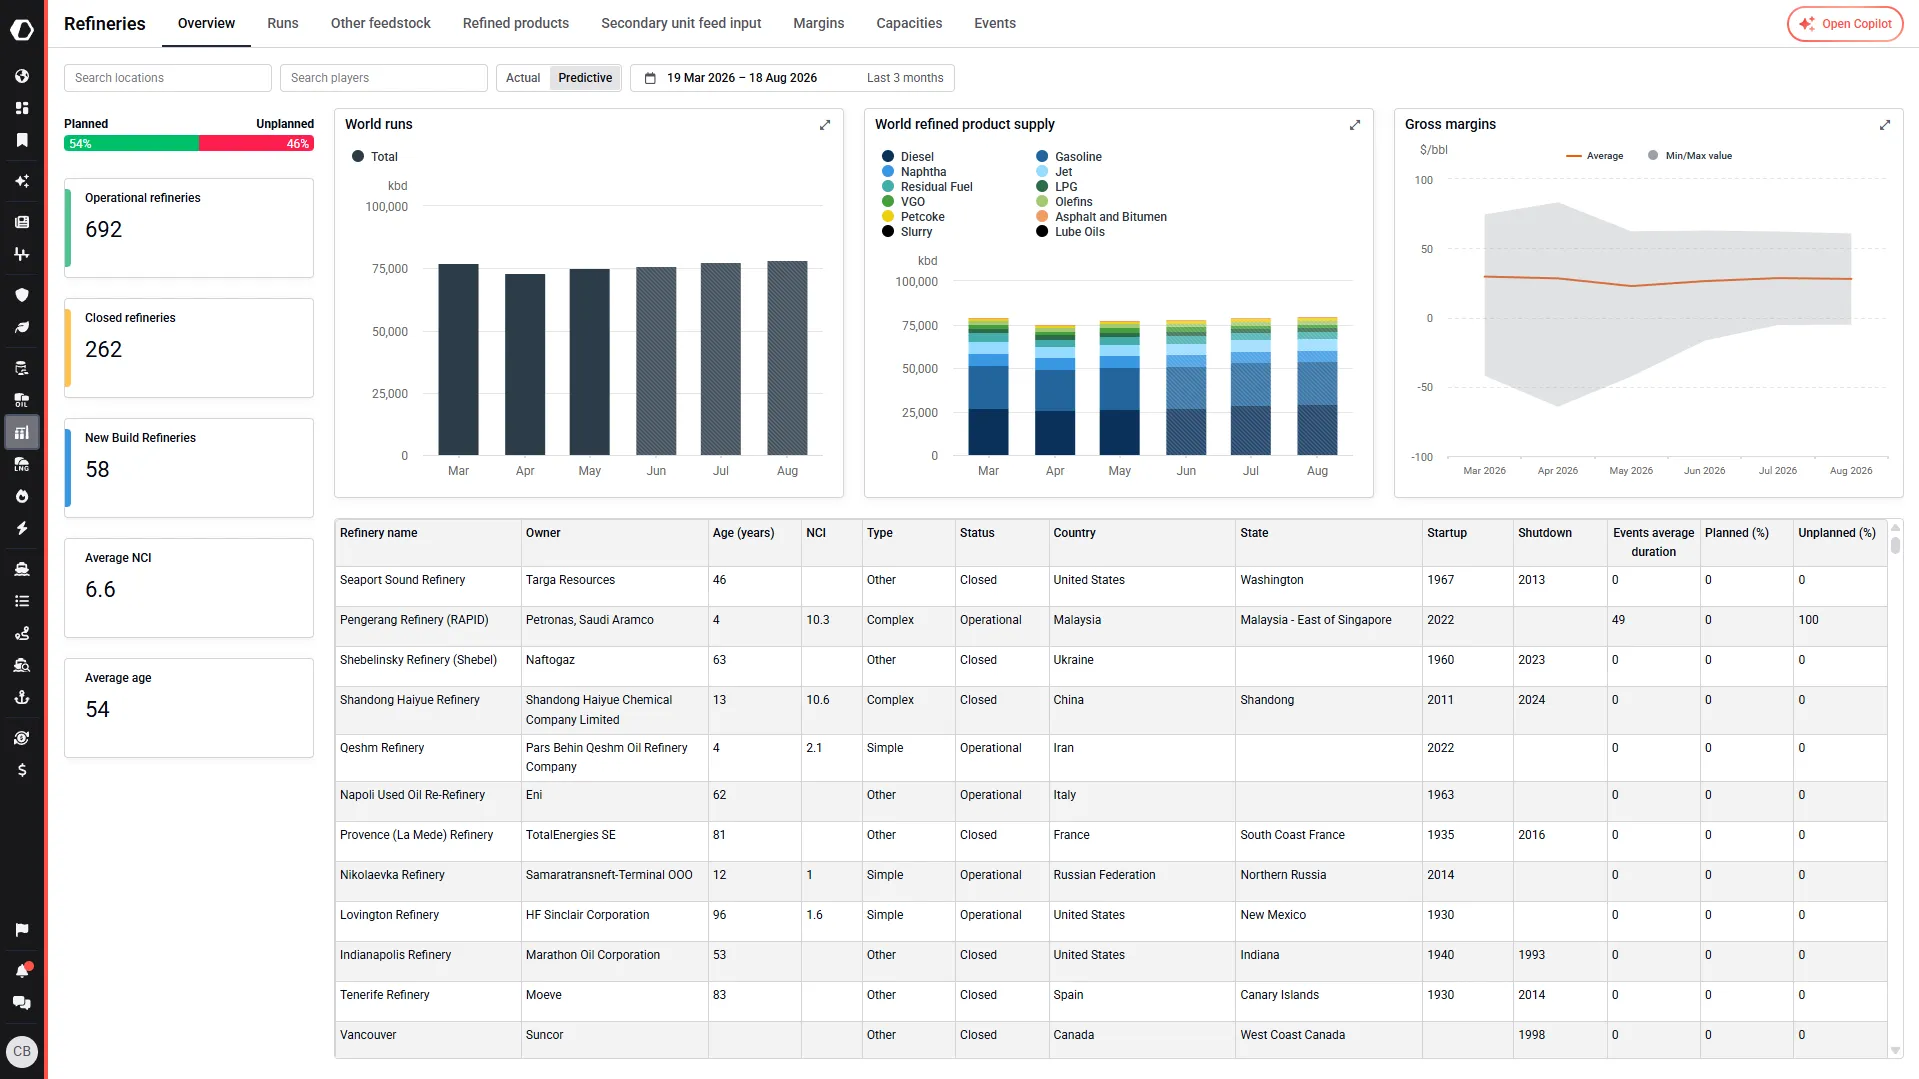
- Refinery-level visibility into crude and feedstock intake, runs, utilisation rates, and throughput trends — tracking how operational changes impact product output, margins, and supply balances
- Secondary unit feed inputs across cokers, hydrocrackers, and FCC units
- Refined product output tracking across gasoline, diesel, and fuel oil — linking feedstock inputs, refinery runs, and yields to downstream supply analysis
- Gross margin calculations per refinery — enabling direct comparison with proprietary margin models and supporting refining economics analysis

“Best part? Kpler dashboards. I set up my metrics once, and they update in real-time. I can access the latest insights instantly.”


FAQ
Light ends and middle distillates are refined petroleum products used across transport, petrochemicals and industry. Light ends include products such as gasoline, naphtha, condensates and blending components, while middle distillates cover diesel, gasoil, jet fuel and kerosene. These products sit at the core of global fuel demand and petrochemical feedstock supply chains.
Kpler provides highly granular, real-time and historical data across the full value chain, including:
- Cargo-level trade flows and vessel tracking
- Detailed product classifications down to grade and specification
- Supply, demand and stock balances
- Freight analytics and vessel performance
- Price forecasts and long-term outlooks
- Refinery runs, feedstocks and product outputs
This enables users to analyze how refined products are produced, traded, blended and consumed globally.
Kpler offers extensive gasoline and blending component coverage, including:
- Regional gasoline grades (RBOB, CBOB, Eurobob, PBOB)
- Multiple octane levels and ethanol blends (E5, E10)
- Refinery streams like catalytic cracked gasoline and straight run gasoline
- Key blending components such as alkylate, reformate, isomerate and ethanol
- Oxygenates including MTBE, ETBE and TAME
This level of detail helps users understand blending economics, regulatory impacts and regional fuel specifications.
Yes. Kpler provides granular visibility into naphtha and condensate markets, including:
- Light, heavy, virgin and catalytic naphtha
- Petrochemical and GTL naphtha streams
- Condensate-derived products and global condensate grades
This allows users to analyze how feedstocks move between refining and petrochemical sectors and how demand shifts between fuel blending and chemical production.
Kpler delivers comprehensive middle distillate coverage, including:
- Ultra low sulphur diesel (ULSD), low and high sulphur diesel
- Marine diesel and multiple gasoil grades (from 50ppm to high sulphur)
- Heating oil and distillate blendstocks
- Jet fuel and kerosene grades (Jet A-1, JP fuels, SAF blends)
This enables detailed analysis of regulation-driven demand, regional consumption patterns and aviation fuel trends.
Kpler tracks real-time cargo movements and vessel activity across global shipping networks.
Users can:
- Monitor flows between refining hubs and demand regions
- Analyze vessel status (laden, ballast, idle)
- Track congestion at key ports and terminals
- Identify disruptions affecting supply chains
This provides a clear view of how refined products move across international markets.
Kpler’s freight analytics cover 9,900+ vessels, enabling users to:
- Track fleet deployment and utilization
- Analyze ton-mile demand and vessel speeds
- Monitor port congestion and waiting times
- Use freight calculators for voyage planning
This helps users understand shipping costs, capacity and logistics risks across gasoline, naphtha, diesel and jet fuel markets.