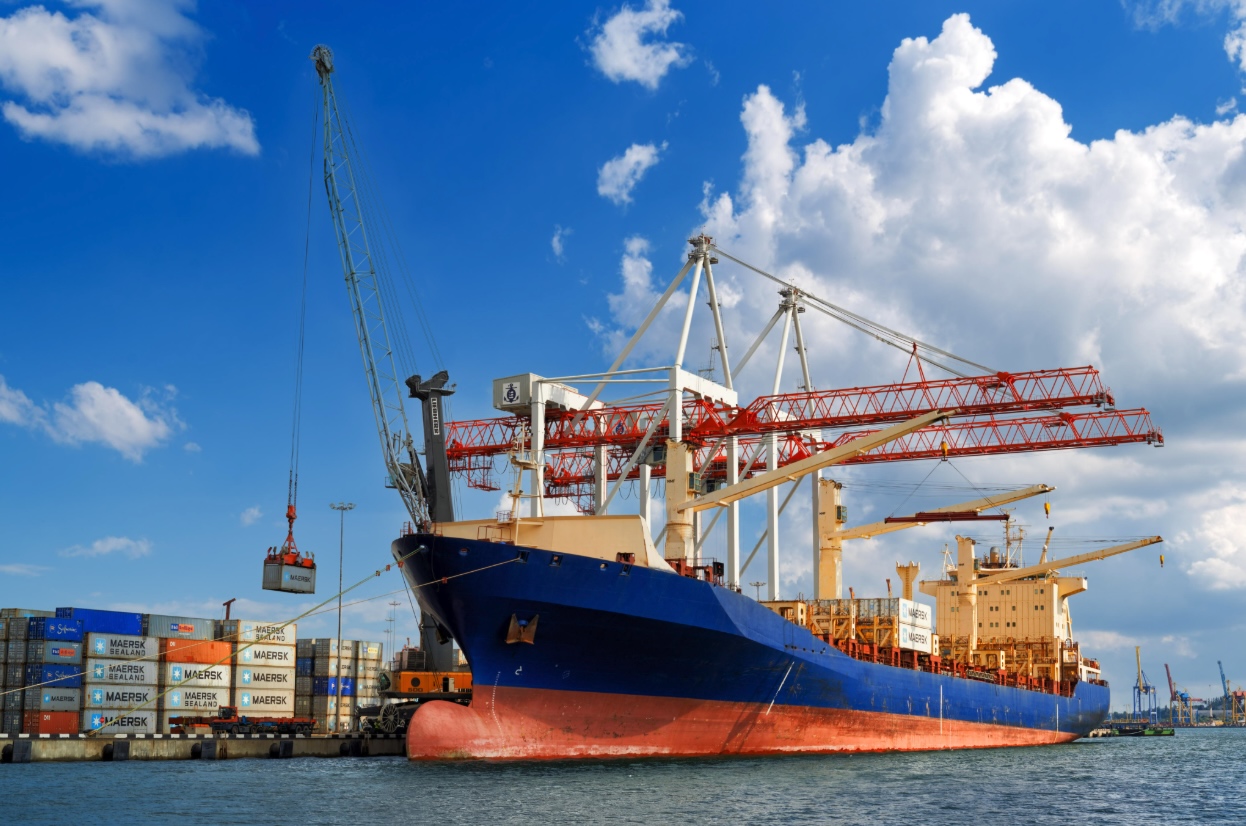

A complete guide to port calls
A port call is a stop a vessel makes along its route to load or unload cargo, take on supplies or let passengers go ashore. For a port authority it is a berth booking. For a ship agent it is a service opportunity. For a commodity analyst it is a data point that, repeated across months and years, can hint at where trade is heading.
This guide covers what a port call is, who relies on port call data, and how to read port call activity as a trend rather than a list of events. It also sets out what port calls cannot tell you, which matters as much as what they can.
What is a port call?
A port call is a vessel's visit to a port, bounded by an arrival and a departure. In between, a vessel may load or discharge cargo, embark or disembark passengers, bunker or undergo repairs.
A single port call is a record of a vessel event. Structured over time, port calls become a time series of arrivals and departures that can be filtered by port, country, vessel type, flag, capacity, owner, operator or commercial manager. That shift, from individual events to the pattern they create, is what turns operational data into market intelligence.
The anatomy of a port call
Every port call can be connected to a set of attributes that add context, such as:
- Event data: including arrival and departure timestamps, port or terminal, and direction (inbound or outbound).
- Vessel data: including vessel type, dimensions, deadweight, capacity fields such as TEU, CEU, liquid, gas, bale, grain or passenger capacity, flag, and fuel and engine characteristics.
- Corporate data: including beneficial owner, registered owner, commercial manager, operator and technical manager.
Several companies can be attached to the same vessel, and the legal owner is often not the party making deployment decisions. For questions about where a company is building market presence, the commercial operator or manager is usually the most relevant lens.
Who uses port call data, and why?
Port calls serve different audiences, each asking a different question of the same underlying activity.
- Port authorities want to know whether today's vessel mix suits tomorrow's infrastructure. The same number of calls from larger vessels can mean more pressure on berth length, draft, tugs or pilotage.
- Ship agents and marine service providers look for owners and managers whose local activity is increasing.
- Shipowners and fleet managers benchmark their deployment against peers.
- Bunker and energy-transition planners want to see where alternative-fuel-capable tonnage actually appears in service.
- Commodity and trade-flow analysts use port calls as an early signal that a route is emerging, declining or recovering.
Volume is not the story: composition is
Port traffic is often reduced to a count of arrivals and departures. That number is useful, but it can hide structural change. Two periods can show identical call volumes while the vessels behind them have become larger, are controlled by different owners, are managed by different operators, or carry different fuel and engine characteristics.
Volume tells you how much activity occurred. Composition tells you what changed.
A ferry port can hold the same monthly call count while one operator replaces another. A bunkering hub can see modest growth in total arrivals while the share of dual-fuel or methanol-ready tonnage rises sharply. In each case, the signal sits in the makeup of the calls rather than their number.
Four things port call data can reveal
1. A changing trade route
Commercial shipping from Ukraine's Black Sea ports was heavily disrupted after February 2022. Single sailings could not show whether traffic was genuinely returning. Structured as a monthly series, bulk-carrier departures from Chornomorsk tell a clearer story:
The setup mattered as much as the result. Departures suit an export corridor, filtering to bulk carriers removed tugs, tankers and other unrelated traffic, and monthly granularity absorbed individual sailings into a pattern. One busy month could reflect weather or scheduling; a run of elevated months is much harder to dismiss.
The same logic applies to sudden disruptions:
2. A shift in who is operating a route
A stable call count can conceal a change of hands. In the Strait of Gibraltar, the high-frequency link between Tarifa in southern Spain and Tangier Ville in Morocco was long associated with FRS Iberia/Maroc, which DFDS agreed to acquire in 2023. By May 2025, DFDS had withdrawn from the route and Baleària began operating it on 8 May with four daily departures from each side, later adding a second fast ferry.
Press releases capture the acquisition, concession and operator change. The vessel record shows what happened on the water:
A total-traffic line would only show that the market was active. Split by beneficial owner, the same data shows commercial control transferring. But project-driven markets behave similarly. For example, at Blyth, subsea support-vessel arrivals contracted after a mid-2023 peak and later recovered, but the commercial managers visible in the recovery differed from those prominent earlier. The activity returned; the account universe changed.
3. Structural growth versus a record
Ports often describe growth through records – the busiest month, the millionth passenger, the highest annual total. Records can overstate how permanent a change is.
Galveston offers a useful test. Cruising from the port was suspended for roughly fifteen months and resumed in July 2021, so any chart starting in 2021 shows a steep rise that reflects recovery as much as growth. In late 2022, the port opened a third cruise terminal and welcomed its first Oasis-class ship.
The more telling evidence came from repeated seasonal peaks:
The seasonal cycle remained, but its ceiling had moved, and operator composition broadened, with greater weight from Royal Caribbean and more visible contributions from other lines.
4. Where the alternative-fuel fleet is actually operating
The fuel transition is usually measured through orderbooks and annual bunker volumes. Port calls fill in the space between them by showing where capable vessels actually appear in routine service.
Barcelona illustrates the progression:
In 2024, car carriers also received LNG for the first time, and a dual-fuel fast ferry entered service between Barcelona and the Balearic Islands. The significance lies in recurrence and breadth, with more capable vessels returning, and more vessel types participating.
Rotterdam shows a similar pattern with methanol-ready tonnage:
The development that matters is the move from isolated appearances to a persistent population.
One caveat applies. A dual-fuel vessel switches between LNG and conventional fuel depending on price, availability, contracts and voyage economics, so a capable vessel calling at a port is evidence of deployment, not of consumption. One review of 500+ dual-fuel vessels across 2024–2025 found actual LNG demand was only about 35% of the fleet's theoretical potential. Port calls show where future consumption could occur, while bunkering records show what was realised.
A repeatable method for reading port calls
Across all four examples, the analytical sequence is the same – start with a decision, not a chart. A chart-first approach encourages over-interpretation:
- Market: Define the port, country, corridor or company footprint.
- Segment: Isolate the vessel class relevant to the question. Unrelated traffic dilutes the signal.
- Direction: Choose arrivals or departures based on the trade being tested. Departures suit an export corridor.
- Company: Split by owner, operator or commercial manager where competitive presence matters.
- Characteristic: Use vessel type, capacity, flag, engine or fuel readiness to explain composition.
- Trend: Compare the same population over a long enough period, and against an appropriate baseline.
- Investigate: Review the vessels and external context before deciding why the change occurred.
Match granularity to the question – weekly for a port closure, monthly for structural change, quarterly or yearly for long-term growth.
Separating structural change from noise
Shipping is seasonal and exposed to weather, congestion, maintenance and scheduling effects, so a single month's rise or fall proves little. Three practices help.
- Use a long baseline: Judging Chornomorsk's 2024 figures against the depressed 2022 months alone would overstate the recovery; the pre-war period is the more credible reference. A large jump from an unusually low start can still fall short of normal, while a small increase that persists above the historical range can be far more meaningful.
- Compare like with like: Year-on-year and same-season comparisons account for seasonality. Galveston's winter peaks only mean something against earlier winter peaks.
- Look for persistence: Moving averages and multi-year views separate recurring deployment from event noise.
What port calls cannot tell you
Port call data is strongest when its limits are explicit. The working rule is to use port calls to detect and quantify change, and use the underlying vessels and external context to explain it.
- Calls are not cargo. If departures rise from 100 to 120 in a month, cargo will not necessarily rise 20%, because vessel mix, capacity and loading factors vary. Departures do not confirm a vessel left fully laden.
- Calls are not passengers or profitability. Larger ships can carry more passengers without more calls. Calls show presence and frequency, not load factors or financial return.
- Calls are not consumption. Capability is not fuel use.
- Calls do not explain themselves. A rise in departures could reflect a new export route, seasonal demand or traffic diverted from a nearby port. Establishing a cause requires tenders, schedules, company reporting, cargo data, freight rates or trade statistics.
- Counts treat every call as equal. A large and a small vessel each contribute one call unless analysis incorporates capacity or size bands.
- Data has edges. Ownership relationships change, vessel particulars can be incomplete, and coverage may focus on IMO-registered vessels. Check unknown or unclassified categories before drawing conclusions from a split view.
Where port calls fit among other sources
Announcements signal intent but do not show how quickly a plan becomes deployment. Schedules are prospective, and fleet lists are static. Annual statistics arrive late and aggregate several routes or effects into one figure.
The port call record sits between them in that it is granular enough to show the route and the vessels, yet historical enough to show whether activity persisted. It can separate a one-off first call from a genuine operating presence.
4 key takeaways
- A port call is an observed vessel event. Structured over time, it becomes a trend.
- Composition matters as much as volume.
- Persistence separates structural change from a spike, and a long baseline separates recovery from growth.
- Port calls detect change; other sources explain it.
A port call is not the conclusion. It is the starting point for a more precise view of the maritime market.

See why the most successful traders and shipping experts use Kpler

Turn port call activity into actionable intelligence