
Explainer: Higher-risk tankers lift a growing share of Mideast Gulf crude
Tankers with a history of Russian, Venezuelan or EOPL (dark ship-to-ship) cargoes now lift about one in every five barrels of crude clearing the Mideast Gulf, up from about one in twenty before the war against Iran.
Key takeaways
- Volume. Higher-risk tankers loaded 20 million barrels (mb) a month of Mideast Gulf crude in the 12 months before the war and never more than 31 mb. In October they loaded 66 mb, about 21% of the 307 mb of crude that cleared the Mideast Gulf, against 4% to 7% (average 5%) before the war.
- Russia-linked tankers dipped, then rebounded. They loaded 19 mb a month before the war and about 6 mb a month from March to August, then 25 mb in September and 34 mb in October (1.3 and 1.8 times the pre-war average). Nearly a quarter of the pre-war volume was back-hauling from India.
- Venezuela- and EOPL-linked tankers are new. Venezuela-linked tankers never exceeded 4 mb a month in 2025 and loaded 10 mb in October (16 mb including those that also carry Russian crude). EOPL-linked tankers, whose cargo history includes the dark ship-to-ship transfer zone off Johor, loaded nothing before the war and 16 mb in October.
- Iraq is the largest origin (58% of post-war volume) and VLCCs are now 47% of volume, up from 9%, driven by the Venezuela- and EOPL-linked tankers.
“Higher-risk tankers” are vessels whose cargo history includes Russian-origin crude, Venezuelan crude without an identified licence, or EOPL-tagged cargo, at any time since January 2022. The label describes cargo history and is not a finding that anyone has breached sanctions. We cover only the Mideast Gulf, where freight to China has been highest: loadings at Gulf terminals and STS receipts in the Gulf and the Gulf of Oman, which is what Mideast Gulf clearance measures. Yanbu on the Red Sea and the Fujairah, Oman and Egyptian terminals are left out.
Volumes have more than tripled from the pre-war baseline
Between March 2025 and February 2026, higher-risk tanker loadings ran between 14 mb and 31 mb a month, 4% to 7% of Mideast Gulf clearance. We measure clearance as Kpler’s Hormuz series for crude and condensate: transits of the Strait of Hormuz (excluding Iranian-origin cargoes) plus net exports from the Gulf of Oman. After the war against Iran began (US-Israeli strikes started on 28 February; we treat March as the first war month), volumes fell below the baseline through May, then climbed to 14 mb in June, 32 mb in August and 66 mb in October, when 46 vessels loaded.
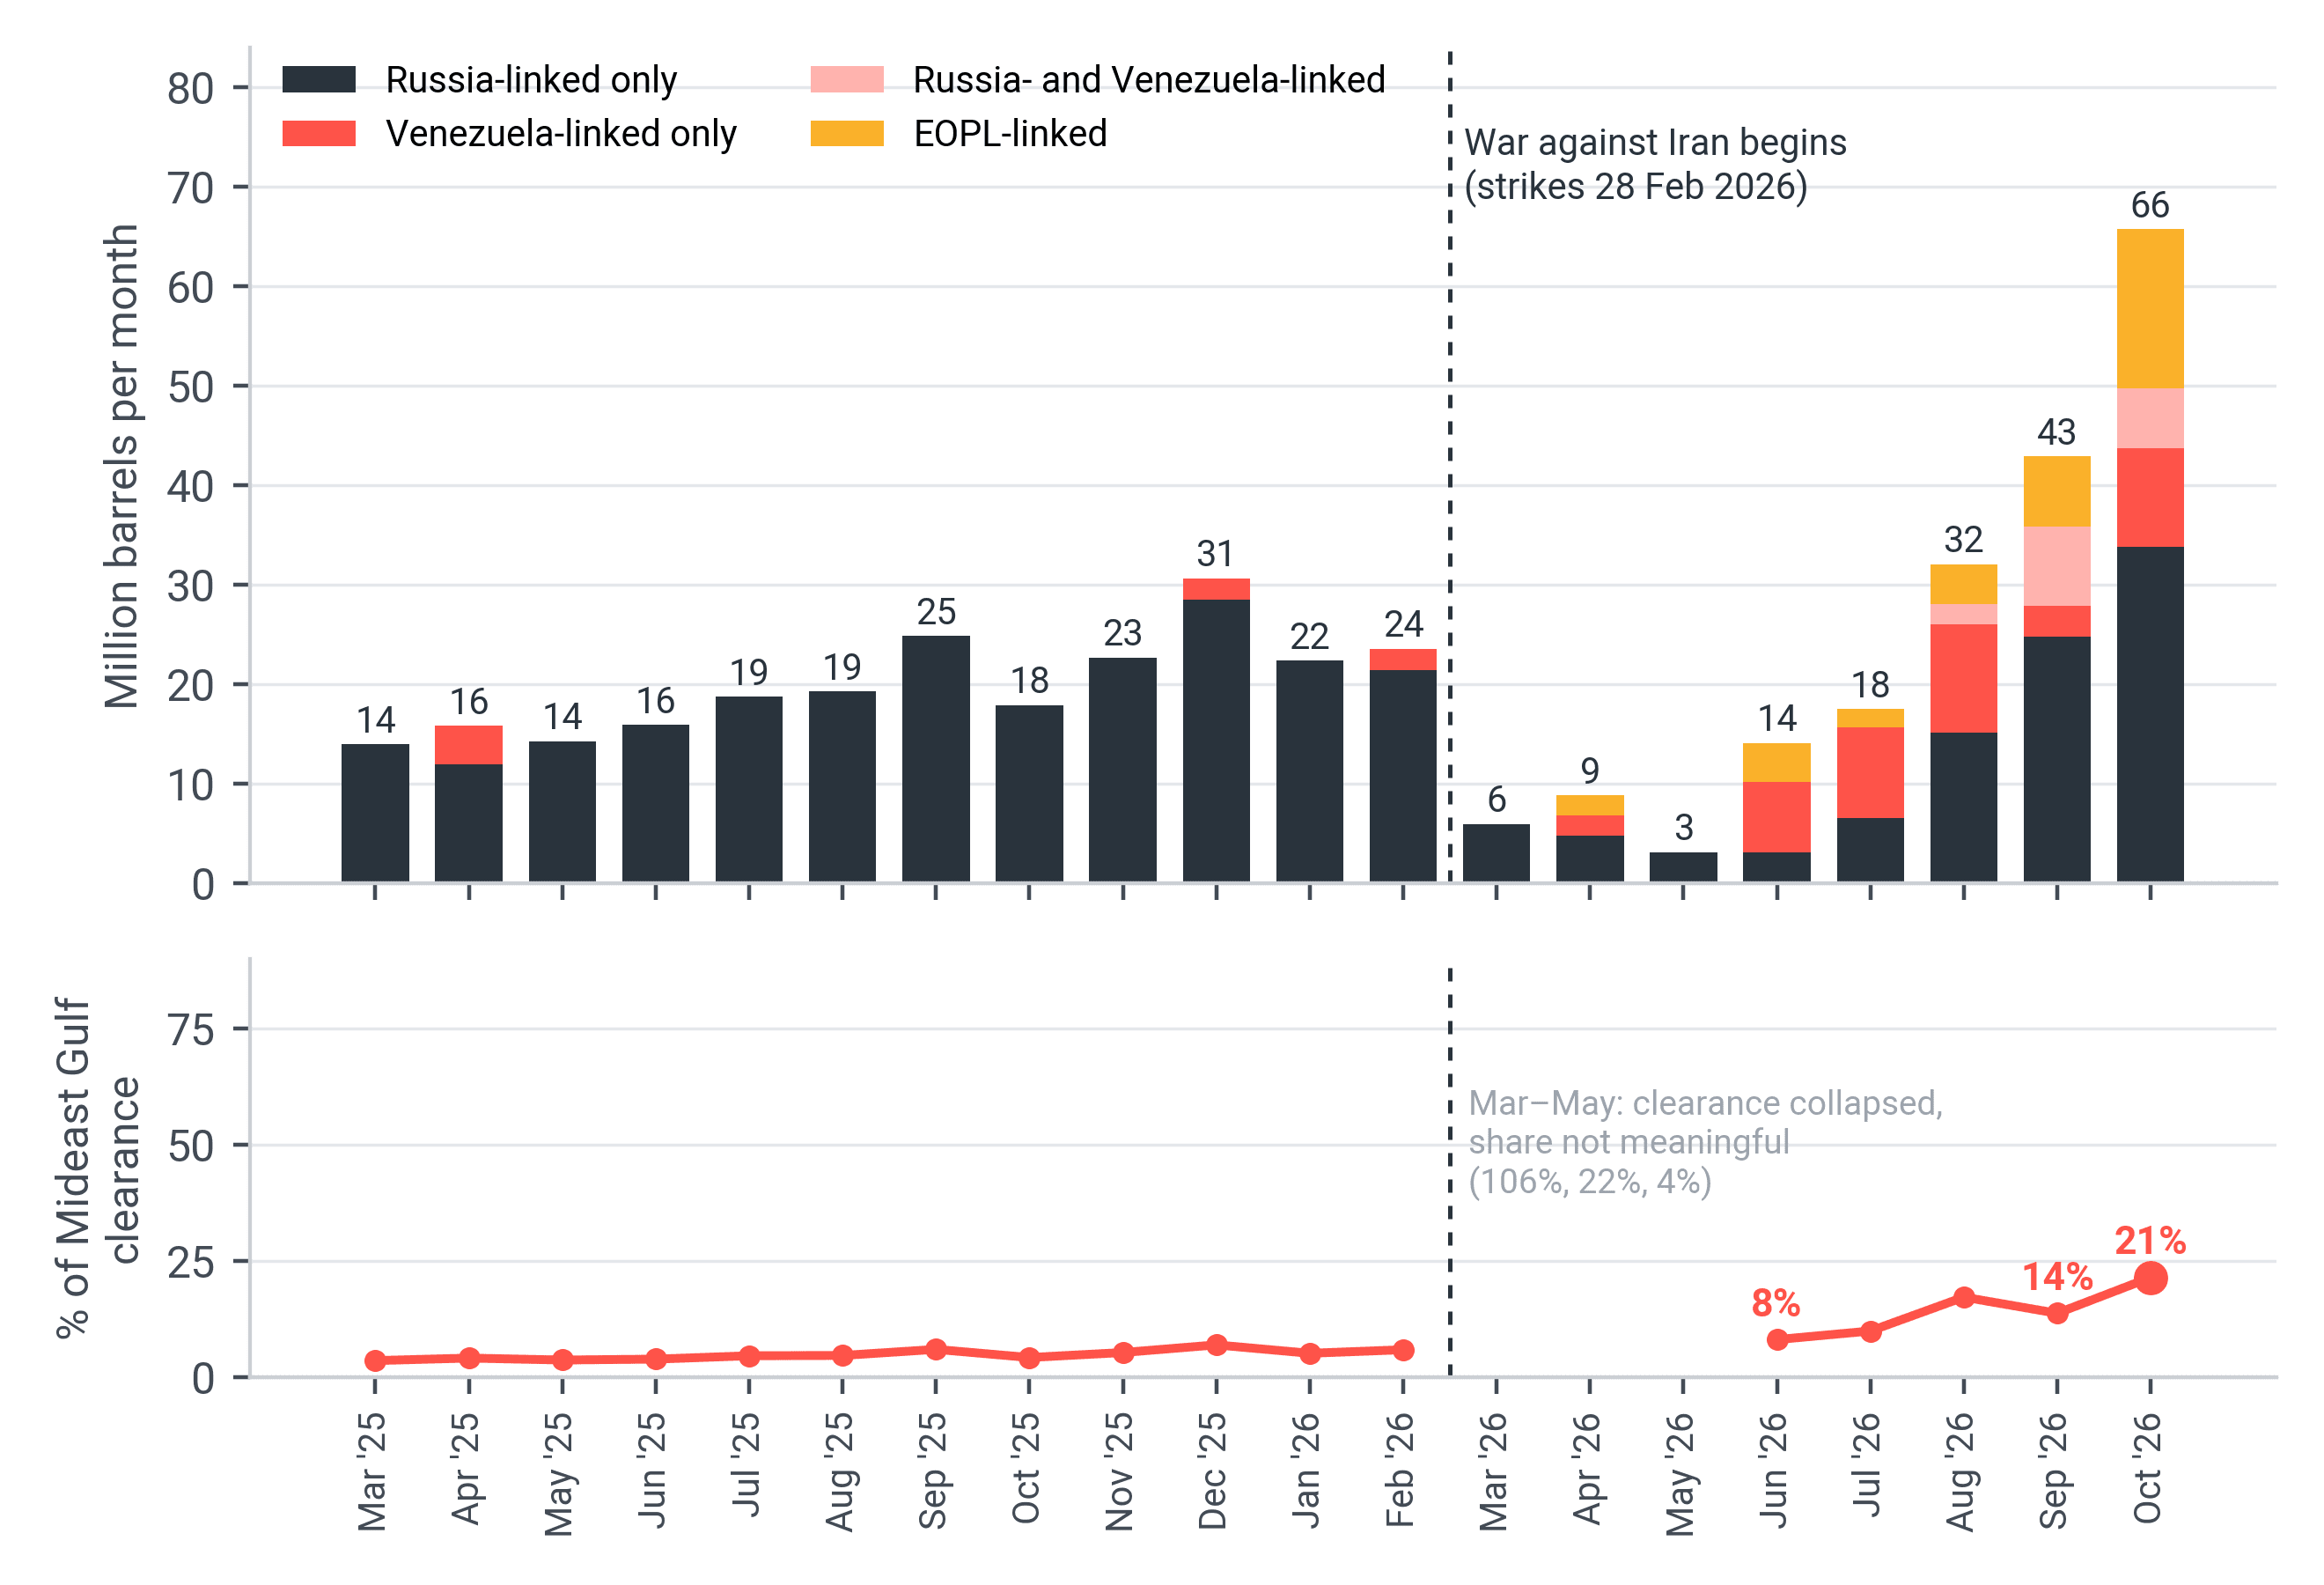
Figure 1. Higher-risk tanker loadings of Mideast Gulf crude, by cargo history (top), and as a share of Mideast Gulf clearance (bottom). Source: Kpler. October is 1 to 31 October. Each tanker appears once, in the order EOPL, Russia and Venezuela, Russia, Venezuela. The share is not shown for March to May, when clearance collapsed.
In March to May, clearance collapsed from about 420 mb a month to 6 mb, 40 mb and 71 mb, so the ratio in those months (106% in March, 22% in April) is not meaningful. From June, as clearance recovered to 176 mb, 313 mb in September and 307 mb in October, the share rose from 8% to 21%. The rise from September (14%) to October is led by volume: loadings rose 53% while clearance was flat.
This is a crisis market, and freight from the Mideast Gulf to China has been particularly high. Clearance fell by more than 90% in March and April, and transiting the Strait of Hormuz remains dangerous. Many owners stayed away and rates rose, drawing back owners with a higher tolerance for risk, including those operating higher-risk tankers. That does not mean the market is disregarding compliance: about four in five barrels still cleared the Gulf in October on other tankers, and we cannot see individual vetting decisions.
Three choices change the size of the share but not the direction. Adding vessels whose only history is licensed Venezuelan crude gives 34% for October (105 mb). Leaving out STS receipts, which could count a barrel twice if a shuttle tanker and the tanker it transfers to are both in the set, gives 16%. Counting Russian cargo only within the previous 12 months, and keeping listed vessels and Venezuelan or EOPL histories, gives 18% against 4% before the war.
Russia-linked tankers: a dip, then a rebound
Before the war, tankers with Russian cargo histories were the staple of higher-risk tankers in the Gulf: 73 vessels and 97% of volume. Their loadings fell by more than half once the war began, averaging 6 mb a month from March to August, then recovered: 25 mb in September and 34 mb in October, 1.3 and 1.8 times the pre-war average of 19 mb, and above any baseline month (the highest was 29 mb in December 2025). They remain the largest group in October, ahead of EOPL-linked (16 mb), Venezuela-linked (10 mb) and Russia-and-Venezuela-linked (6 mb) tankers, and account for about a third of the rise over the pre-war average.
A large part of the baseline looks like back-hauling. Of 263 baseline loadings, 112 followed a Russian loading within 120 days, and in 107 of them (96%) the Russian cargo went to India. In 58 loadings by 45 vessels (54 mb, 23% of baseline Russia-linked volume) the tanker discharged in India and then loaded Mideast Gulf crude with no other laden voyage in between, a median 13 days after arriving (range 5 to 47 days). The main discharge ports were Sikka, Mundra, Cochin, Paradip, Visakhapatnam and Vadinar. With the Gulf a short ballast leg from India, loading there keeps the vessel earning, but we cannot see charter terms, so this shows the pattern, not the intent.
Many of these tankers trade Russian crude only part of the time, and whether a Russian cargo breaches western sanctions can depend on factors such as the price at which it was sold, which a vessel record does not show. We therefore keep all Russian crude in the risk group, including the CPC Russia grade (loaded at the CPC Terminal near Novorossiysk; CPC Kazakhstan is not counted), without testing price-cap compliance.
Venezuela-linked tankers: the new entrants
What separates the last eight months from the previous twelve is the arrival of tankers that had earlier carried Venezuelan crude without a licence we can identify. Volume never exceeded 4 mb a month in 2025, then rose to 7 mb in June and 11 mb in August, fell to 3 mb in September (when the group that also has Russian cargo rose to 8 mb) and reached 10 mb in October (16 mb including that group).
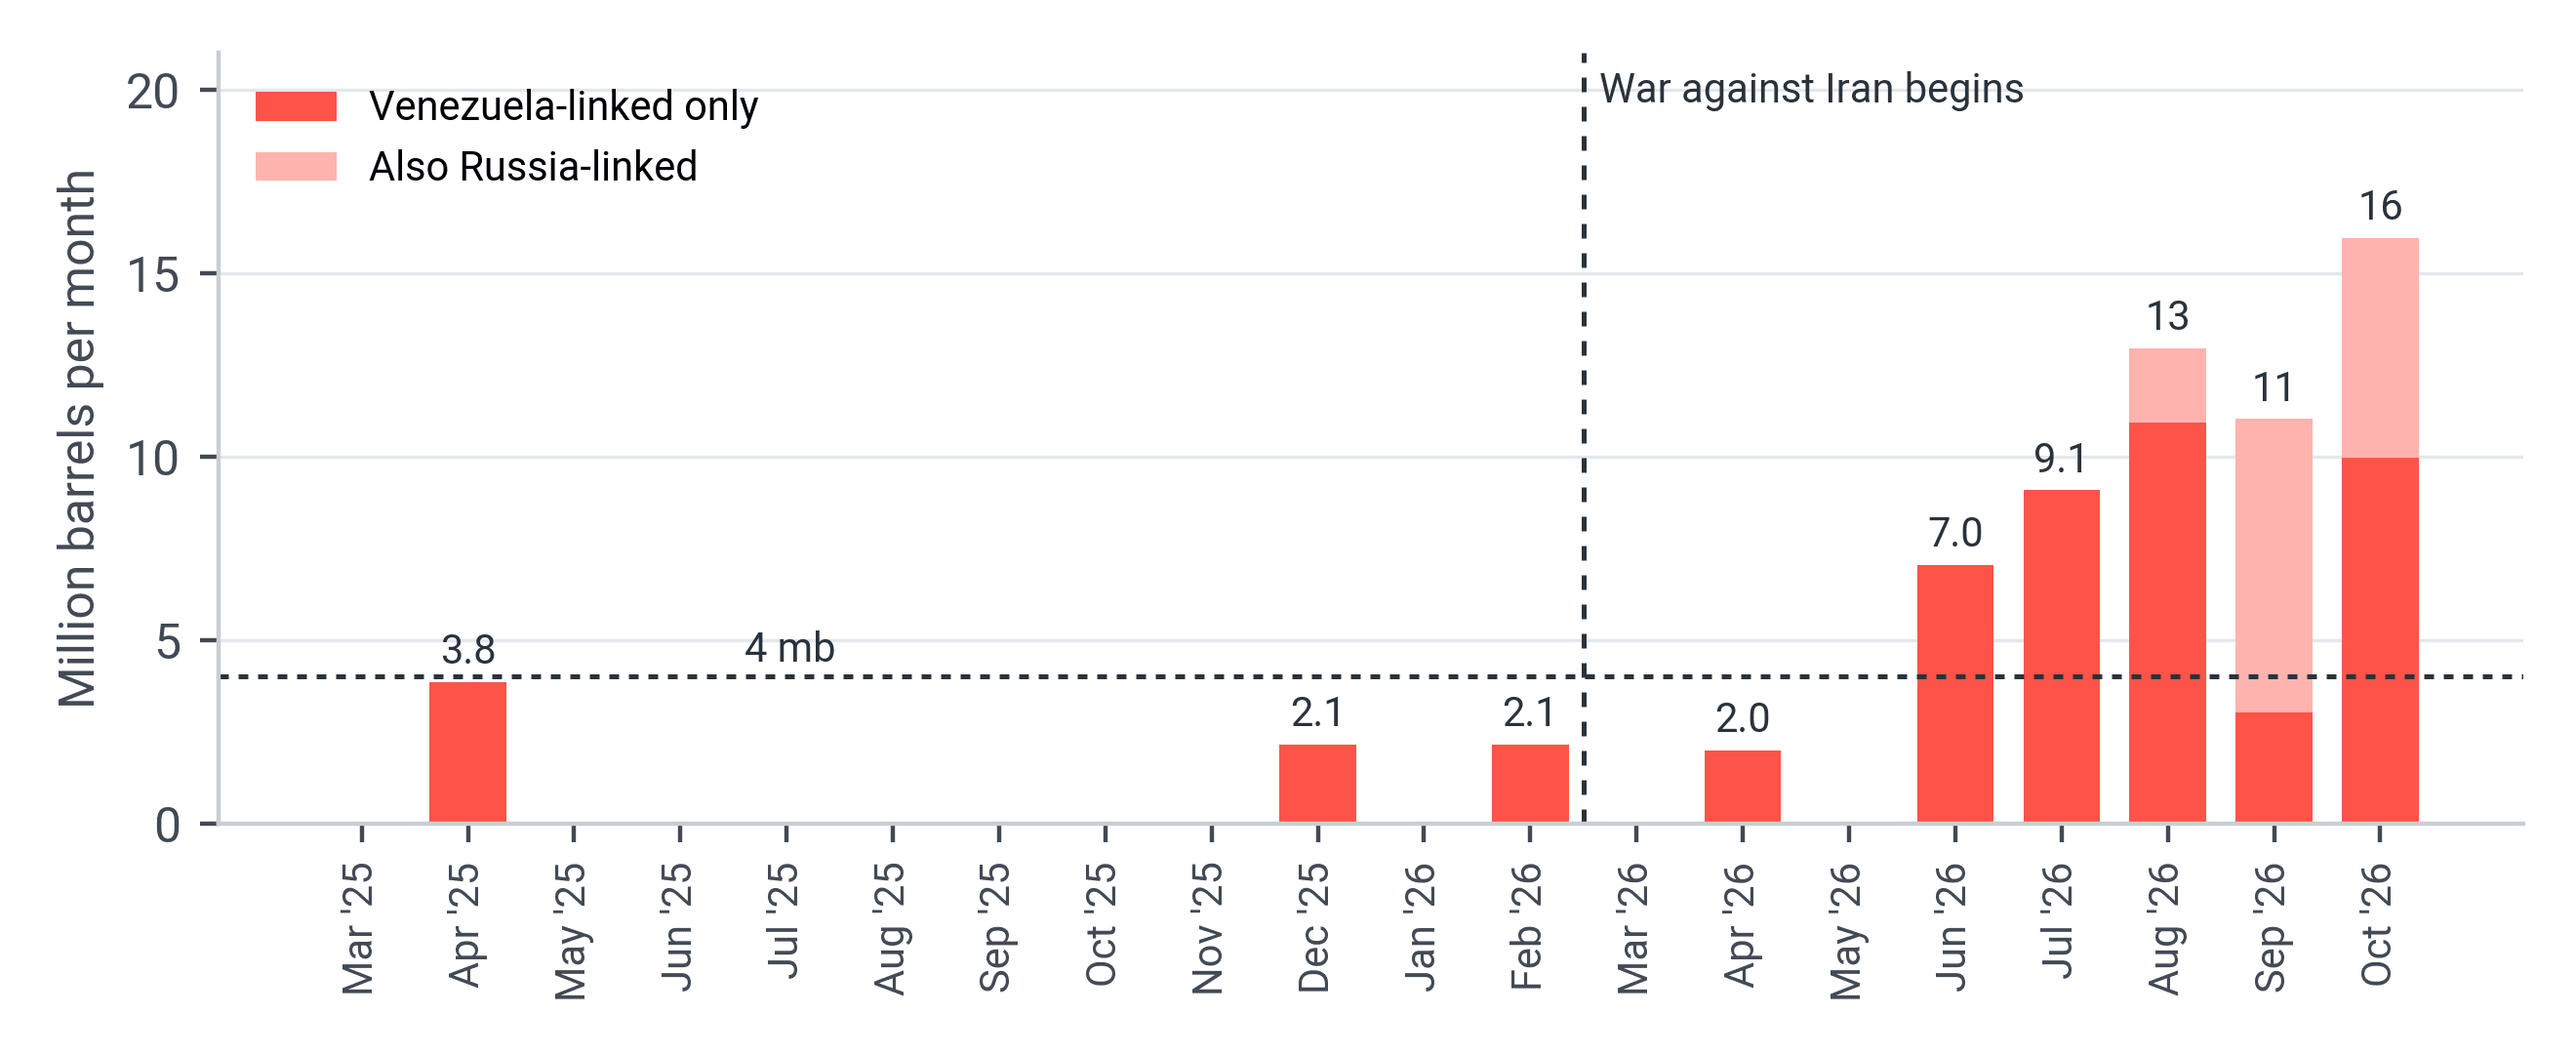
Figure 2. Mideast Gulf crude loaded by Venezuela-linked higher-risk tankers. Source: Kpler. Excludes Venezuelan cargoes assessed as licensed.
There were 3 such vessels before the war and 13 since. Eleven of the 13 are new to higher-risk Gulf loading rather than Russia-linked vessels switching, and only 1 of the 38 vessels that loaded in both periods changed profile.
Freight is the pull. Kpler’s freight analysts reported record VLCC rates from the Mideast Gulf to China in early October, with Hormuz tanker crossings averaging 13 a day against 50 before the war and Asian crude imports back within 1% of pre-war levels. Push factors matter too: Kpler Insight coverage points to the US blockade and seizures off Venezuela from mid-December 2025 and US-controlled sales from January, which left the Venezuelan dark fleet idle, and to the blockade of Iran’s exports, which left EOPL-linked tankers without work.
A forward-looking signal comes from Kpler analysts tracking former dark-fleet VLCCs repositioning to the Middle East after the US eased shipping restrictions. Two VLCCs left Venezuela signalling Sohar in Oman for a late-November arrival, and a third loaded at Al Basrah and transferred its cargo after leaving the Strait. None is sanctioned, all are more than 25 years old, and the analysts distinguish them from the wider OFAC-designated fleet. The US decision allowing such tankers to trade legally came in late October, after the June to September rise, so this points to what may come, not what has happened.
EOPL: dark STS cargoes
EOPL, the Eastern Outer Port Limits, is Kpler’s label for the zone off Johor, at the eastern end of the Singapore Strait, where frequent dark STS transfers take place, and for the grade transhipped there under opaque operations. Iranian crude is the predominant cargo, but some Russian cargoes move the same way. A vessel is “EOPL-linked” when it carried EOPL-tagged cargo before a Mideast Gulf loading. The tag marks the opaque transfer, not the origin of the oil, so we do not describe these tankers as Iran-linked. Six of the seven carried EOPL cargo, two carried cargo tagged Iran, and one carried both.
Seven vessels fit that description after 1 March and none before. They loaded 35 mb between April and October, 16 mb of it in October. 91% of that volume was on VLCCs, 77% was loaded in Iraq and 17% in Saudi Arabia.
Where these tankers load: mostly Iraq
Iraq accounts for 58% of post-war higher-risk volume (13.8 mb a month, up from 9.6 mb before the war), other Gulf producers (Kuwait, Qatar and the Neutral Zone) for 19%, the UAE for 10% and Saudi Arabia for 6% (1.4 mb, down from 5.3 mb). Saudi Arabia’s share is small because about nine-tenths of the Saudi crude these tankers lifted after the war began loaded at Yanbu or in Egypt, outside this piece. The shares are by loading grade and include the 8% received by STS transfer without a confirmed grade (“Unallocated”), which most likely originates in the Mideast Gulf and could change the country shares if identified. Venezuela-linked tankers loaded 72% Iraqi crude and EOPL-linked tankers 77%, while tankers linked only to Russia loaded a more varied mix: Iraq 43%, other Gulf producers 24%, the UAE 15% and Saudi Arabia 5%.
A note that applies to all higher-risk tankers. Kpler records each cargo under its respective Mideast Gulf grade, whether Iraqi, Kuwaiti, Qatari, Emirati or Saudi, or from the Saudi-Kuwaiti Neutral Zone. The shares show which crude each group of tankers lifted, not the conduct of producers or sellers: sellers generally sell free on board, buyers nominate the vessel, and sellers normally vet that nomination.
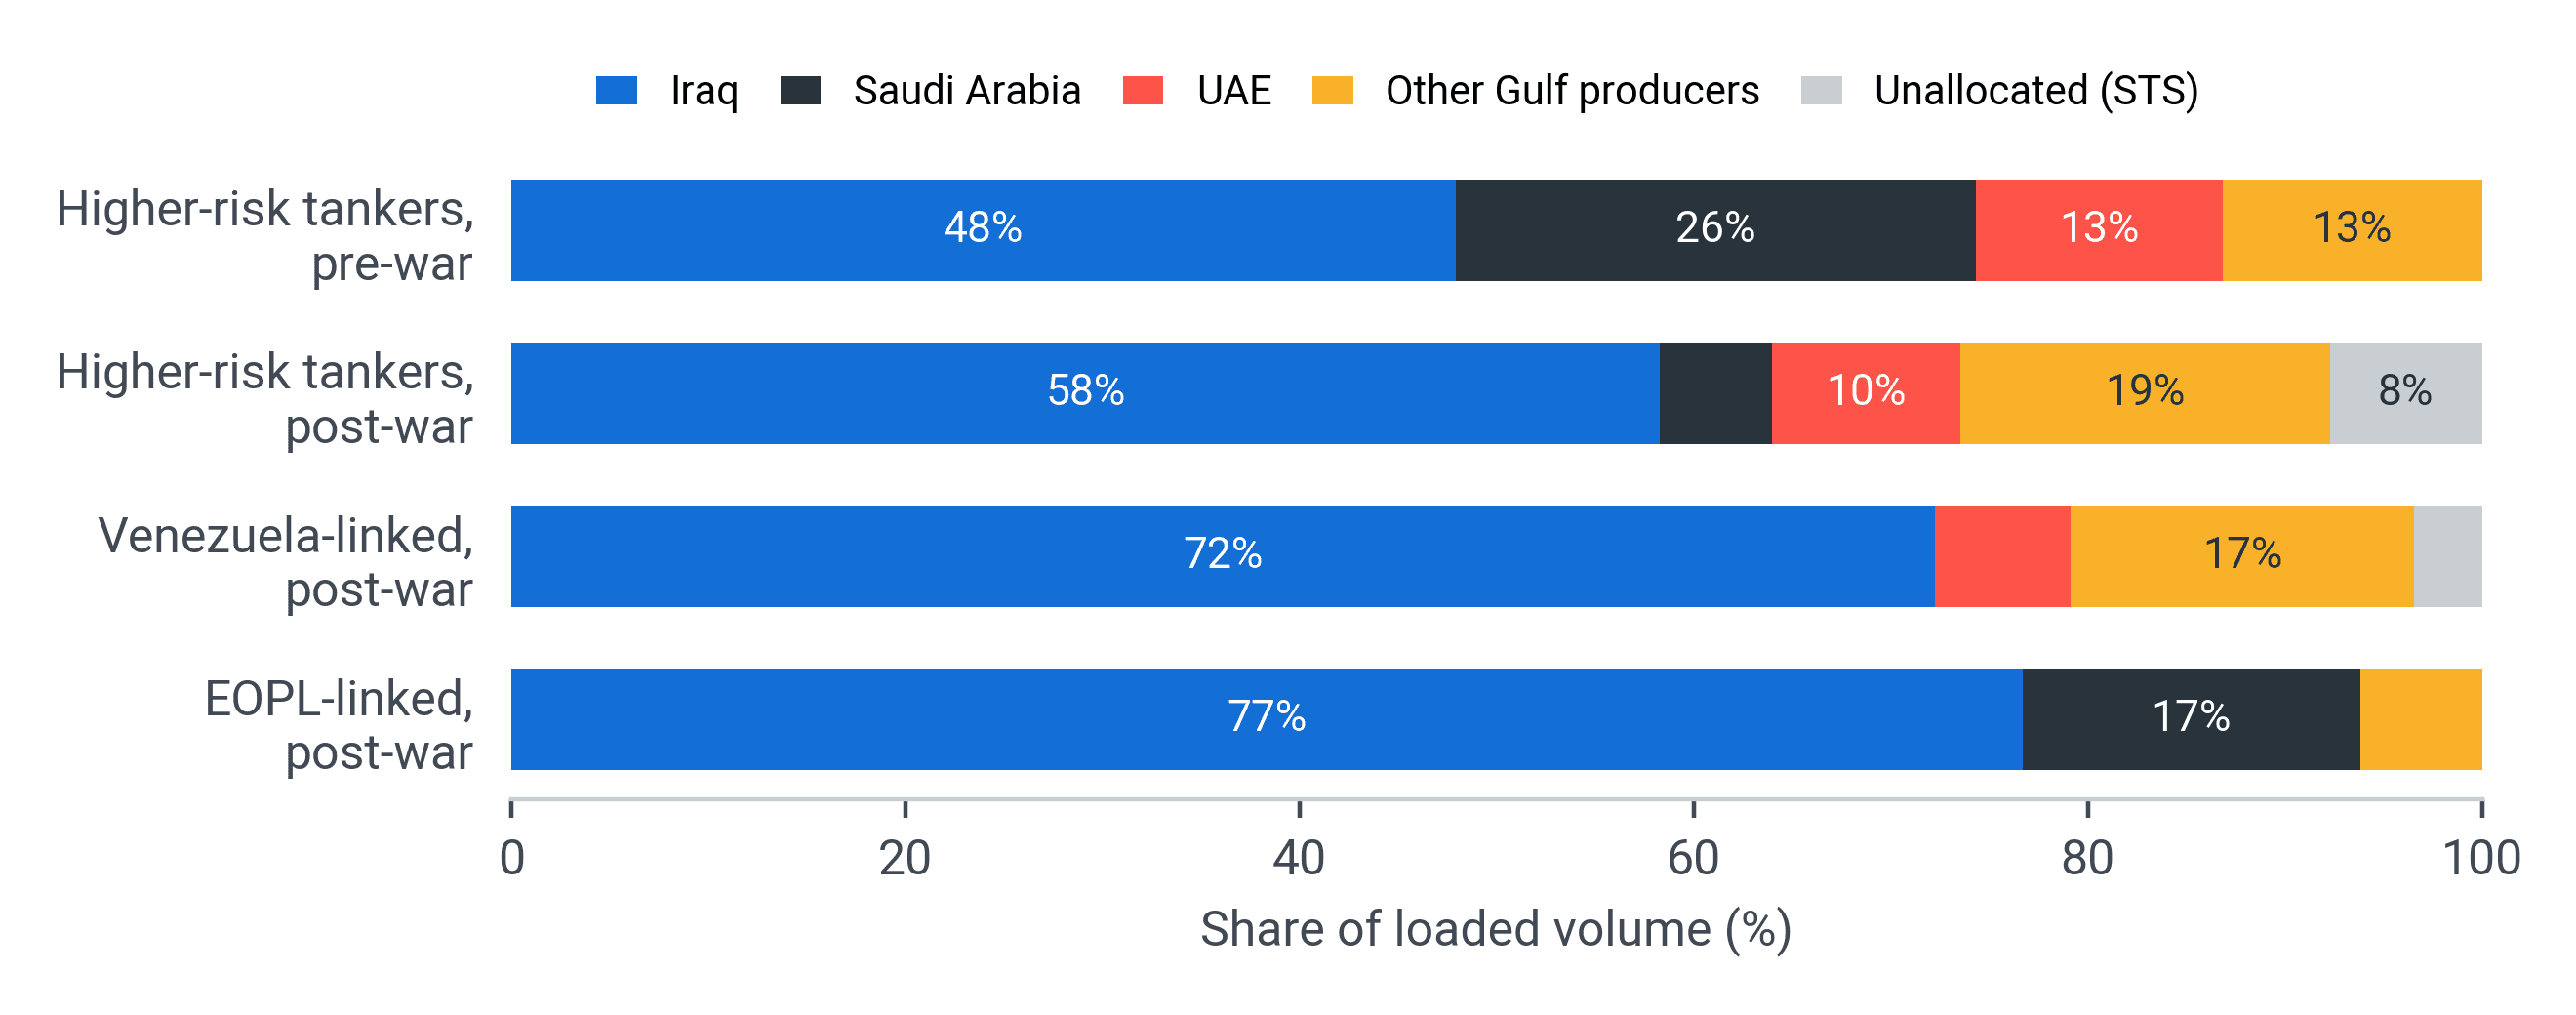
Figure 3. Where higher-risk tankers loaded, share of loaded volume. Source: Kpler. Mideast Gulf loadings by loading grade, including STS receipts in the Gulf and Gulf of Oman. “Unallocated” are STS receipts without a grade assignment.
Larger ships: the VLCC effect
VLCCs lifted 1.8 mb a month before the war and 11.2 mb a month since, more than the whole 3.8 mb a month rise in higher-risk volume, as Suezmax volume fell from 17.3 mb to 12.1 mb. 93% of Venezuela-linked and 91% of EOPL-linked volume is on VLCCs, against 4% for the Russia-linked group, which still depends on Suezmaxes. The shift fits a trade toward Asian customers that is carried mainly on VLCCs.
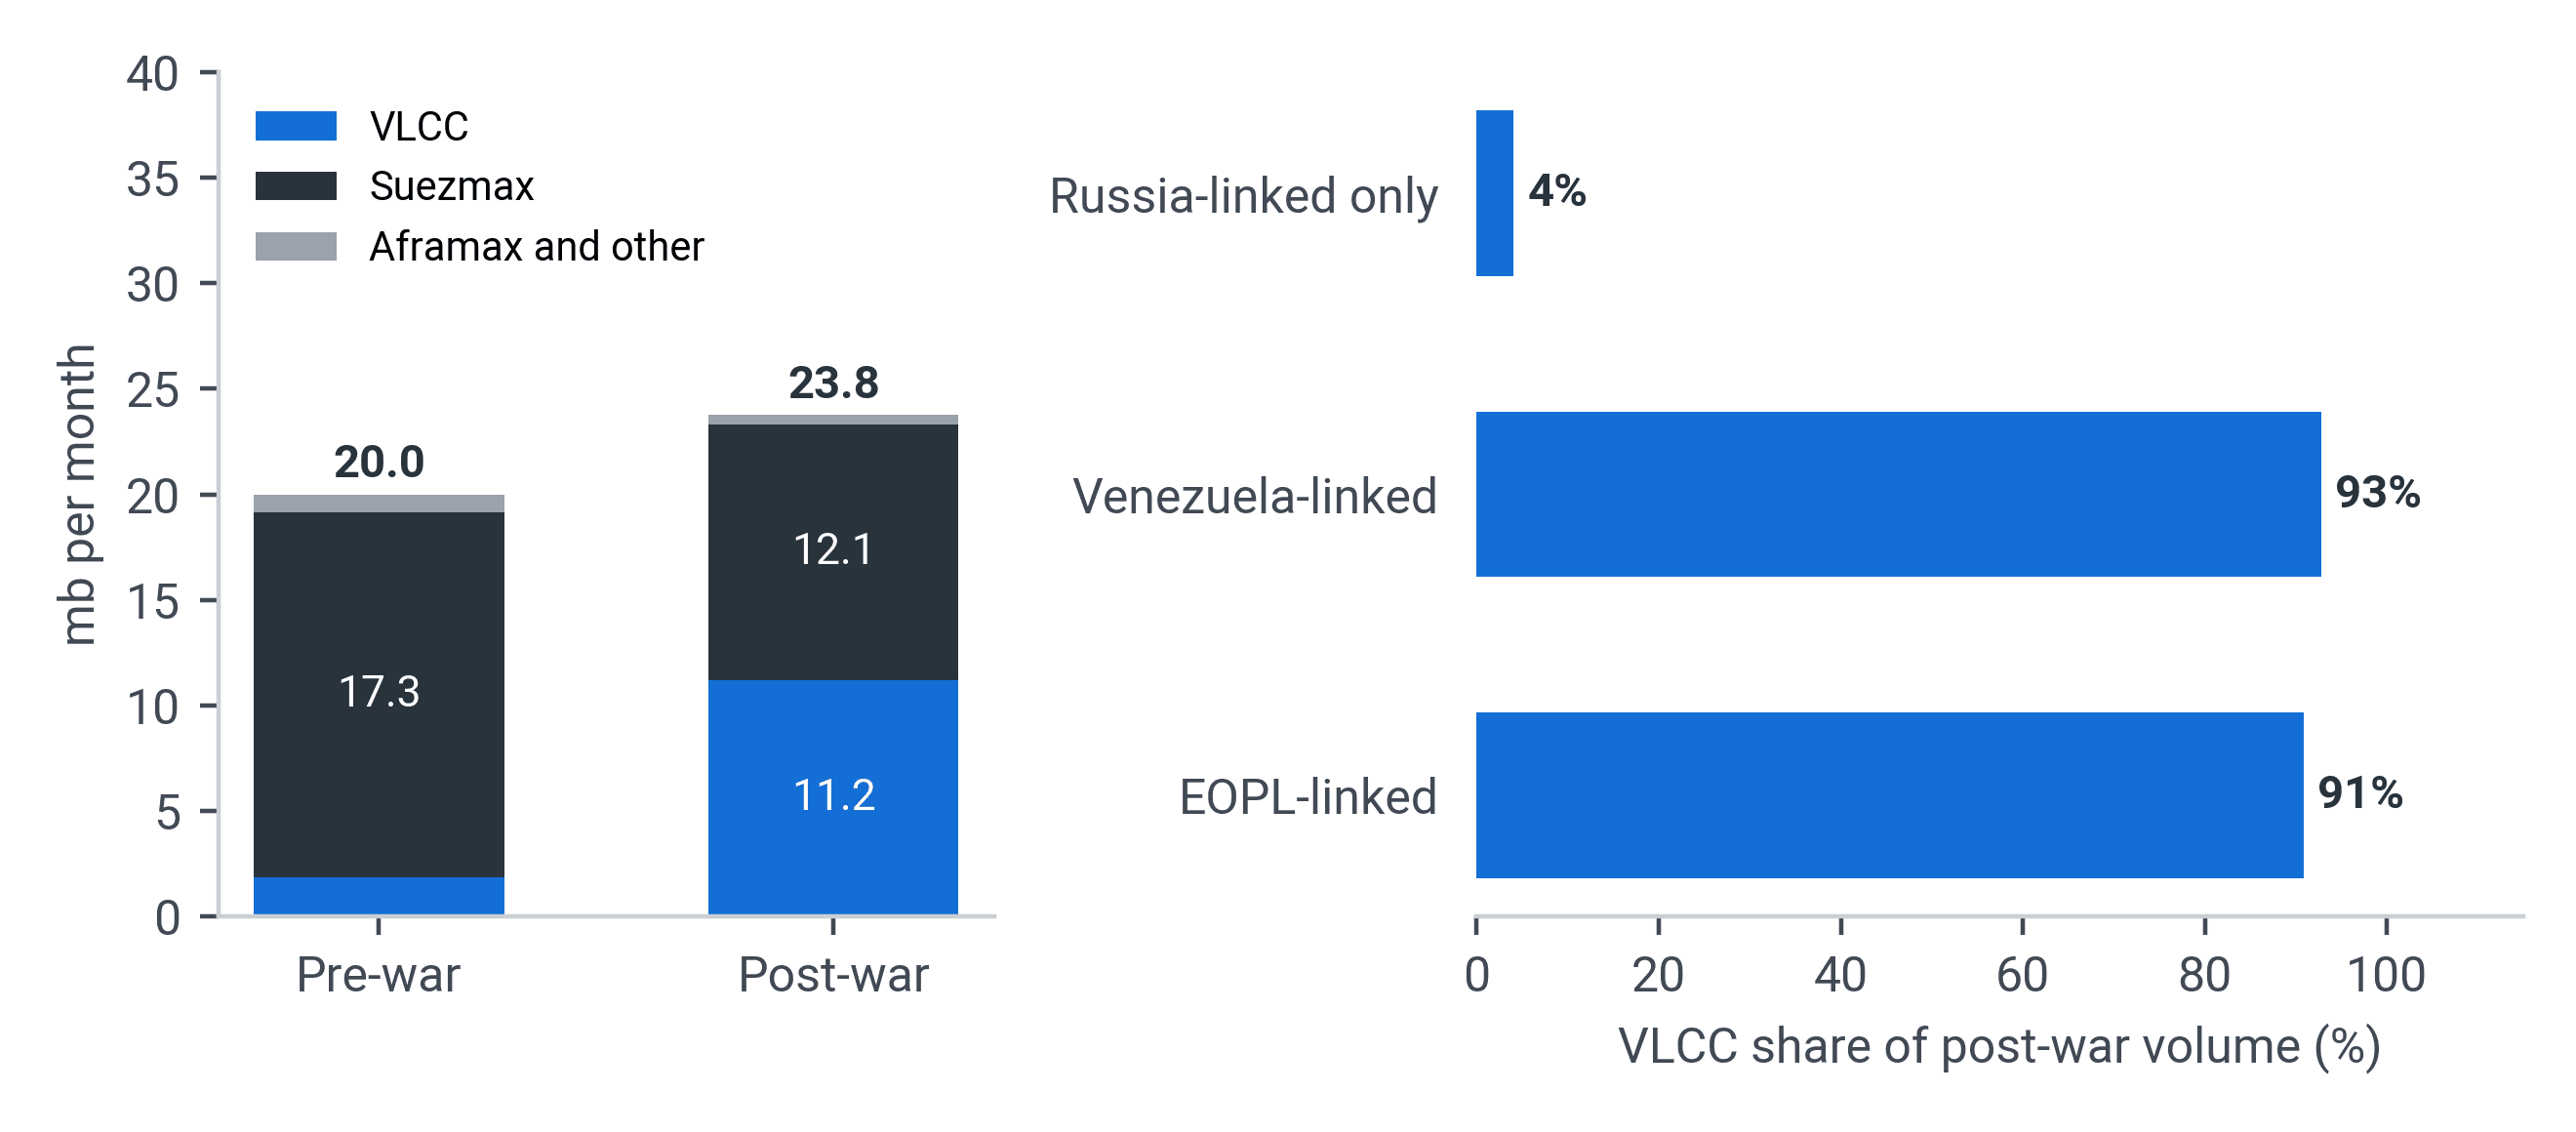
Figure 4. Higher-risk tanker volume by tanker class (left) and VLCC share by cargo history (right). Source: Kpler. Post-war = 1 March to 31 October 2026. Mideast Gulf loadings only.
Reading the sanction categories
We group every screened tanker into one of four tiers from its Kpler Risk & Compliance findings, and a vessel takes the highest that applies. The tier describes the vessel’s status today, not the cargo being loaded, which is why a tanker can sit in a mild tier and still load a risky cargo.
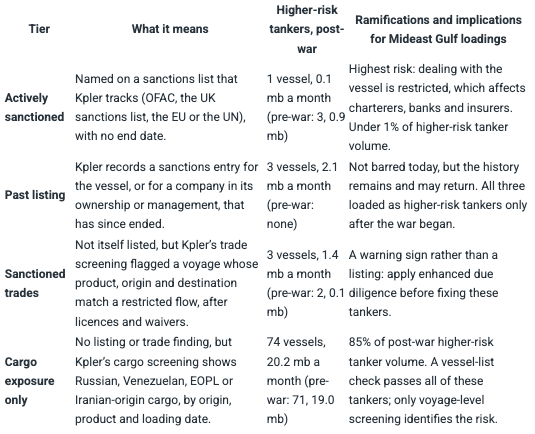
The risk in Mideast Gulf crude therefore sits mostly in cargo history rather than vessel status. Screening only against vessel lists will miss it, including the recent entrants, which show up first as cargo exposure.
Method and caveats
We started from tankers that loaded Middle East crude after carrying Iranian, Russian or Venezuelan crude, and matched each of their loadings, including receipts by ship-to-ship (STS) transfer, with the cargo they had carried earlier. We screened these 220 tankers against Kpler Risk & Compliance vessel-risk data and kept the 201 with a sanctions finding of any kind. A loading counts as one by a higher-risk tanker when the vessel had previously carried:
- Russian-origin crude, including the CPC Russia grade loaded at Novorossiysk;
- Venezuelan crude that we cannot link to a US licence; or
- cargo tagged EOPL or Iran (almost all of it EOPL).
- Scope. Mideast Gulf loadings are those at Gulf terminals (such as Al Basra, Ras Tanura, Zirku, Das Island, Mina Al-Ahmadi and Ruwais) and STS receipts in the Gulf, the Fujairah and Sohar lightering areas and the Gulf of Oman. Yanbu, Egyptian terminals and the Fujairah and Muscat terminals are excluded because their barrels do not pass through the Strait or the Gulf of Oman STS area. Only loadings that Kpler could match to an earlier cargo are counted, so this is not all Mideast Gulf crude carried by risky tankers. An earlier draft compared all Middle East loadings with Mideast Gulf clearance and gave 28% for October, which overstated the share.
- Label. “Higher-risk tanker” describes a vessel’s cargo history. It is not Kpler’s Risk & Compliance “Shadow fleet” classification, which also requires signs of opacity such as an unknown ISM manager, no IACS class or IG P&I cover, dark activity, AIS spoofing or a false flag, and it is not a legal category. It does not imply that a vessel, owner, producer, seller or buyer has breached sanctions, and Kpler data cannot establish that a cargo is lawful. 85% of the volume is carried by tankers that are not themselves listed or linked to a sanctioned trade.
- Venezuelan licences. We tested each of the 96 earlier Venezuelan loadings against the waiver and licensing period in force on the loading date and the seller, buyer, charterer and destination of the cargo. Cargoes under US authorisations are excluded: General Licence 44, Chevron’s licence, the January 2026 Vitol and Trafigura licences, General Licence 52 (March 2026) and non-China sales from 3 January 2026, including under the late-January general licence. Before the screen, 41 vessels with Venezuelan cargo loaded in the Mideast Gulf after 1 March; after it, 13 remain. The classification is an inference, not a legal determination. The General Licence 44 window follows Kpler’s methodology (19 October 2023 to 18 April 2024), and the four loadings in the General Licence 44A wind-down to 31 May 2024 are classed on other grounds. Cargoes classed “probable licence” are counted as licensed and should be verified, and nine loadings that Kpler could not match to a trade are counted as unlicensed. The accompanying dashboard shows every figure with and without the excluded group.
- Lookback and Russian crude. Cargo history has no time limit beyond January 2022, so an old Russian cargo counts: only 112 of the 263 baseline loadings followed a Russian cargo within 120 days. Russian crude is treated as risky regardless of price-cap compliance, which was not assessed, and blocked ownership or management of a vessel at the time of loading was not checked.
- Clearance and shares. For 2026, clearance is Kpler’s published daily series (Hormuz transits plus Gulf of Oman STS net exports), summed by calendar month to 31 October. We treat it as the crude and condensate series because it ties to an independent rebuild of crude clearance within 1%. For March to December 2025 it is our reconstruction from Kpler flows, within 0.3% of the published series in January and February 2026. Loadings and clearance are on different bases (loading and transit), so shares are indicative.
- Periods. The pre-war window is 12 months (1 March 2025 to 28 February 2026) and the post-war window eight months (1 March to 31 October 2026), so monthly rates are compared, not totals.
- Back-haul test. For the 112 baseline loadings that followed a Russian loading within 120 days, we read the vessel’s Kpler trades between the two. A back-haul needs an Indian discharge and no other laden voyage, including STS transfers, before the Gulf loading. Kpler shows a Mideast Gulf trade starting within three days of the loading for 32 of the 58 back-hauls; the rest may be STS receipts or date differences.

See why the most successful traders and shipping experts use Kpler